
What the Commitment of Traders report actually is
Most tools do math on price. The COT report does something different.
It counts positions.
Every week the US Commodity Futures Trading Commission publishes who is holding open futures contracts in the major markets, and it splits those holders into groups. That split is the whole point.
- Commercial hedgers deal in the real thing. A gold miner, a bank, an oil producer. They use futures to lock in prices, not to chase them.
- Non-commercial speculators are the hedge funds, managed money and large traders betting on direction for profit.
- Small traders sit below the reporting limit. Retail, mostly, and the group that tends to be last through the door.
The report lands every Friday afternoon and reflects positions held the prior Tuesday, so the data is three days old before you see it. That lag is why it is context, not a trigger.
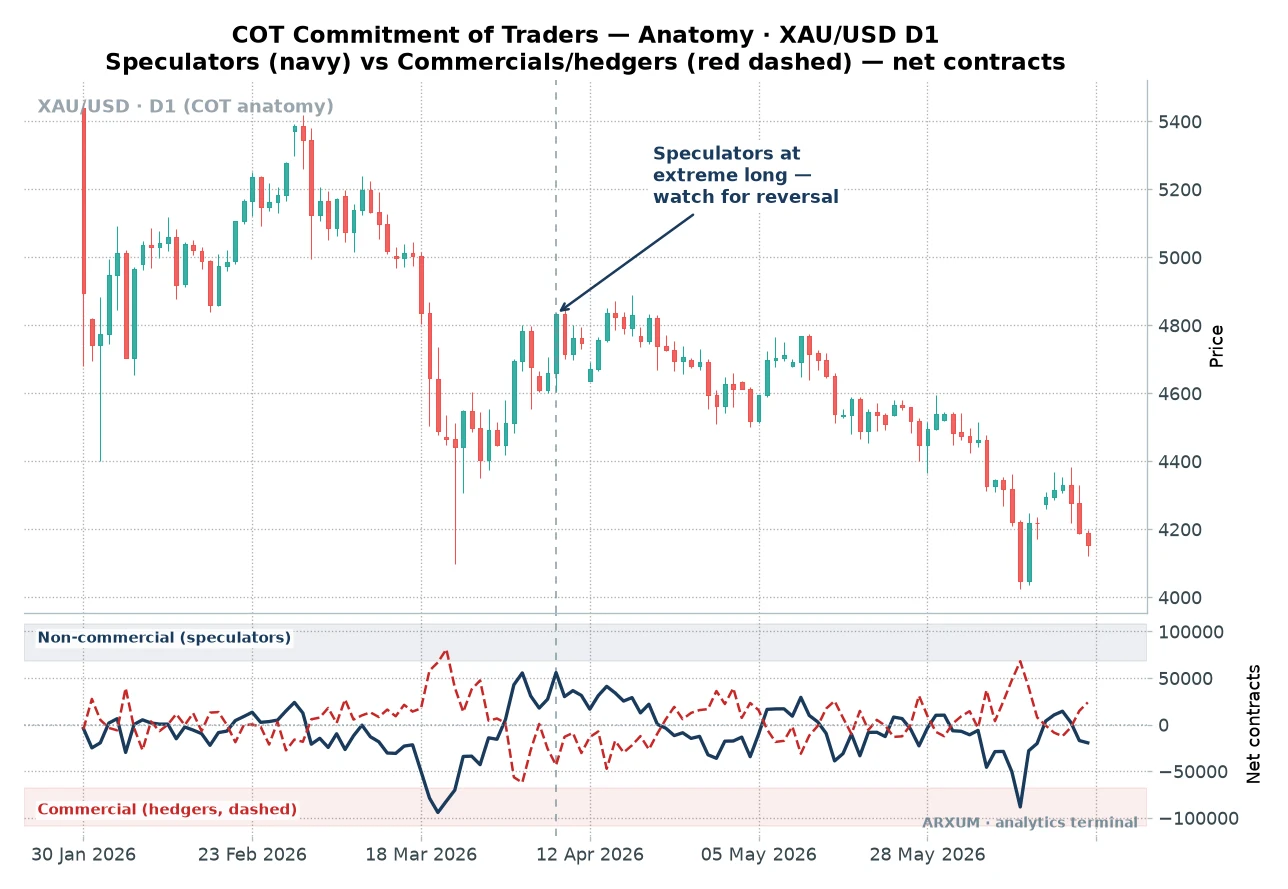
Read that gold chart from the lower panel up. The two lines are net positioning, which is simply long contracts minus short contracts for each group.
- Net long means a group holds more longs than shorts, so it is leaning bullish.
- Net short means the reverse, more shorts than longs.
- The specs and the hedgers are near mirror images. When one is heavily net long, the other is heavily net short.
The one-line read: the crowd of speculators tends to be most long right before a top and most short right before a bottom, and the hedgers sit on the other side of that trade.
The three groups in one glance
| Group | Who they are | How they trade |
|---|---|---|
| Commercial hedgers | Producers and users of the physical asset | Sell into strength, buy weakness, often early |
| Large speculators | Hedge funds and managed money | Follow the trend, crowd at extremes |
| Small traders | Retail below the reporting limit | Usually last in, often wrong at the turn |
There are two versions of the report worth knowing. The old legacy report uses the simple three-group split above.
The newer disaggregated report breaks the speculators down further into managed money and swap dealers, which is handy but not needed for a first read.
The three ways traders read the COT report
The report is one dataset with three distinct jobs. Each answers a different question, and each suits a different market and pace.
Here is each read, how it looks, and where it earns its keep.
1. Net positioning extremes: specs versus hedgers
This is the classic contrarian read, and the one the anatomy chart above already shows. You are not hunting an entry.
You are asking whether the crowd is stretched.
How it looks:
- Speculators pinned at a net-long extreme while hedgers sit at a net-short extreme means the bullish trade is crowded. Fuel is running low.
- The reverse, specs heavily net short and hedgers heavily net long, often marks ground near a bottom.
- A rising spec net-long that is not yet extreme is healthier. The trend still has buyers left to recruit.
- Watch the hedgers as the smart-money tell. They lean against the move and are usually early, so a big commercial net-long near a low is worth respecting.
The catch, stated plainly: an extreme is a warning, not a sell button. Positioning can stay stretched for weeks while price grinds higher, so this read flags risk and hands the timing to price.
Application table: net positioning extremes
| Role | How you use it | Best read |
|---|---|---|
| Reversal warning | Flag a crowded extreme, then wait for price | Specs stretched long while hedgers stretched short |
| Trend context | Back a trend that still has room to build | Spec net-long rising but not yet at the ceiling |
| Filter | Avoid fresh longs when specs are already maxed | Gold and EUR/USD on the weekly |
| Smart-money tell | Track hedgers, they sit against the crowd | Commercials heavily net long near a low |
On the desk we treated this as a permission slip, not a signal. It told us which side was crowded before we ever looked for a trigger.
2. The COT Index: crowding on a 0 to 100 scale
Raw contract counts are hard to compare. A hundred thousand net-long contracts is huge in one market and normal in another.
The COT Index fixes that.
It scales the current net position against its own range over the past year, then plots one line from 0 to 100. A reading of 100 means the most net-long that market has been all year, and 0 means the most net-short.
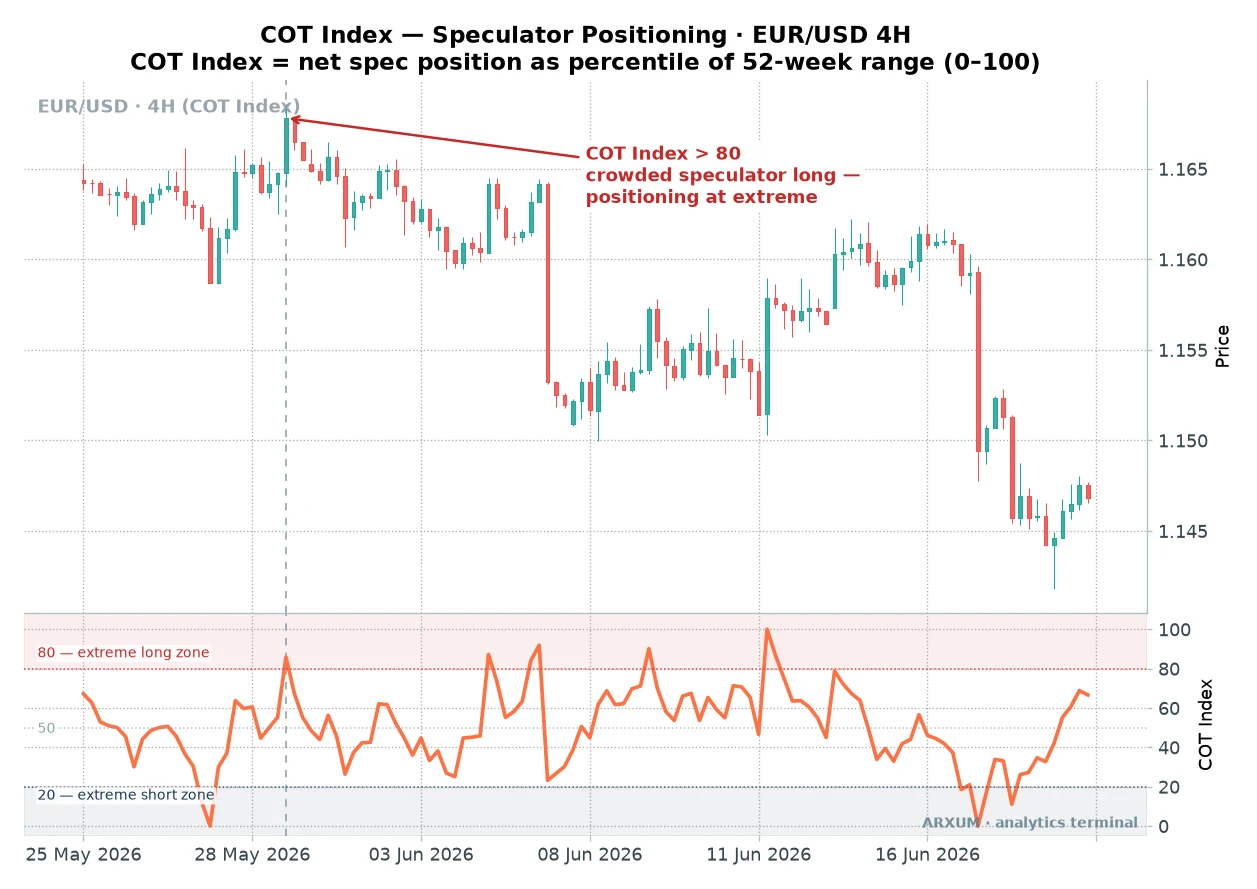
Read the EUR/USD panel like an oscillator. The single orange line is the crowding gauge, and only the extreme zones matter.
How it looks:
- Above 80 the market is near its most crowded long of the year. Reversal risk is building.
- Below 20 it is near its most crowded short. That is where washed-out positioning can turn.
- The middle carries no message. Positioning is neutral, so the index sits on the sidelines.
- The zones for a currency futures line map straight onto the pair. A crowded-long euro reading points to reversal risk in EUR/USD.
Why it beats raw contracts: because it is a percentile, you can lay gold, EUR/USD and Bitcoin side by side on the same 0 to 100 scale and see which crowd is most stretched. Raw numbers never let you do that.
Application table: the COT Index
| Role | How you use it | Best read |
|---|---|---|
| Crowding gauge | Read the single 0 to 100 line, ignore raw contracts | Above 80 crowded long, below 20 crowded short |
| Extreme flag | Treat 80-plus as reversal risk, not a sell order | EUR/USD and gold, weekly or H4 context |
| Cross-market compare | Rank crowding across markets on one scale | Gold vs EUR/USD vs Bitcoin |
| Timing filter | Wait for a price turn before acting on an extreme | Any market, slower timeframes |
3. The speculator flip: the net-spec zero-cross
The first two reads are about extremes. This one is about change.
It watches the single moment speculators swap sides.
When the net speculator line crosses zero, the crowd has flipped from net short to net long, or the reverse. That flip is a shift in how the market is positioned, and it often lines up with a change in trend.
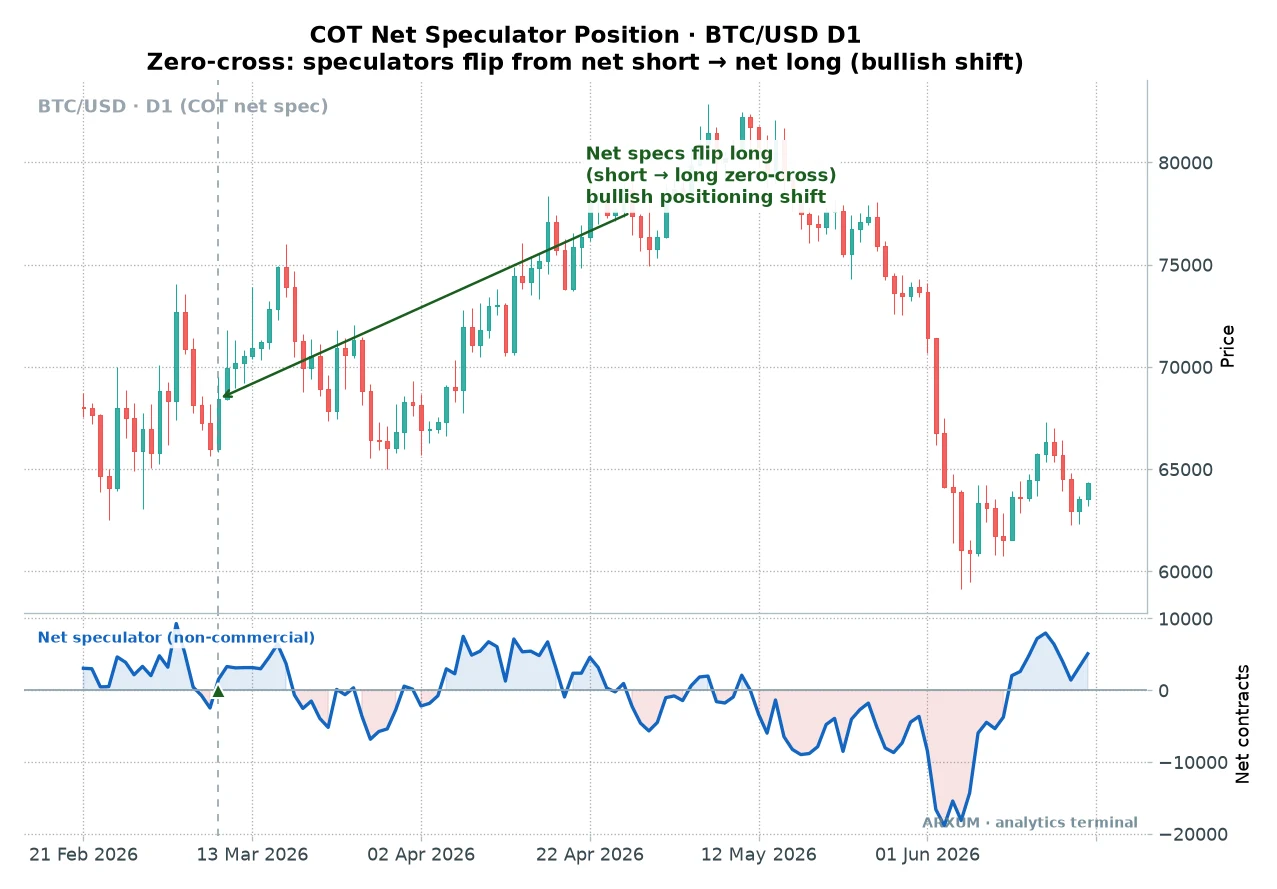
Read the Bitcoin panel simply. Above the zero line the speculators are net long and leaning bullish, below it they are net short.
How it looks:
- A cross above zero means the crowd just turned net long. When it agrees with a breakout, it backs the move.
- A cross below zero means they turned net short, a bearish lean.
- A flip after a huge run is the trap. If specs only turn net long after price has already tripled, that can be the crowd arriving at the top, not the start.
- The fill shading makes the current side obvious at a glance, which is why this read is the easiest to eyeball.
The honest limit: the flip lags. Positioning changes after price starts moving, not before, so treat the zero-cross as confirmation of a trend, never a forecast of one.
Application table: the speculator flip
| Role | How you use it | Best read |
|---|---|---|
| Regime shift | Note when net specs cross zero, short to long | The flip from net short to net long |
| Trend confirmation | Back a breakout when positioning flips with it | Bitcoin and gold on the daily |
| Direction bias | Lean long while specs hold net long, short below | D1 context for swing trades |
| Late warning | A flip after a big move can mark the crowd topping | Fast movers like Bitcoin |
Which COT read fits which market
The three reads are not rivals. You pick by what you are asking and how fast you trade.
This table is the whole guide in one place.
| COT read | What it answers | Strength | Weakness | Fits best |
|---|---|---|---|---|
| Net positioning extremes | Is the crowd stretched | Shows both camps at once | No timing, extremes persist | Gold and Forex, weekly swing |
| COT Index | How crowded, on one scale | Easy to compare markets | Hides who is on each side | Cross-market context |
| Speculator flip | Has positioning changed sides | Clear regime signal | Lags the price move | Bitcoin and trending markets |
A few plain rules of thumb drawn from that table:
- Slower is the point. The report updates weekly, so this is a swing and position trader’s tool. Reading it for a 5-minute scalp makes no sense.
- Gold and commodities read cleanest. Their hedgers are real producers with real inventory, so the commercial-versus-spec split carries genuine information.
- Forex works well. Currency futures positioning maps onto the spot pair you trade, which is why desks have watched euro and yen COT data for decades.
- Bitcoin reads weakest. More on that below, but the short version is that its futures are a small slice of a much bigger market.
Reading the COT report for Forex
The COT report and Forex fit together because currency futures track the spot pairs closely. A few things to keep straight:
- Currency futures are quoted per currency against the dollar, so a net-long euro reading is a bullish EUR/USD lean.
- The US dollar itself has no single COT line. You read the dollar’s crowding by looking across the euro, pound, yen and the rest.
- Combine it with the flows behind the carry trade and the pairs in a major-pairs breakdown to see why speculators are leaning where they are.
Pairing COT with a price signal
COT shines as the context layer, not the trigger. It answers “is the crowd stretched” while a price tool answers “where do I act”.
| Pair COT with | COT's job | What the pair looks for |
|---|---|---|
| A trend gauge like ADX | Say if the crowd still backs the trend | A strong trend while specs build, not yet maxed |
| Support and resistance | Flag a level worth watching | Price at resistance while positioning sits at an extreme |
| A reversal candle | Time a turn COT only hints at | A pin bar at resistance while specs are crowded long |
| A breakout | Confirm the move has backing | Specs flipping net long as price clears the range |
The rule across all four is the same. Let price pick the moment, and let the COT report tell you whether the crowd is set up for it or against it.
A trend tool like the ADX indicator pairs naturally here.
Where the COT report falls short
No tool is free, and honesty about the gaps is what keeps you out of trouble. Keep these in mind.
- The data is three days late. You see Tuesday’s positions on Friday, so it can never call a same-day turn.
- It covers futures, not spot. The report reads regulated US futures, so it is a proxy for the spot gold or Forex you actually trade, not a direct count of it.
- Extremes can stretch further. A crowded-long market can get more crowded for weeks. This is the single most common way traders lose money fighting it.
- Crypto positioning is thin. Only regulated Bitcoin futures show up, and those are a fraction of a market dominated by spot and offshore venues, so the crypto read is the weakest of the bunch.
- It says nothing about price levels. COT tells you who is positioned where, never where support sits. That is why it lives next to a chart, never instead of one.
Read alongside a sense of crowd psychology, these limits are the value. The report is at its best telling you when everyone already agrees, which is usually when the trade is most dangerous.
How to get the COT data and add it to your charts
You do not need a paid tool. The raw report is free, and most charting platforms plot it for you.
| Where | What to get | Note |
|---|---|---|
| CFTC website | The raw weekly report, free | Legacy and disaggregated versions |
| TradingView | Search indicators for "COT" | Community scripts, pick net non-commercial |
| TradingView | Search for "COT Index" | The 0 to 100 crowding version |
| Barchart and free COT sites | Charted history, no coding | Faster than the raw CFTC tables |
Two honest notes on setup:
- On TradingView the plain “COT” scripts plot raw net contracts, while a separate “COT Index” script gives you the 0 to 100 line, so add whichever read you want.
- The CFTC tables are a wall of numbers, so unless you like spreadsheets, a free charted source or a TradingView script saves you an afternoon.
For markets where this data reads cleanest, a guide to trading gold pairs well with the positioning view, since the hedgers there are real producers.
What works: the three things to remember
If you keep only three points from this guide, keep these.
- The COT report is a crowding gauge, not a timer. It tells you when speculators are stretched and hedgers are leaning against them. It never tells you the day of the turn.
- Use the right read for the job. Net positioning shows both camps, the COT Index compares crowding across markets on one scale, and the zero-cross flags a change of side.
- Extremes are warnings, not entries. A crowded market can get more crowded, so pair every COT read with a price signal and let the chart pick the moment.
The COT report will not call a top or a bottom on its own, and it lags by design. Used for what it is good at, spotting when everyone already agrees, it is one of the more honest sentiment reads a Forex, gold or Bitcoin trader can put on the chart.
FAQ
What is the Commitment of Traders report, in plain terms?
It is a weekly report from the US futures regulator that shows who is holding positions in a market. It sorts the big holders into commercial hedgers who deal in the physical product and non-commercial speculators like hedge funds who trade for profit. The gap between those two groups is the signal. When speculators are crowded on one side and hedgers lean the other way, positioning is stretched, which tends to snap back.
How do I read the COT report?
Start with net positioning, which is long contracts minus short contracts for each group. When speculators are heavily net long while hedgers are heavily net short, the crowd is stretched bullish and reversal risk is building. The reverse marks crowded shorts near a possible bottom. Read it as slow context on a weekly chart, never as a same-day entry trigger, because the data is three days old by the time it is published.
Is the COT report useful for Forex?
Yes. The COT report covers currency futures, and their positioning tracks the spot pairs closely, so a net-long euro reading points to a bullish EUR/USD lean. The US dollar has no single line, so you read its crowding across the euro, pound, yen and others. Desks have watched currency COT data for decades as a sentiment overlay on top of price.
Can you build a COT report trading strategy?
You can use it as the context layer inside a strategy, but not as a standalone entry system. A common approach flags a crowded extreme or a positioning flip on the COT report, then waits for a price signal, like a reversal candle at resistance or a breakout, to time the actual trade. On its own the report lags and gives no price levels, so it pairs with a chart rather than replacing one.
What is the difference between commercials and non-commercials?
Commercials are hedgers who deal in the physical asset, like a gold miner or a bank, and they use futures to lock in prices rather than chase them. Non-commercials are large speculators, the hedge funds and managed money betting on direction. Commercials sit against the trend and are often early, while speculators follow the trend and crowd at extremes. Reading the gap between them is the core of the report.
What is the COT Index?
The COT Index scales the current net position against its own range over the past year and plots one line from 0 to 100. A reading near 100 means the most net-long that market has been all year, and near 0 means the most net-short. Above 80 is treated as crowded long and below 20 as crowded short. Because it is a percentile, you can compare crowding across gold, Forex and Bitcoin on the same scale.
How often is the COT report released?
The CFTC publishes it every Friday afternoon, and it reflects positions held the prior Tuesday. That means the data is three days old by the time you see it. This lag is why the report is a weekly context tool for swing and position traders rather than a signal for intraday trading.
Does the COT report work for Bitcoin and crypto?
It works, but weakly compared with gold or Forex. Only regulated Bitcoin futures appear in the report, and those are a small slice of a market dominated by spot exchanges and offshore perpetuals. So a speculator flip on Bitcoin futures is worth noting as a positioning shift, but it captures far less of the real crowd than a gold or currency reading does.
Is the COT report a leading or lagging indicator?
It lags, and by design. Positioning changes after price starts moving, and the data itself is three days old at release. What it does well is flag when the crowd is already stretched or has just flipped sides, which is useful context. Treat it as a sentiment gauge and a confirmation tool, not a forecast of the next move.
What do the key COT terms mean?
Commercial: a hedger who deals in the physical asset and uses futures to lock in prices. Non-commercial: a large speculator like a hedge fund trading for profit. Net position: long contracts minus short contracts for a group. COT Index: net position scaled to its own past-year range, from 0 to 100. Zero-cross: the moment net speculators flip from net short to net long or back. Legacy report: the simple three-group version, versus the disaggregated report that splits speculators further.
Real-time trade setups with entry, stop loss and take profit. Daily market analysis. No subscription, no complicated theory.
🌍 Our recommended brokers


Reader Reviews
Be the first to review this — tell other traders what actually helped, or where it fell short.
Leave a Review

Forex Analyst & Senior Trader
Former FX desk trader with 8 years in institutional forex. Works in multi-timeframe analysis and order flow, turning desk experience into systematic, testable rules across forex and metals.
