
What volume spread analysis actually is
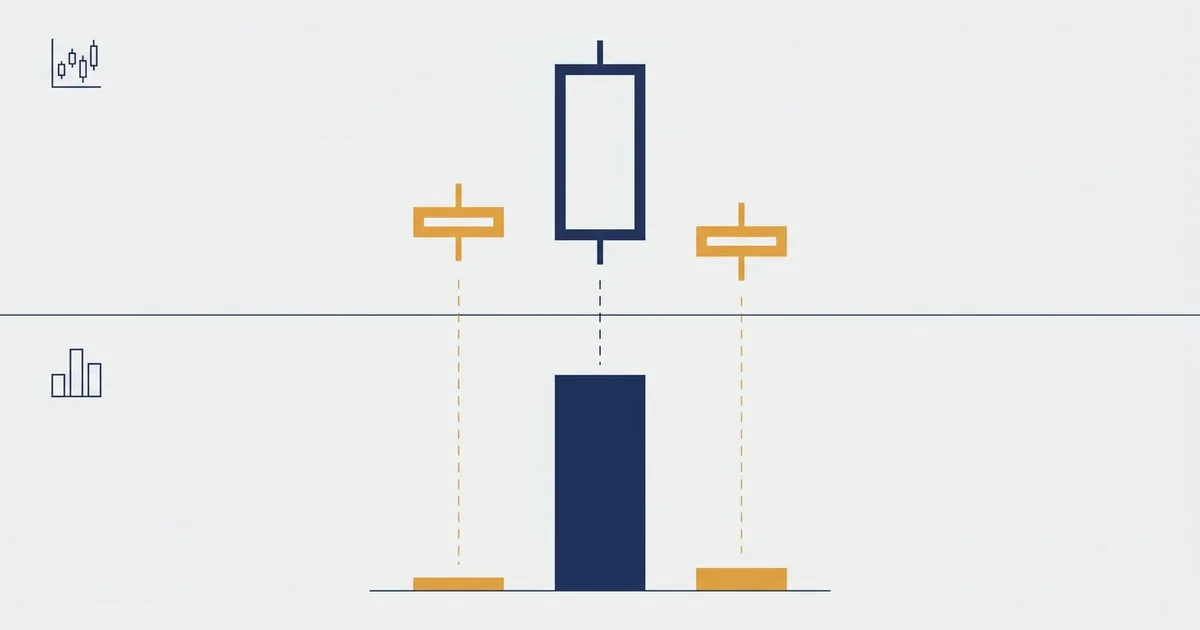
VSA is not an indicator you drop on a chart. It is a way of reading the candles you already have, using three inputs together instead of one at a time.
Every bar answers three questions, and the combination is the signal. The chart below colour codes each bar by that read, and the four colours are unpacked right under it.
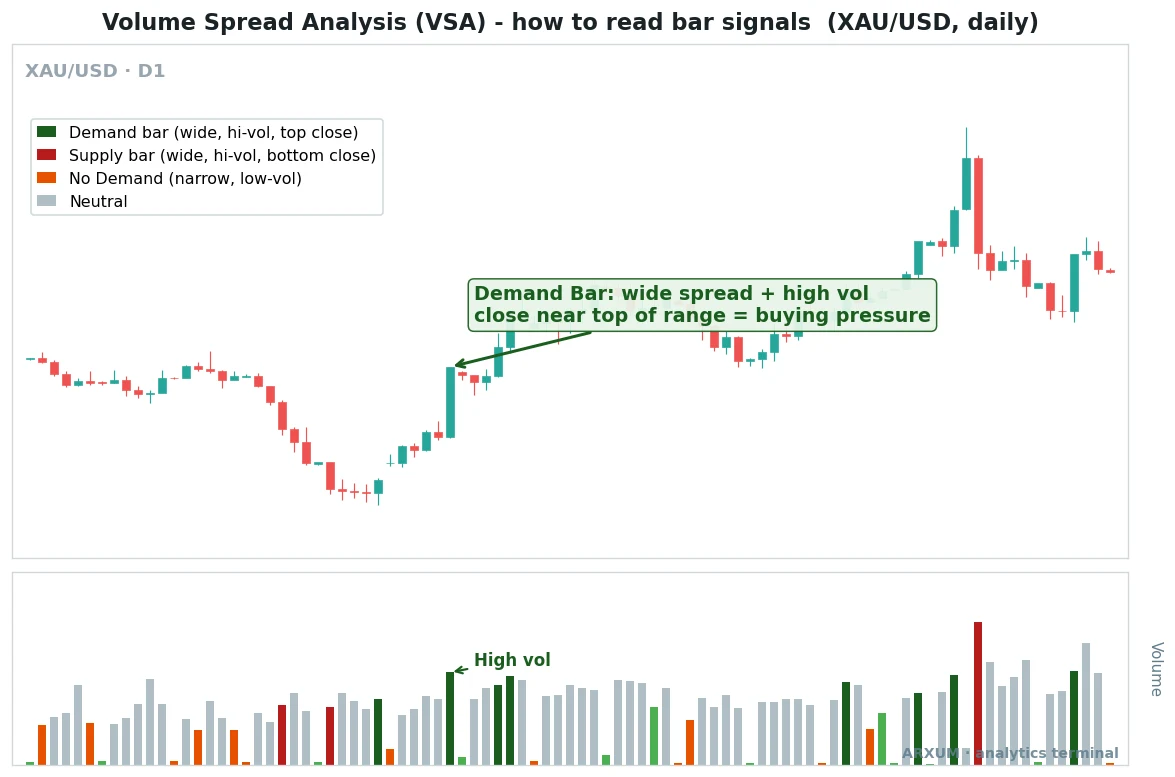
Read the gold chart above by the colour of each bar, not just its direction.
- Spread is the distance from the bar’s high to its low. Wide means a big fight between buyers and sellers, narrow means little interest.
- Volume is the bar in the panel underneath. Tall means heavy participation, short means the crowd sat out. The chart legend shortens high volume to “hi-vol” and low volume to “low-vol”.
- Close position is where price finished inside the bar. Near the top means buyers won the bar, near the bottom means sellers did.
- The colours flag the read: dark green is a demand bar, dark red is a supply bar, orange is a no demand bar, grey is neutral.
One warning before anything else. In VSA the word spread means the bar’s own high to low range, not the broker bid and ask cost you pay to trade.
They share a name and nothing else.
The three inputs in one glance
| Input | What it measures | Plain read |
|---|---|---|
| Spread | High to low range of the bar | Wide is conviction, narrow is apathy |
| Volume | Contracts or lots traded that bar | High is big money active, low is not |
| Close position | Where price ends in the range | Near high buyers win, near low sellers win |
| Direction | Up bar or down bar | Context, confirmed or denied by the other three |
The whole method is asking whether effort and result agree. Heavy volume with a big result is honest.
Heavy volume with a tiny result means someone large is absorbing the other side, and that is the tell most traders miss.
The core volume spread analysis signals
VSA has a long glossary, but four bars carry most of the weight. Learn these and you can read the rest.
Here is the shortlist, then each one on a real chart.
| Signal | What the bar looks like | What it hints |
|---|---|---|
| Demand bar | Wide spread, high volume, closes near high | Buyers stepping in, bullish |
| Supply bar | Wide spread, high volume, closes near low | Sellers distributing, bearish |
| No demand | Narrow spread, low volume, up bar closes weak | A rally with nobody behind it |
| No supply | Narrow spread, low volume, down bar | Selling has dried up, downside stalling |
The rule of thumb for all four: a strong result on strong volume confirms the move, a weak result on strong volume warns against it, and a quiet bar after a run says the fuel is gone.
The demand bar, buying pressure showing up
This is the bar marked on the gold chart at the top. It is a wide up bar that closes near its high while volume spikes.
How it looks:
- A tall candle, much wider than the bars around it.
- Volume in the panel jumps well above the recent average.
- Price closes in the top third of the bar’s range.
- It shows up at or after a low, where a fall is running out of sellers.
The read is that heavy volume met the falling price and pushed it back up by the close. Big buyers were willing to take everything offered, which is why the bar is wide and finishes strong.
On its own it is a heads up, not a trade, but at the bottom of a decline it is one of the earliest hints demand has arrived.
| Role | How you use it | Best read |
|---|---|---|
| Reversal clue | Watch for it after a sustained fall, not mid trend | D1 on gold, H4 on Forex |
| Trend read | Repeated demand bars on dips confirm an uptrend | H4 and D1, any instrument |
| Confirmation | Strongest at a known support level | Gold and BTC where volume is real |
| Filter | Ignore it if volume is only average, that is just an up bar | Any timeframe |
The supply bar, distribution in plain sight
The mirror image of the demand bar. Bitcoin shows it cleanly, because crypto reports real exchange volume rather than the tick count you get on spot Forex.
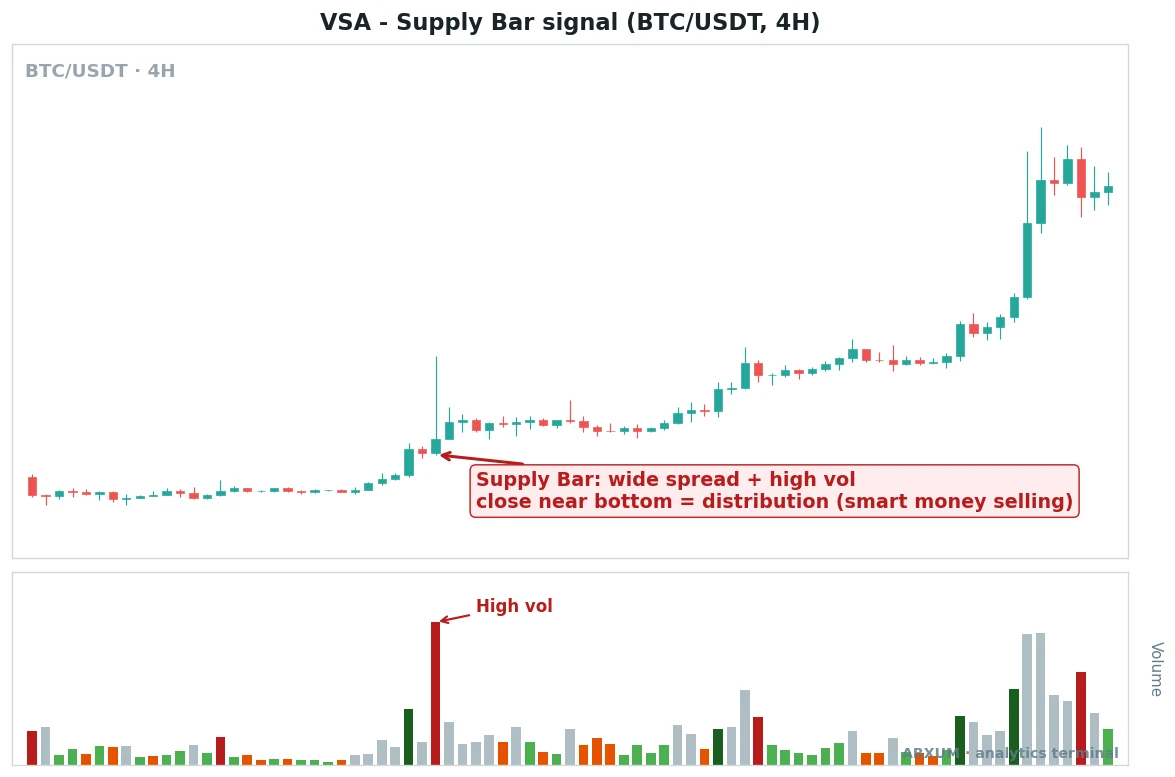
On the Bitcoin chart, the highest volume bar of the whole push closes near its low. That is the warning.
How it looks:
- A wide down bar, or a bar that spikes up then closes back near the low.
- The tallest volume bar in the recent sequence, marked “High vol” here.
- The close sits in the bottom third of the range.
- It appears after a rally, into strength, which is what makes it distribution rather than panic.
Why it matters: price is high, the crowd is buying, and yet the heaviest volume produces a weak close. Someone large is selling into the demand.
This is the VSA read that lines up with the distribution phase in Wyckoff accumulation and distribution, where smart money hands stock to the public near the top.
| Role | How you use it | Best read |
|---|---|---|
| Top warning | Flag it after an extended rally, not inside a base | H4 and D1 on BTC, gold |
| Exit cue | Tighten stops or take profit when it prints into strength | Any trending instrument |
| Short context | Pair with a lower high before acting on the short side | D1 swing trades |
| Filter | Discount it if volume is unremarkable, one weak bar is noise | Any timeframe |
No demand, the rally with nobody home
The quiet signal, and the one that catches false breakouts. EUR/USD on the 4-hour shows it during a stall.
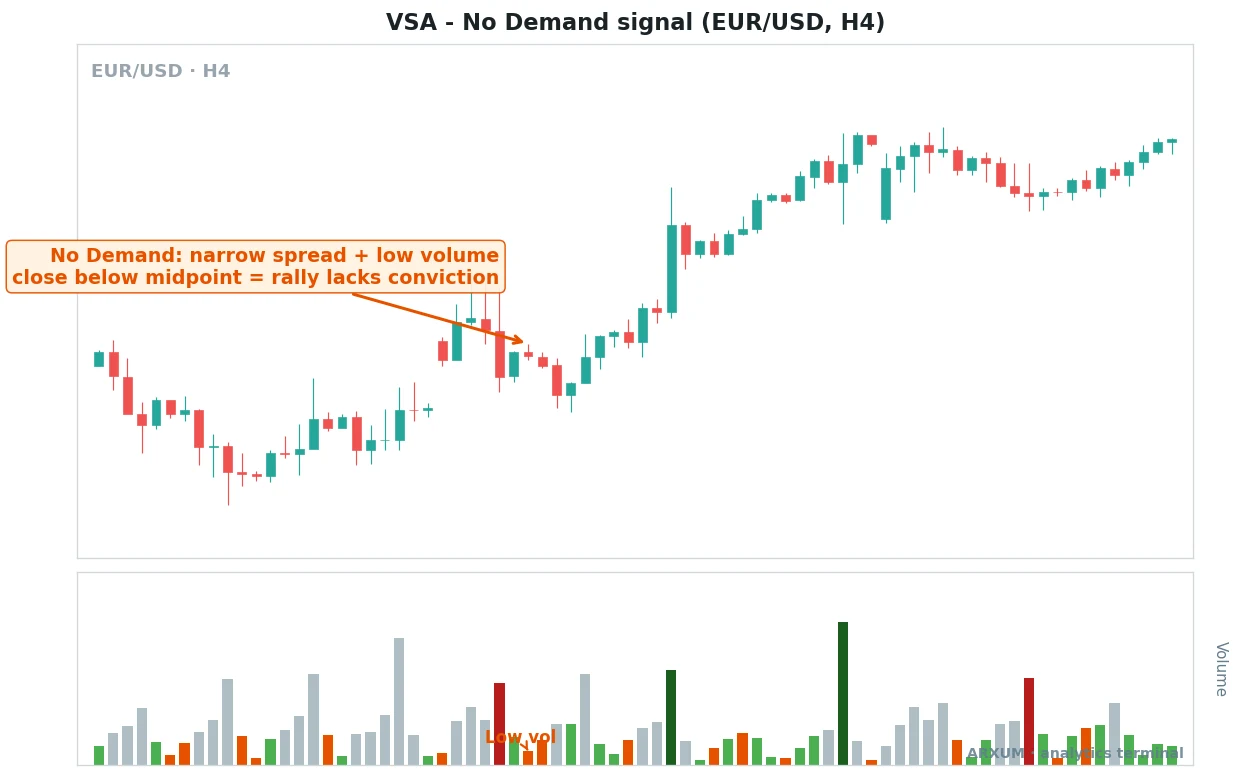
On the EUR/USD chart the up bar is small, closes weakly, and barely registers on volume.
How it looks:
- A narrow up bar, much smaller than the bars around it.
- Volume is below the recent average, marked “Low vol” here.
- The close is soft, often below the middle of the bar’s own range.
- It shows up when price is trying to push higher after a move.
What it tells you: the market wants to go up but no real money is following. If big buyers were interested, the bar would be wide and volume would be up.
A rally on no demand tends to fail, which is why VSA traders treat it as a caution against chasing the breakout.
Its cousin, no supply, is the same idea flipped: a narrow down bar on thin volume means the selling has run out, and it often marks the floor of a pullback.
| Signal | Where it fits | Best read |
|---|---|---|
| No demand | Fade or skip a rally that prints it | H4 on EUR/USD, gold |
| No supply | Look for longs when a dip prints it near support | H4 and D1, any instrument |
| False break filter | A breakout on no demand is the classic trap | Any timeframe |
| Second gauge | Confirm with the next bar before acting, one quiet bar is thin evidence | Swing timeframes |
VSA across markets and timeframes
VSA reads the same on every market, but the quality of the volume data changes what you can trust. That is the single biggest thing to get right.
The table sums up where each read is clean.
| Market | Volume quality | How much to trust it |
|---|---|---|
| Bitcoin and crypto | Real exchange volume | High, use the signals directly |
| Gold (XAU/USD) | Futures volume is real, spot is tick | Good on futures, decent on spot |
| Stock and index CFDs | Real exchange volume | High, the method's original home |
| Spot Forex majors | Tick volume, a count of price changes | Approximate, read the shape not the exact height |
Futures are standardised contracts traded on a central exchange, so like crypto they publish real traded volume, which is why both give the cleanest reads. Spot Forex is the odd one out.
Spot Forex does not report true volume, only how many times the price changed. Tick volume tracks real volume closely enough for the spread and close reads to work, but treat the exact bar height as a guide, not gospel.
Timeframe changes the meaning of a signal too.
- Daily (D1) gives the cleanest signals. One demand or supply bar carries real weight because it took a whole day of flow to build.
- 4-hour (H4) is the swing trader’s sweet spot, enough participation per bar to mean something without waiting days.
- 1-hour and below fills with noise. Narrow bars and volume blips are constant, so most single bar signals are false. Use VSA here only alongside a higher timeframe read.
- The rule: the higher the timeframe, the more a single VSA bar is worth. Fast charts need confirmation.
| Timeframe | Signal reliability | Best use |
|---|---|---|
| D1 | Strongest, one bar can stand alone | Swing bias and reversals |
| H4 | Reliable for swing entries | Timing within a daily bias |
| H1 | Noisy, needs a higher TF filter | Fine tuning an entry only |
| M15 and below | Mostly noise on its own | Skip unless scalping with confirmation |
Volume spread analysis vs standard volume and price action
Plenty of tools use volume. VSA’s edge is that it never reads volume alone.
Here is how it sits next to the alternatives.
| Approach | What it reads | How VSA differs |
|---|---|---|
| Plain volume bars | How much traded | VSA adds spread and close, so effort meets result |
| On balance volume | Running volume total by direction | VSA reads each bar, not a cumulative line |
| Order flow | Every bid and ask, tape and footprint | VSA works off standard candles, far more accessible |
| Plain price action | Candle shapes and structure | VSA weighs each candle by the volume behind it |
A few plain distinctions worth keeping:
- Versus plain volume: a volume spike tells you people traded, not who won. VSA’s close position answers the who. For a running volume tool the classic is on balance volume, which sums flow into one line rather than reading bar by bar.
- Versus order flow: order flow trading reads the raw tape, the footprint, every bid and ask. It is more precise and far harder, and it needs paid data. VSA gets you most of the same story from candles anyone can see.
- Versus price action: pure price action trading reads candle shapes alone. VSA is price action with the volume weight added, so a pin bar on heavy volume and one on thin volume are two different signals, not the same shape.
The honest summary: VSA is the accessible middle ground. It is more informative than staring at volume bars, and far cheaper and simpler than full order flow, at the cost of being a read rather than a measurement.
Common misreads that cost beginners
VSA looks simple, which is exactly why new traders overtrade it. Most of the damage comes from a handful of mistakes.
- Reading one bar in a vacuum. A single demand bar mid trend means little. Signals matter at the edges, a supply bar after a rally, a demand bar after a fall, not in the middle of a move.
- Trusting Forex volume like futures volume. Spot Forex is tick volume. The shape is useful, the exact height is not, so do not build a trade on a one pip volume difference.
- Ignoring the close position. Traders see a wide bar and stop there. A wide bar that closes in the middle is a fight, not a signal. The close is half the read.
- Trading the signal with no level. A supply bar floating in open space is weak. The same bar at a known support or resistance level is worth acting on.
- Chasing every quiet bar. No demand and no supply need the next bar to confirm. One narrow candle is a hint, not a trigger.
The takeaway: VSA trading is context first, signal second. The bar tells you what happened, the location tells you whether to care.
How to read volume spread analysis on your charts
You do not need a paid tool or a special VSA indicator. Standard candles plus the volume panel are enough, though a couple of add ons make the reads faster.
| Platform | What to add | Then |
|---|---|---|
| TradingView | Turn on the built in "Volume" indicator | Read spread and close by eye, volume in the panel |
| TradingView | Optional: "Volume" set to colour by up or down | Helps spot the effort versus result mismatch |
| MetaTrader 4 and 5 | Attach the built in Volumes indicator | Remember MT shows tick volume on Forex |
| Any platform | A moving average on volume, length around 20 | Defines what "high" and "low" volume mean today |
Two honest notes on the setup:
- There is no single official VSA indicator that prints buy and sell arrows for you. Community scripts exist, but the skill is reading the three inputs yourself, and a plain volume panel is all you truly need.
- Put a 20 period moving average on the volume itself. It draws the line between high and low volume, so a spike is a spike relative to the recent norm, not a guess.
To read a chart live, walk it in this order:
- Find the context. Is price at the end of a rally, the end of a fall, or mid trend. Signals only matter at the turns.
- Check the spread. Wide or narrow versus the last several bars.
- Check the volume. Above or below its own moving average.
- Check the close. Top, middle, or bottom of the bar’s range.
- Combine. Wide plus high volume plus a strong close in the right context is a real signal. Anything half hearted is not.
What works: three things to remember
If you keep only three ideas from this guide, keep these.
- Effort versus result is the whole game. High volume with a big directional result confirms the move. High volume with a weak result warns that someone large is on the other side. That mismatch is the heart of VSA.
- Context beats the bar. A demand bar after a fall and a supply bar after a rally carry weight. The same bars mid trend are noise. Always read the location before the signal.
- Volume quality decides your trust. Read crypto and futures signals directly, treat spot Forex tick volume as a close approximation, and lean on the daily and 4-hour charts where a single bar actually means something.
VSA will not call an exact top or bottom, and it lags the fastest reversals like any read built on closed bars. Used for what it is good at, spotting where big money is active behind an ordinary looking candle, it turns the volume panel from decoration into one of the more honest tells on the chart.
Pair it with a level and a candlestick trigger, size the trade to a sensible risk-reward ratio, and it earns its place.
Glossary: the key VSA terms
- Volume spread analysis (VSA): reading spread, volume and close position together to judge whether big money is buying, selling or absent.
- Spread: the bar’s own high to low range. Nothing to do with the broker bid and ask cost.
- Close position: where price finishes inside the bar’s range, top, middle or bottom.
- Demand bar: a wide up bar closing near its high on high volume, a sign of buying.
- Supply bar: a wide bar closing near its low on high volume, a sign of selling into strength.
- No demand: a narrow up bar on low volume, a rally with no real buying behind it.
- No supply: a narrow down bar on low volume, a fall with the selling exhausted.
- Effort versus result: comparing the volume (effort) with the size and close of the bar (result). A mismatch is the core VSA signal.
- Distribution: large holders selling into demand near a top, the Wyckoff term VSA borrows.
- Tick volume: a count of price changes used as a volume stand in on spot Forex, where true volume is not reported.
FAQ
What is volume spread analysis, in plain terms?
Volume spread analysis, or VSA, is a way of reading ordinary candles using three things at once: the spread, meaning the bar's high to low range, the volume traded that bar, and where price closed inside the range. Together they hint at whether large traders are buying, selling, or sitting out. A wide bar closing near its high on heavy volume points to buying. A wide bar closing near its low on heavy volume points to selling. A narrow, quiet bar after a move warns the interest has faded. It is not an indicator you install, it is a skill of reading price and volume together.
What does spread mean in volume spread analysis?
In VSA, spread means the bar's own range from its high to its low. A wide spread is a big fight between buyers and sellers, a narrow spread means little interest. This is a completely different thing from the broker spread, which is the gap between the bid and ask price you pay to trade. They share the word and nothing else. When VSA talks about a wide spread demand bar, it means a tall candle, not an expensive one.
What are the main VSA signals?
Four bars carry most of the weight. A demand bar is a wide up bar closing near its high on high volume, a sign buyers stepped in. A supply bar is a wide bar closing near its low on high volume, a sign sellers distributed into strength. No demand is a narrow up bar on low volume, a rally with nobody behind it. No supply is a narrow down bar on low volume, meaning the selling has dried up. All four matter most at the turns, a supply bar after a rally or a demand bar after a fall, rather than in the middle of a trend.
Does volume spread analysis work?
It works as a read, not as a mechanical system that prints exact entries. VSA is good at spotting where large traders are active behind an ordinary looking candle, which helps you avoid chasing rallies with no buying behind them and spot distribution near a top. It works best on markets with real volume, like crypto and futures, and on higher timeframes like the daily and 4-hour. It is weaker on fast charts, where noise drowns the signals, and on spot Forex, where only tick volume is available. Treat it as context that improves your other tools, not a standalone edge.
What is the difference between volume spread analysis and price action?
Pure price action reads candle shapes and structure on their own, a pin bar is a pin bar regardless of volume. Volume spread analysis is price action with the volume weight added. To VSA, a pin bar on heavy volume and the same shape on thin volume are two different signals, because one had real participation and the other did not. In short, price action asks what the candle looks like, VSA asks what the candle looks like and how much money was behind it. VSA is the more complete read where reliable volume data exists.
Is VSA the same as order flow trading?
No, they sit at different levels of detail. Order flow reads the raw tape, every bid and ask, using footprint charts and depth of market. It is precise but demanding and usually needs paid data. VSA gets a similar story, where is big money active, from standard candles and a volume panel that anyone can see for free. Think of VSA as the accessible version of the same idea. It is less exact than order flow but far easier to learn and use, which is why retail traders reach for it first.
Does volume spread analysis work on Forex?
Yes, with one caveat. Spot Forex does not report true volume, only tick volume, which counts how many times the price changed rather than how much was traded. Tick volume tracks real volume closely enough that the spread and close reads still work, but the exact bar height is an approximation. So on EUR/USD or gold spot you can trust the shape of a signal, a narrow no demand bar or a wide supply bar, while treating the precise volume level as a guide. On crypto and futures, where volume is real, the reads are exact.
What is the best timeframe for VSA?
The daily and 4-hour charts. On the daily, a single demand or supply bar carries real weight because it took a full day of flow to form. The 4-hour is the swing trader's sweet spot, with enough participation per bar to mean something without waiting days. On the 1-hour and faster, narrow bars and volume blips are constant, so most single bar signals are false and you need a higher timeframe to filter them. As a rule, the higher the timeframe, the more one VSA bar is worth.
Do I need a special VSA indicator?
No. Standard candles plus the built in volume panel are all you truly need, since VSA is about reading spread, volume and close position yourself. Community scripts exist that try to label bars for you, but they cannot judge context, which is half the read. The one genuinely useful add on is a moving average on the volume, around 20 periods, so you can see at a glance whether a bar's volume is high or low relative to the recent norm. Beyond that, the skill is in your eyes, not in an indicator.
How do I trade a VSA signal?
Read it as context, then let another tool time the entry. First check the location, a supply bar only matters after a rally, a demand bar after a fall. Then confirm the bar has wide spread, high volume and a close in the right end of its range. From there, wait for a trigger at a known support or resistance level, such as a candlestick reversal, rather than acting on the VSA bar alone. Set your stop beyond the signal bar and size the position to a sensible risk-reward ratio. VSA marks where big money is active, your trigger and level decide when to act.
Real-time trade setups with entry, stop loss and take profit. Daily market analysis. No subscription, no complicated theory.
🌍 Our recommended brokers


Reader Reviews
Be the first to review this — tell other traders what actually helped, or where it fell short.
Leave a Review

Forex Analyst & Senior Trader
Former FX desk trader with 8 years in institutional forex. Works in multi-timeframe analysis and order flow, turning desk experience into systematic, testable rules across forex and metals.
