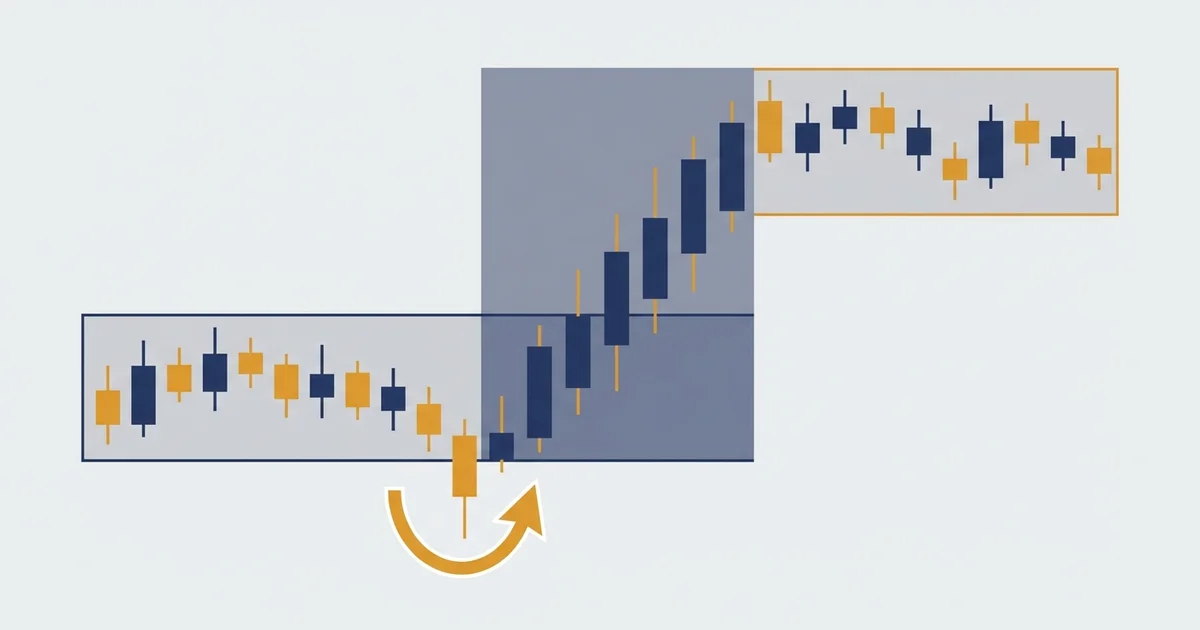

What accumulation manipulation distribution actually is
The accumulation manipulation distribution model says the day’s real move often starts with a fake one. Here is a full cycle on spot gold (XAU/USD), one ordinary trading day on the 30-minute chart.
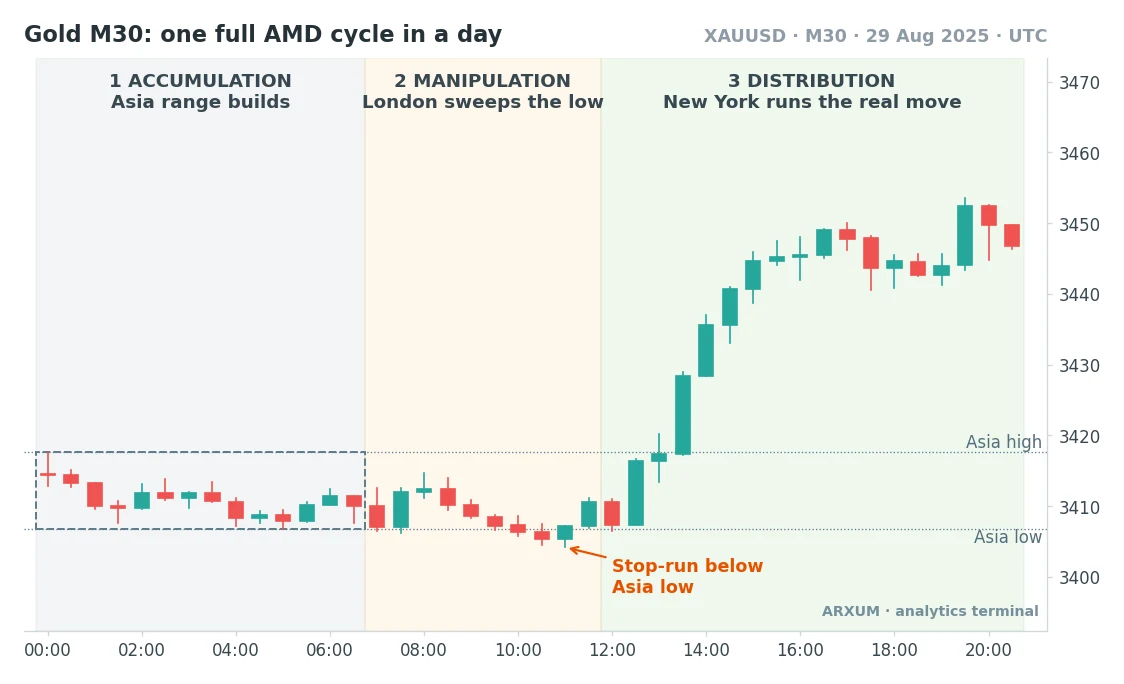
Read the chart left to right, one zone at a time:
- Accumulation (grey, about 00:00-06:45 UTC). Small candles, tight range, no direction. The dashed box hugs the session’s real high and low, roughly a $10 band on gold here.
- Manipulation (beige, about 07:00-11:45 UTC). London pushes price out of the box on the wrong side. On this day it slides under the Asia low, then stalls.
- The orange arrow marks the stop-run. Stops from traders who bought the range sit just below the Asia low, and price goes and takes them.
- Distribution (green, from about 12:00 UTC). Price reverses hard, reclaims the whole Asia range and rallies roughly $45 above where the stop-run turned.
The point to take away: the first break of the range was the trap, and the move in the opposite direction was the trade.
Why the cycle forms: liquidity and stop orders
The logic behind AMD is about where orders sit, not about a secret group moving price. Large players need someone on the other side of a big order, and a cluster of stops is exactly that.
| Phase | What the crowd does | What price does |
| Accumulation | Trades the range edges | Builds a tight box |
| Manipulation | Stops get triggered | Spikes past one edge |
| Distribution | Chases late, wrong side | Trends the other way |
A few terms carry the whole idea, so here they are in plain words:
- Liquidity means resting orders. In this context it mostly means stop-loss orders parked just above a range high or just below a range low.
- A stop-run, also called a liquidity sweep or stop hunt, is a short push through those levels that fills the stops and then fails. Our guide to liquidity pools shows where these clusters tend to sit.
- The Judas swing is ICT’s name for the manipulation leg. It is the early move that “betrays” traders who follow it.
- Displacement is the strong, fast candle (or two) that starts distribution. It is the market showing its hand.
- Power of 3 (PO3) is the ICT label for the whole three-step cycle, used for a single candle or a whole session.
None of this needs a conspiracy. A thin, quiet session builds obvious levels, the next session’s volume runs through them, and once the stops are filled the bigger flow decides the direction.
AMD vs Wyckoff accumulation and distribution
AMD borrows its words from Wyckoff, so the two get mixed up. They are related, but they work on very different clocks.
| Feature | Wyckoff | AMD / Power of 3 |
| Typical span | Weeks to months | One day or session |
| Fake-out name | Spring / upthrust | Manipulation / Judas |
| Main clock | Price structure | Session times |
| Where it is used | Swing, position | Intraday, day trading |
- The Wyckoff spring is the same trick as the AMD manipulation, just slower: a dip under support that traps sellers before the markup. The Wyckoff accumulation schematic walks through it.
- Do not confuse either one with the accumulation/distribution indicator, which is a volume line from a formula, not a session model.
- Wyckoff gives you the multi-week story. AMD gives you the intraday timing inside it.
Strategy 1: the session AMD (Asia, London, New York)
This is the classic accumulation manipulation distribution read, and the one most traders mean by “AMD forex”. The clock does half the work, so set your chart to UTC before anything else.
| Session | Rough window (UTC) | AMD role |
| Asia (Tokyo) | 00:00-06:30 | Accumulation |
| London open | 07:00-10:00 | Manipulation |
| London-NY overlap | 12:00-16:00 | Distribution |
| Late New York | 16:00-21:00 | Fade or hold |
These windows move by an hour when Europe and the US change their clocks, so check them against our forex market hours guide twice a year.
How it looks on EUR/USD (H1)
The mirror image of the gold day: here the stop-run goes above the Asia high, and the real move is down.
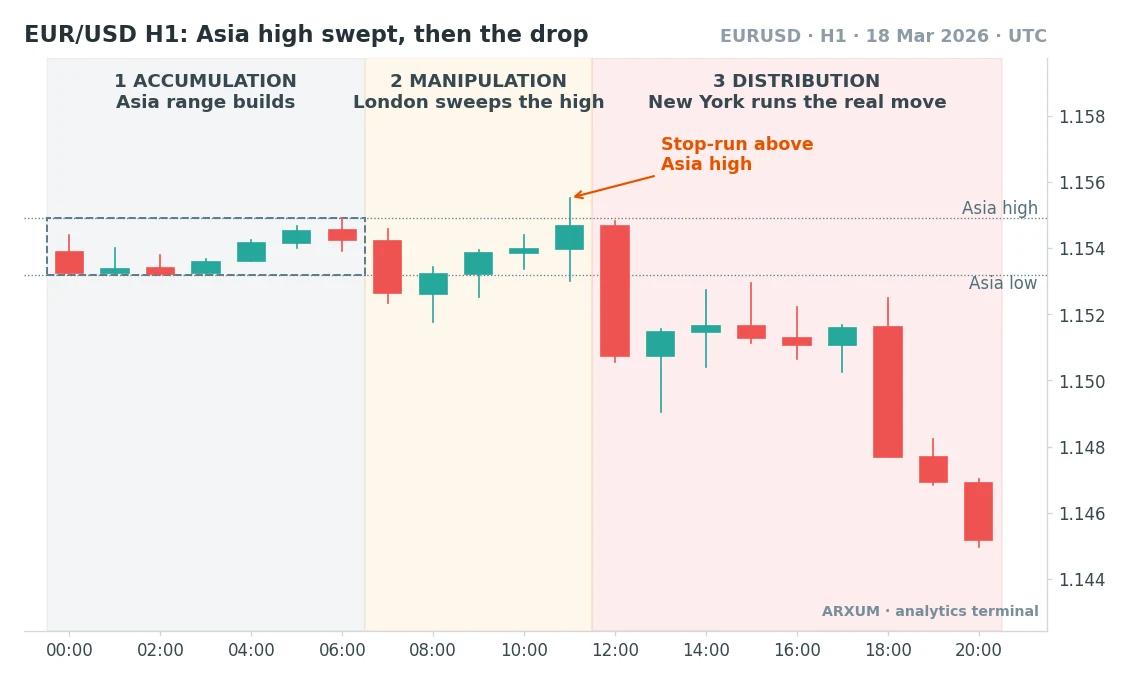
What to notice on the candles:
- The Asia box is tiny, under 20 pips. A tight accumulation is what you want, since it makes the levels obvious to everyone.
- The stop-run is one wick, not a breakout. Price spikes above the Asia high and closes back inside within the same hour.
- The first distribution candle is large and red, and it closes below the Asia low. That is displacement: the range broke on the side opposite the sweep.
- After that, price never returns to the Asia high. A distribution leg that keeps away from the manipulation extreme is the healthy version.
Roles in the session AMD
| Role | How you use it | Best read |
| Range map | Mark Asia high/low | M15-H1, all FX |
| Bias | Expect sweep vs trend | H4/D1 direction |
| Entry trigger | Sweep, then reclaim | M5-M15 at London |
| Confirmation | Displacement close | M15-H1 |
| Exit cue | Opposite range side | Prior day high/low |
- Bias comes first. If the daily trend is up, you expect London to sweep the Asia low, not the high, and you only look for longs.
- The trigger is the reclaim, not the sweep itself. Wait for price to close back inside the Asia box after the stop-run.
- The confirmation is a displacement candle through the middle of the range, often leaving a fair value gap (a three-candle gap where price moved too fast to trade both ways).
- A natural first target is the opposite side of the Asia range, then the previous day’s high or low.
Rule of thumb: the side that gets swept is usually the side you do not trade.
Strategy 2: AMD on crypto and faster timeframes (BTC M15)
Bitcoin trades all weekend and has no official sessions. The AMD shape still shows up, because the big desks and the volume still follow the London and New York clock.
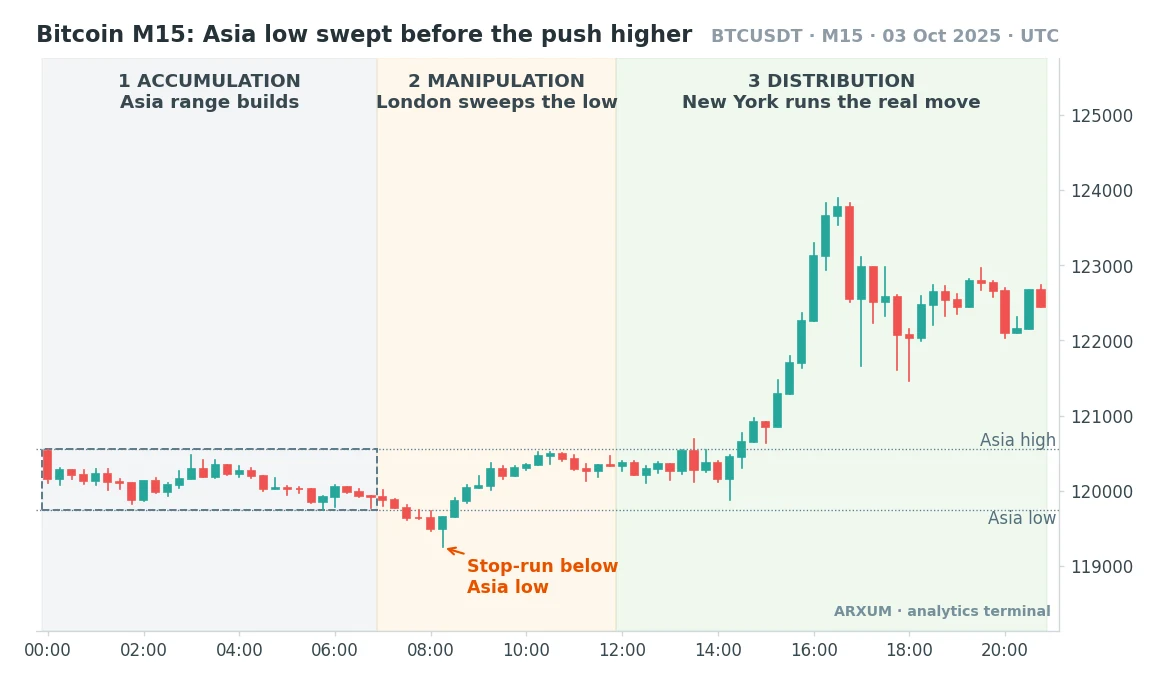
Here is how the crypto version differs from the FX one:
- The manipulation leg tends to be deeper in dollar terms. Bitcoin’s stop-runs can take out several hundred dollars before they turn.
- The reclaim takes longer. On this day price chopped around the Asia range for hours before New York finally pushed it out.
- Distribution on crypto often arrives in one violent burst, then stalls. Late in the session you get the wide, two-way candles seen after the peak.
- Weekend ranges are a separate animal. Many crypto traders treat Monday’s Asia range as a fresh accumulation and ignore the thin weekend tape.
Timeframe ladder: matching the chart to the read
| Timeframe | What it shows | Use it for |
| D1 / H4 | Trend and key levels | Bias only |
| H1 | Full day's AMD | Context, targets |
| M30 / M15 | Sweep and reclaim | Main working chart |
| M5 / M1 | Tiny structure shifts | Fine entry, scalps |
- The lower you go, the more fake AMD cycles you will “see”. An M1 chart draws a dozen mini sweeps an hour, and most of them mean nothing.
- One working chart (M15 or M30) plus one bias chart (H4 or D1) is plenty for most people.
- If you scalp the M1-M5 version, read our scalping strategy guide first, because spreads eat small sweeps alive.
Roles by instrument
| Instrument | Clean AMD days | Typical quirk |
| Gold (XAU/USD) | Frequent | Deep, fast sweeps |
| EUR/USD | Frequent | Tight Asia box |
| GBP/USD | Frequent | Wider London fake-out |
| Silver, oil | Sometimes | Noisier, wider ranges |
| Bitcoin | Sometimes | 24/7, weekend gaps |
“Frequent” here is a trader’s read of how often the shape is clean, not a measured statistic. Gold and the euro pairs are where most people learn it, since the Asia box is easy to draw.
Strategy 3: the Power of 3 candle (daily and weekly AMD)
The same accumulation manipulation distribution logic fits inside one candle. ICT’s Power of 3 says a bullish daily candle often opens, dips below its open first, then closes near its high.
| Candle part | AMD phase | What you see |
| Open area | Accumulation | Price near the open |
| Lower wick | Manipulation | Dip against the day |
| Body to close | Distribution | Real move, the day's range |
How the candle version is used:
- On a bullish day, the lower wick is the manipulation. Traders who expect an up day look to buy below the daily open, not above it.
- On a bearish day it flips. The upper wick is the fake rally, and selling above the open is the idea.
- The weekly version stretches the same shape across days. A common read is a Monday-Tuesday range, a midweek fake move, then the week’s real direction into Thursday and Friday.
- Higher-timeframe PO3 is a bias tool. You still need the session read (Strategy 1) to find the actual entry.
Daily open and midnight open
| Reference level | Why it matters | Best use |
| Daily open | Splits cheap vs expensive | Buy below in uptrend |
| Midnight New York | ICT's day anchor | Same idea, ICT style |
| Weekly open | The week's anchor | Swing bias |
- Draw one horizontal line at the daily open each morning. It takes seconds and frames every later move.
- If price is above the open in the London session on a day you expect to be bullish, the manipulation may already be done, or may still be coming. Wait for it rather than chase.
The confirming gauges: how to tell manipulation from a real breakout
The hard part of AMD is that a stop-run and a genuine breakout look identical for the first few candles. These are the reads traders use to separate them.
| Gauge | Manipulation looks like | Real breakout looks like |
| Candle close | Wick out, close back in | Body closes outside |
| Follow-through | Stalls fast | Keeps extending |
| Structure | Shifts against sweep | Holds with the break |
| HTF trend | Against the trend | With the trend |
| News timing | Quiet London open | Data release spike |
What each one means in practice:
- The close is the cleanest tell. A sweep pokes out and closes back inside the range. A breakout closes outside and stays there.
- A market structure shift is when price breaks the last small swing in the opposite direction after the sweep. Our market structure guide covers how to mark those swings.
- The higher-timeframe trend decides which sweep you trust. A sweep of the Asia low in a daily uptrend is the textbook long setup.
- High-impact news (NFP, CPI, central bank days) breaks the model. A data spike is not manipulation, it is new information.
- Range size matters too. If the Asia box is already wider than a normal day’s move, there is little room left for distribution. The ATR indicator gives you that “normal day” yardstick.
Which AMD read to use, and when
| You are a... | Use this read | Main chart |
| FX day trader | Session AMD | EUR/USD M15 |
| Gold day trader | Session AMD | XAU/USD M30 |
| Crypto trader | Session AMD, wider stops | BTC M15 |
| Swing trader | Weekly PO3 for bias | D1 / H4 |
| Scalper | Sweep and reclaim only | M1-M5 |
- If you can only watch one window a day, watch the London open to early New York. That is where both the manipulation and the start of distribution happen.
- If you cannot watch intraday at all, the session AMD is not for you. Use the weekly Power of 3 for bias and a slower opening range breakout style of entry instead.
- When the day is not clean (no clear Asia box, or a wide messy one), skip it. AMD is a pattern you wait for, not one you force.
How to read AMD on your own chart
You can draw all of this on a free TradingView chart or in MT4/MT5. There is no single built-in “AMD” indicator, so do not hunt for one.
| Step | Tool | Setting |
| Set the clock | Chart timezone | UTC |
| Mark the Asia box | Rectangle tool | 00:00-06:30 UTC |
| Extend the levels | Horizontal line | Asia high and low |
| Anchor the day | Horizontal line | Daily open |
| Shade sessions | Session indicator | Optional, see note |
- On TradingView, set the timezone in the bottom-right corner of the chart. Draw the Asia box with the Rectangle tool so its top and bottom touch the session’s highest and lowest wicks.
- Session shading is optional. TradingView’s indicator search has community scripts listed under terms like “sessions” or “killzones”, and they vary a lot, so check the times they use against your own UTC window.
- In MT4/MT5, server time is often not UTC. Work out your broker’s offset once, then draw the box in server time.
The read, step by step
- Check the H4 or daily chart and write down a bias: up, down, or no idea. No idea means no trade today.
- When Asia closes, draw the box around its real high and low.
- Into the London open, watch the side of the box your bias says will be swept. Up bias means watch the Asia low.
- Wait for the sweep and a close back inside the box. A body close outside means it may be a real breakout, so stand aside.
- Look for displacement: a strong candle back through the middle of the box, ideally breaking a small swing (the structure shift).
- Plan the stop beyond the sweep’s extreme and the first target at the opposite side of the box. Check the risk/reward ratio before you place it, written as 1:X, where 1 is what you risk and X is how many times that you aim to make.
Sizing an AMD trade on a small account
The stop in an AMD trade sits beyond the stop-run wick, so it is set by the chart, and the position size follows from it. Using a 2% risk rule on a $1,000 account, the risk budget is $20.
| Step | EUR/USD example | Gold example |
| Risk budget | $1,000 × 2% = $20 | $1,000 × 2% = $20 |
| Stop distance | 15 pips | $6 per ounce |
| Risk per micro lot | 15 × $0.10 = $1.50 | $6 × 1 oz = $6 |
| Micro lots | $20 ÷ $1.50 = 13.3 | $20 ÷ $6 = 3.3 |
| Lot to enter | 0.13 lot | 0.03 lot |
These are worked-math examples with round numbers, not results. A micro lot is 0.01 lot: 1,000 units of EUR/USD, worth about $0.10 per pip, or 1 ounce of gold, worth $1 per $1 move.
- Round down, never up. 13.3 becomes 13 micro lots (0.13), and 3.3 becomes 3 (0.03).
- On EUR/USD, 0.13 lot is about $15,000 of exposure, roughly 1:15 effective leverage on $1,000. Broker leverage of 1:100 or more is just margin room that lets you open that size; the 2% stop is what caps the risk.
- If the gold sweep is deep and the stop has to be $25, the math gives 0.8 micro lots, which you cannot open. On a small account that is the day to use EUR/USD instead, or skip.
- To place it, use a limit or market order after the reclaim, type the stop price beyond the sweep wick in the stop-loss field, and the opposite side of the Asia box in the take-profit field.
Spreads matter more than usual here. The entry sits near a fresh spike, when spreads can widen, so a broker with tight spreads on the London open is worth having.
Common AMD mistakes
- Trading the sweep as a breakout. The whole point of the model is that the first break is often fake.
- Calling every wick a manipulation. A sweep needs an obvious level (the Asia high or low, the prior day’s high or low) with stops behind it.
- Ignoring the bias. A sweep of the Asia high in a strong daily uptrend is often just the trend starting early.
- Drawing the Asia box in the wrong timezone. An hour off and every “sweep” is in the wrong place.
- Forcing a cycle on news days. On NFP or a central bank decision, the session logic breaks down.
- Drifting to the M1 chart to find more setups. More cycles on screen does not mean more good ones.
What works with accumulation manipulation distribution
The short version to remember:
- The sweep is the warning, the reclaim is the trigger. Wait for price to close back inside the Asia range before you act.
- Bias decides the side. Let the H4 or daily trend tell you which edge should get swept, and only trade that version.
- Displacement confirms it. A strong candle back through the range, ideally with a structure shift, is the market showing the real direction.
The risk, kept honest
AMD is a timing and context framework, so treat it like one:
- It describes many days, not every day. Some days build no clean box, some sweep both sides, and some just trend from the open.
- Losing streaks will come. If you hit 3-6 losses in a row, the market’s behaviour may have changed (a news-heavy week, a holiday tape), so pause and reassess rather than double the size.
- Do not revenge-trade a sweep that kept going. If the “manipulation” turned into the real move, the stop did its job.
- Keep one bad week in proportion. If AMD keeps failing over a longer stretch, step back and check whether you are reading the bias or the sessions wrong, before deciding it no longer suits your market.
- Only trade money you can afford to lose. The pattern gives you a plan, not a guarantee.
For the wider picture, the smart money concepts guide places AMD next to order blocks and fair value gaps, and our gold AMD smart money walkthrough goes deeper on the gold version.
Key terms
- Accumulation: the quiet range-building phase, usually the Asian session.
- Manipulation: the stop-run beyond one edge of that range, often at the London open.
- Distribution: the real directional move that follows, often into New York.
- Power of 3 (PO3): ICT’s name for the AMD cycle, applied to a candle or a session.
- Judas swing: the fake early move of the manipulation phase.
- Liquidity sweep / stop-run: a quick push through a level that fills the stops resting there, then fails.
- Displacement: a strong, fast candle that starts the real move.
- Market structure shift: a break of the last small swing against the sweep, a sign the direction has turned.
FAQ
What is accumulation manipulation distribution, in plain terms?
It is a model that splits a trading day into three parts. The market builds a quiet range, then fakes a move out of one side to trigger stops, then makes its real move the other way. In forex and gold, those parts usually line up with the Asian, London and New York sessions.
Is AMD the same as ICT's Power of 3?
Yes. Power of 3 is ICT's name for the same accumulation, manipulation and distribution cycle.
Does the AMD trading strategy actually work?
It works as a framework, not as an automatic signal. It helps you avoid buying a fake breakout and tells you when and where to look for the day's real move. It fails on news-driven days and on days with no clean range. You get the most from it when you combine it with the higher-timeframe trend and wait for price to reclaim the range after the sweep.
What timeframe is best for AMD?
Most traders work the M15 or M30 chart for the sweep and reclaim, and use the H4 or daily chart for bias. The H1 chart is good for seeing the whole day at a glance. Below M5, you see so many mini cycles that the signal turns into noise, and spreads take a bigger share of each trade.
What are the AMD session times?
In UTC, accumulation is roughly 00:00-06:30 (Asia), manipulation around the London open at 07:00-10:00, and distribution from about 12:00 into the London-New York overlap. These shift by an hour when daylight saving changes, so check them twice a year.
Does AMD work on Bitcoin and crypto?
Often, yes. Crypto has no official sessions, but its volume still rises when London and New York open, so the same shape appears. The sweeps tend to be deeper, so stops need more room, and weekend trading is thin enough that many traders ignore weekend ranges.
How is AMD different from Wyckoff accumulation and distribution?
Wyckoff describes ranges that build over weeks or months, with a spring or upthrust as the fake-out. AMD applies the same idea to a single day or session and times it with the clock. Many traders use Wyckoff for the bigger picture and AMD for intraday timing.
How much money do I need to trade AMD?
A $500-$1,000 account is enough on EUR/USD, where micro lots let you size a 15-pip stop to 2% risk. Gold can be harder, because a deep sweep may need a stop too wide to fit even one micro lot on a small account.
Is there an AMD indicator on TradingView?
There is no built-in one. You draw the Asia range with the rectangle tool, set the chart to UTC and mark the daily open. Community "sessions" or "killzones" scripts can shade the windows, but check their times against your own.
What do the main AMD terms mean?
Accumulation is the quiet range, manipulation is the fake move that takes stops, and distribution is the real move afterwards. A liquidity sweep or stop-run is the push through a level that triggers stops. Displacement is the strong candle that starts the real move. A market structure shift is when price breaks the last small swing against the sweep.
Real-time trade setups with entry, stop loss and take profit. Daily market analysis. No subscription, no complicated theory.
🌍 Our recommended brokers


Reader Reviews
Be the first to review this — tell other traders what actually helped, or where it fell short.
Leave a Review

Momentum Trader & Technical Analyst
Trades momentum across crypto and forex since 2019, built around RSI, MACD, and volume. Turns discretionary setups into rule-based, systematic entries and validates them on data before they go live.
