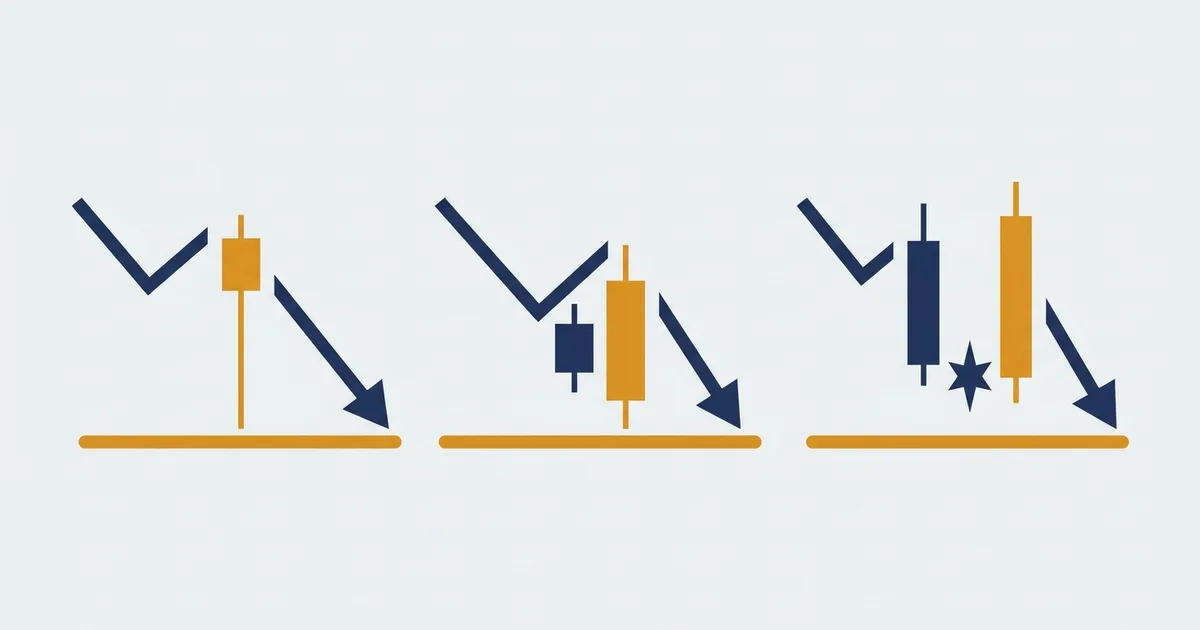

What bullish candlestick patterns actually are
A bullish candlestick pattern is a snapshot of a fight between buyers and sellers, told in one to three candles. It flags the moment sellers run out of steam near a low.
Here is the textbook version of the three core ones, side by side.
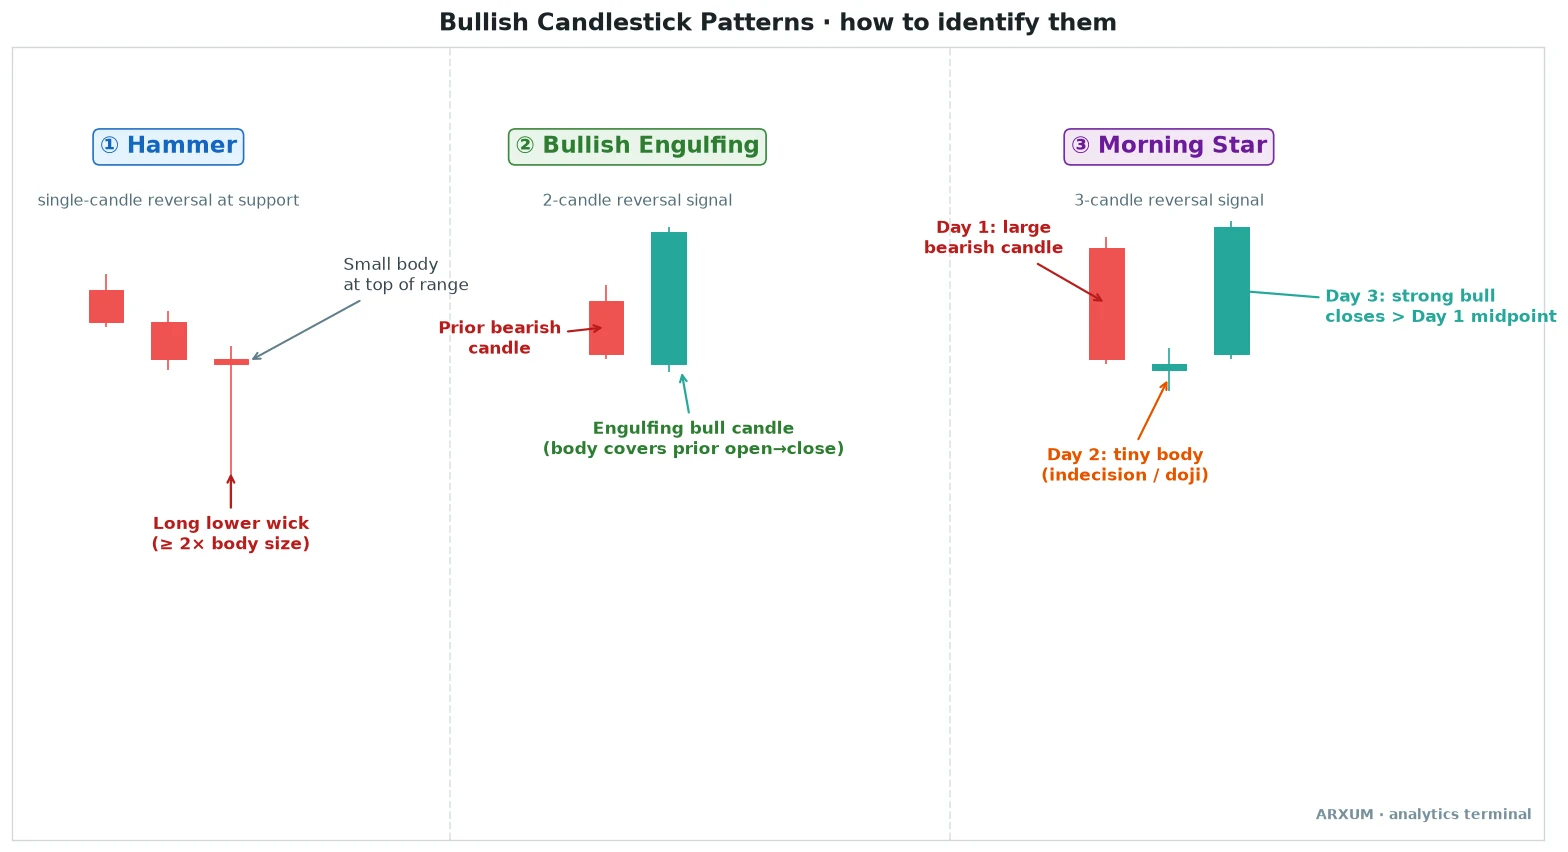
With the picture on screen, the shared logic is easy to name. Every bullish reversal pattern is really the same story told at different lengths.
- They appear after a decline. A reversal needs something to reverse. These shapes only mean anything at the bottom of a move, not in the middle of a range.
- They show sellers failing. A long lower wick, a full engulfing body, a recovery candle: each one is a picture of a down push that got bought back.
- They close strong. The signal is in the close, not the wick. A candle that gives back its gains before the bell is not a bullish pattern, whatever it looked like intraday.
- They are locations, not systems. A pattern tells you where buyers showed up. It does not tell you the trend has turned. That part is your job, using context.
The single most useful habit is to stop treating these as buy buttons. Read them as a question (“are buyers defending this level?”) and let the trend and the level answer it.
The hammer: a one-candle reversal at support
The hammer is the simplest bullish signal and the one beginners meet first. It is a single candle with a small body up top and a long wick hanging below.
How it looks:
- A small real body near the top of the candle’s range, colour barely matters.
- A long lower wick, ideally at least twice the height of the body.
- Little or no upper wick.
- It lands after a fall, usually right into a support level or a round number.
The story is clean. Sellers drove price down hard during the session, then buyers dragged the close back up near the open.
The long wick is the footprint of that rejection. An inverted hammer flips the wick to the top and carries a similar, slightly weaker message.
For the full family, including the hanging man that looks identical but means the opposite at a top, see the hammer candlestick guide.
| Role | How you use it | Best read |
|---|---|---|
| Entry cue | Buy on the next candle closing above the hammer’s high | D1 on gold, H4 on crypto |
| Location filter | Only trust it at prior support or a swing low | Any market |
| Confirmation | A strong close the next candle, not the wick alone | H4 and higher |
| Skip it | Mid-range, no trend, no level below it | H1 and lower |
A hammer with nothing under it is just a candle. A hammer sitting on a level buyers have defended before is a signal worth acting on.
The bullish engulfing: buyers take the wheel
The bullish engulfing is a two-candle pattern and one of the most trusted bullish reversal candlestick patterns for a reason: the shift of control is visible in a single glance.
How it looks:
- A small bearish candle first, the last gasp of the sellers.
- A larger bullish candle next, whose body opens below the prior close and shuts above the prior open.
- The green body fully covers the red body before it (wicks do not have to be engulfed, the bodies do).
- Bigger is better: the more decisively the up candle swallows the down one, the stronger the signal.
Here is what the hammer and the engulfing look like on a real chart, on spot gold.
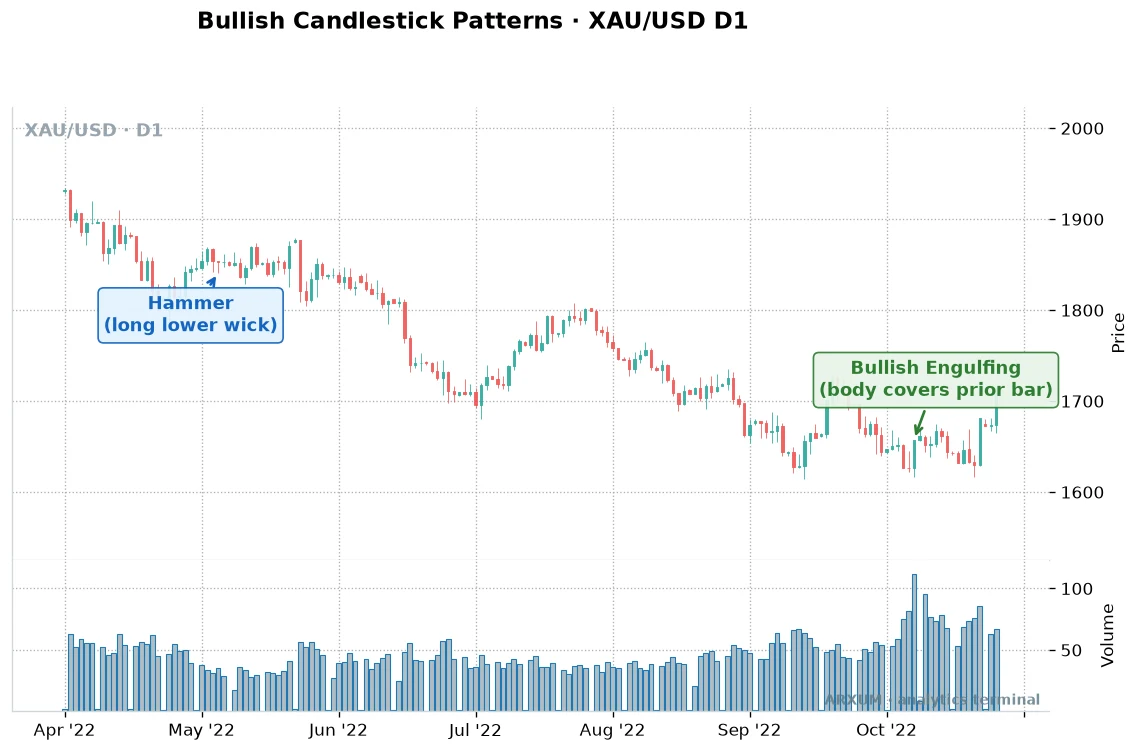
Notice that neither pattern turned the whole trend by itself. Gold was in a broad decline, and both shapes marked pauses and short bounces rather than a permanent bottom.
That is the honest read: an engulfing candle tells you buyers won that bar, not that they won the war. For the deep dive on both the bullish and bearish versions, see the engulfing candle guide.
| Role | How you use it | Best read |
|---|---|---|
| Reversal trigger | Enter on the close of the engulfing candle | D1 and H4 |
| Strength gauge | Bigger engulfing body means stronger conviction | Any market |
| Trend filter | Best with price near or above the 200-EMA | Gold, Forex |
| Volume tell | On crypto, a volume spike adds weight | BTC, H4 |
The morning star: a three-candle turn
The morning star is the most complete of the three. It takes three candles to build, which makes it slower to form but harder to fake.
How it looks, left to right:
- A long bearish candle, the trend still falling with conviction.
- A small-bodied candle or doji, the pause, where sellers and buyers reach a standoff. This candle often gaps or sits below the first.
- A strong bullish candle that closes back above the midpoint of the first candle.
That middle candle is the whole idea. It is the market catching its breath.
When the third candle then pushes up hard, it confirms the pause was buyers taking over, not just a rest. Here it is on Bitcoin.
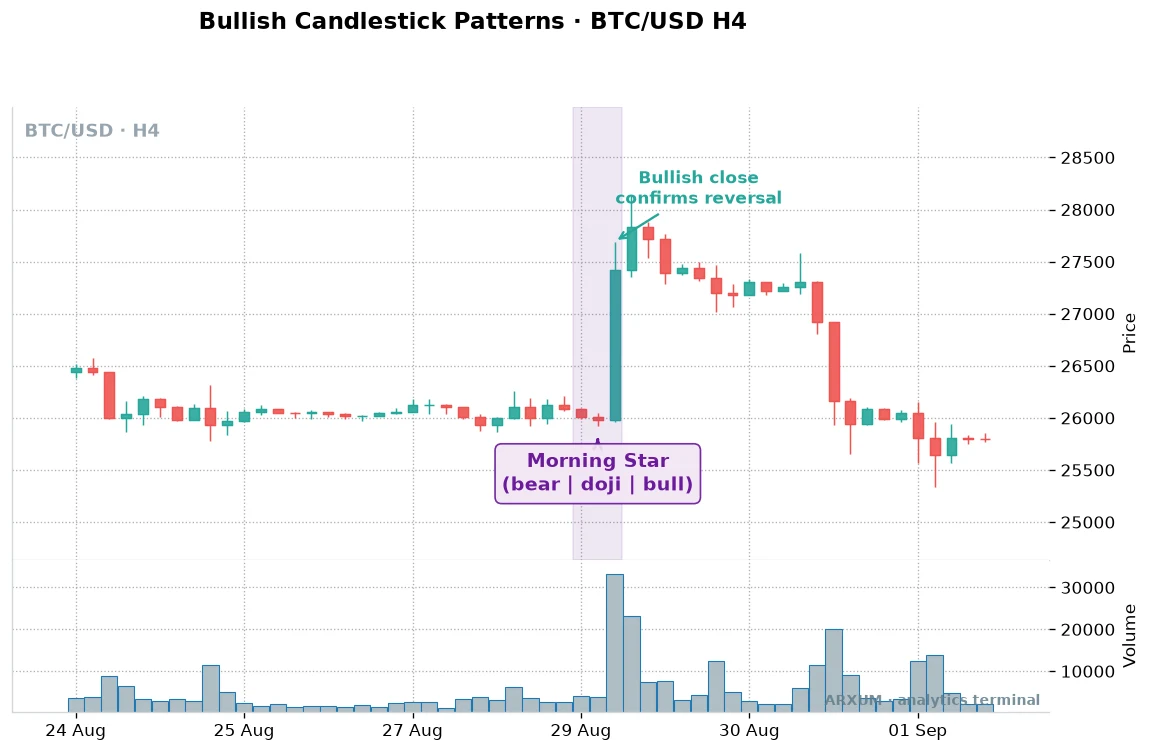
The morning star has a bearish twin, the evening star, that forms the same way at a top. Both sit in the morning star pattern guide alongside the three white soldiers.
| Role | How you use it | Best read |
|---|---|---|
| Reversal signal | Act on the close of the third candle | H4, D1 |
| Patience filter | Wait for candle three, do not pre-empt | Any market |
| Depth check | Third candle should clear the first’s midpoint | Any market |
| Context | Strongest at a well-tested support zone | Gold, BTC |
The wider bullish roster
The big three cover most of what a chart throws at you, but the family is larger. These are the other bullish reversal candlestick patterns worth recognising, kept to a glance.
| Pattern | Candles | What it looks like | Signal strength |
|---|---|---|---|
| Hammer | 1 | Small body, long lower wick at a low | Moderate |
| Inverted hammer | 1 | Small body, long upper wick after a fall | Weaker |
| Bullish engulfing | 2 | Up candle swallows the prior down candle | Higher |
| Piercing line | 2 | Up candle closes past the midpoint of the prior down candle | Moderate |
| Morning star | 3 | Bear, pause, strong bull close | Higher |
| Three white soldiers | 3 | Three rising candles with small wicks | Higher, but rare |
| Tweezer bottom | 2 | Two candles sharing an identical low | Moderate |
| Dragonfly doji | 1 | Long lower wick, open and close together at the top | Weaker alone |
| Bullish harami | 2 | Small up candle held inside a big down candle | Weaker |
A few notes on that list, since a table cannot carry everything:
- The dragonfly doji is really a hammer with no body at all. Treat it the same way, and read more on the family in the doji candlestick guide.
- The harami is the opposite of an engulfing: the small candle sits inside the big one. It signals hesitation, not a hard turn, so it is a heads-up rather than a trigger.
- Three white soldiers is powerful when it appears, but it is uncommon and often shows up after the easy money has already moved.
Bullish versus bearish: the mirror
Every bullish reversal pattern has a bearish twin that forms the same way at the top of a rally. If you can read one side, you can read the other by flipping it.
Learning the bearish candlestick patterns alongside the bullish ones is the fastest way to double your vocabulary.
| Bullish, at support | Bearish mirror, at resistance | The tell |
|---|---|---|
| Hammer | Shooting star | Long wick rejecting one side |
| Bullish engulfing | Bearish engulfing | One body swallows the last |
| Morning star | Evening star | Three-candle turn |
| Piercing line | Dark cloud cover | Close past the prior midpoint |
| Three white soldiers | Three black crows | Three candles marching one way |
| Dragonfly doji | Gravestone doji | Doji with a long single wick |
| Tweezer bottom | Tweezer top | Two matching extremes |
The logic never changes, only the direction and the level. A hammer at support says buyers defended a floor; a shooting star at resistance says sellers defended a ceiling.
Same candle, opposite location, opposite meaning.
Which patterns to actually trust
The honest answer to “what are the most reliable bullish candlestick patterns” is that reliability comes from context far more than from the shape. The same hammer is a strong signal at support in an uptrend and near-worthless in the middle of a range.
That said, some patterns carry more weight than others on their own:
- Higher trust: bullish engulfing, morning star, three white soldiers. More candles and bigger bodies mean the shift of control is clearer and harder to fake.
- Moderate trust: hammer, piercing line, tweezer bottom. Real signals that usually need a confirming close before you act.
- Lower trust alone: dragonfly doji, inverted hammer, bullish harami. Useful as a nudge, weak as a standalone trigger.
None of that is a promise. A high-trust pattern in the wrong regime still fails, and a modest one in a perfect location can pay.
Rank them, then let the context override the ranking.
How they read across markets and timeframes
The same pattern behaves differently depending on where and when it prints. This is the part most guides skip, and it matters more than the shape names.
| Market and timeframe | How the patterns read | Watch for |
|---|---|---|
| Gold (XAU/USD), D1 | Clean, each candle reflects a real session | Trade the shape, ignore tick volume |
| Bitcoin (BTC/USD), H4 | Frequent signals, real traded volume helps | Use a volume spike as confirmation |
| FX majors (EUR/USD), H4 | Reliable at key levels, tighter ranges | Pair the pattern with support |
| Any market, H1 and below | Mostly noise, patterns print constantly | Use only to fine-tune a higher-TF setup |
Two rules of thumb fall out of that table:
- Higher timeframe, more meaning. Each daily candle represents far more real trading than a 1-hour one, so the pattern carries more weight.
- Volume only helps on crypto. Exchanges report real traded volume, so a spike confirms. Gold and Forex show tick volume, a count of price updates rather than money traded, so ignore it and lean on the trend and the level.
Confirmation and context: making a pattern count
A candlestick pattern is a trigger, not a plan. What turns it into a signal worth acting on is everything around it.
Stack a couple of these filters and the weak setups fall away on their own.
- Trend first. A bullish pattern works best when the larger trend already agrees, or at a level where a downtrend is stretched and due a bounce. The 200-period moving average is the simplest gauge; read more in the EMA guide.
- Location second. The strongest patterns sit right on support, a prior swing low, or a round number where buyers have shown up before.
- Confirmation third. Wait for the pattern candle to close, and often the next candle too. Acting mid-candle is guessing; the close is the signal.
- Size your risk before you act. A pattern gives you a natural place for a stop, just below the low of the hammer or the star. Keep the reward worth the risk, and never stake more than a small, fixed slice of the account on one read. The risk-reward guide covers the maths.
None of these patterns is a money machine. They win over many trades, not every trade, and a run of failed signals in a choppy market is normal.
Treat them as one input, keep the risk small and consistent, and let the ones that line up with the trend and the level do the heavy lifting.
Common mistakes
The patterns are simple. The errors are predictable.
- Trading them mid-range. With no trend to reverse and no level to defend, a hammer is just a candle. Location is not optional.
- Acting before the close. A perfect hammer that gives its wick back by the bell is not a hammer. Wait for the close.
- Ignoring the trend. A single bullish candle does not outweigh a strong downtrend. Best case it marks a bounce, not a bottom.
- Chasing tick volume on gold and Forex. That spike is not real trading volume. It misleads more than it helps.
- Treating every pattern as equal. A three-candle morning star at support is not the same bet as a lone doji in the middle of nowhere.
What works: the short version
If you keep three things about bullish candlestick patterns, make it these.
- Context beats shape. A pattern at support, in a trend that agrees, is worth ten of the same pattern floating in a range. Read the location first.
- Wait for the close, then confirm. The signal is the strong close, not the intraday wick. The big three, hammer, bullish engulfing, and morning star, all earn their trust on the close.
- Match the market. Trade the shape on gold and Forex and ignore the volume; use the volume spike on crypto. Higher timeframes mean more, lower ones mostly print noise.
Learn these three well and the rest of the family reads as variations on the same theme. For where these patterns sit inside the bigger picture of price structure, see the chart patterns guide.
Glossary
- Bullish candlestick pattern: a one-to-three-candle shape that hints a decline is ending and buyers are returning.
- Real body: the thick part of a candle, between the open and the close.
- Wick (or shadow): the thin line above or below the body, marking the high and low of the session.
- Engulfing: when one candle’s body fully covers the previous candle’s body.
- Doji: a candle whose open and close are almost equal, showing indecision.
- Support: a price level where buyers have stepped in before, often halting a fall.
- 200-EMA: the 200-period exponential moving average, a common trend filter.
- Tick volume: a count of price updates, shown by gold and Forex platforms in place of real traded volume.
- Confirmation: a follow-through close that verifies the pattern before you act.
FAQ
What are bullish candlestick patterns?
Bullish candlestick patterns are short shapes on a price chart, made of one to three candles, that suggest a fall is running out of steam and buyers are returning. The best known are the hammer, the bullish engulfing, and the morning star. Each one is a picture of sellers failing near a low, and each works best at support after a decline rather than in the middle of a range.
What is the most reliable bullish candlestick pattern?
On the shape alone, the bullish engulfing and the morning star tend to be the most reliable, because the shift of control is clear and hard to fake. But reliability comes from context far more than the shape. The same pattern is strong at support in a trend that agrees and near-worthless mid-range. Rank the patterns, then let the location and trend override the ranking.
Do bullish candlestick patterns actually work?
They work as a location and timing tool, not as a standalone system. A pattern tells you buyers showed up at a level; it does not tell you the trend has turned. Used with a trend filter, a support level, and a confirming close, they earn their keep. Traded blindly on every appearance, they fail often. They win over many trades, not every trade.
What is the difference between a hammer and a bullish engulfing?
A hammer is a single candle with a small body and a long lower wick, showing sellers were rejected within one session. A bullish engulfing is two candles: a small down candle followed by a larger up candle that swallows it whole. The hammer is a rejection at a low; the engulfing is a clear handover of control. The engulfing is generally the stronger of the two.
What is the difference between bullish and bearish candlestick patterns?
They are mirror images. Bullish patterns form at the bottom of a fall and hint buyers are returning; bearish candlestick patterns form at the top of a rally and hint sellers are taking over. A hammer at support mirrors a shooting star at resistance, a morning star mirrors an evening star, and a bullish engulfing mirrors a bearish one. Same shapes, opposite location and meaning.
What timeframe works best for bullish candlestick patterns?
Higher timeframes are more reliable, because each candle reflects more real trading. The daily is the core read on gold and Forex, and the 4-hour works well on crypto and prints more setups. The 1-hour and below produce constant patterns that are mostly noise, so use them only to fine-tune an entry a higher timeframe already set up.
Do bullish candlestick patterns work on gold and Forex?
Yes, and the daily chart is where they read cleanest on gold and the majors. The one adjustment is volume: gold and Forex platforms show tick volume, a count of price updates rather than money traded, so a volume spike is unreliable there. On those markets, trust the pattern, the trend, and the support level, and save the volume confirmation for crypto.
How many candles make a morning star?
Three. A long bearish candle, then a small-bodied candle or doji that marks a pause, then a strong bullish candle that closes back above the midpoint of the first. The middle candle is the key: it shows sellers losing control, and the third candle confirms buyers stepped in. It is slower to form than a hammer but harder to fake.
Do you need volume to confirm a bullish candlestick pattern?
It depends on the market. On Bitcoin and crypto, exchanges report real traded volume, so a surge on the reversal candle is a genuine tell worth waiting for. On gold and Forex, the platform shows only tick volume, which is unreliable. Use volume as confirmation on crypto and lean on the trend and support level everywhere else.
Where do you enter after a bullish candlestick pattern?
Wait for the pattern candle to close, then act on the next candle. For a hammer, buy the close above the hammer's high; for an engulfing or a morning star, act on the close of the signal candle. Put the stop just below the low of the pattern, since a break of that low means the reversal has failed. Keep the risk small and fixed on every trade.
Real-time trade setups with entry, stop loss and take profit. Daily market analysis. No subscription, no complicated theory.
🌍 Our recommended brokers


Reader Reviews
Be the first to review this — tell other traders what actually helped, or where it fell short.
Leave a Review

Forex Analyst & Senior Trader
Former FX desk trader with 8 years in institutional forex. Works in multi-timeframe analysis and order flow, turning desk experience into systematic, testable rules across forex and metals.
