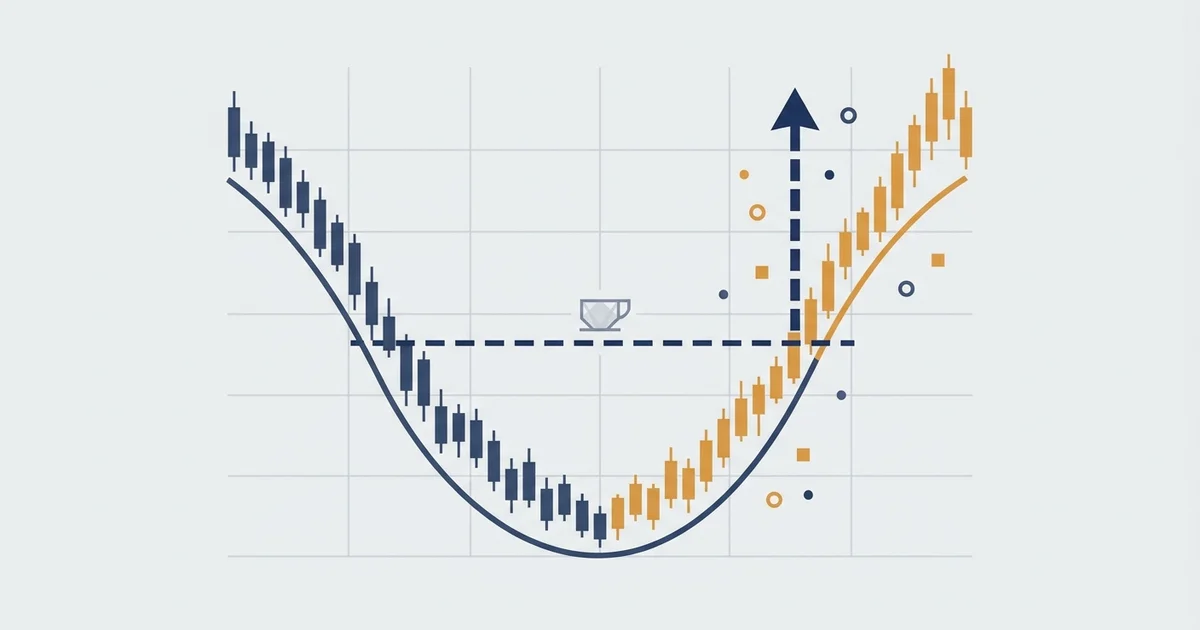

What the rounding bottom pattern actually is
A rounding bottom is a market changing its mind slowly. Sellers run out of energy, price flattens, and buyers take over so gradually that the turn looks like a bowl rather than a spike.
Here is the shape the way a textbook draws it.
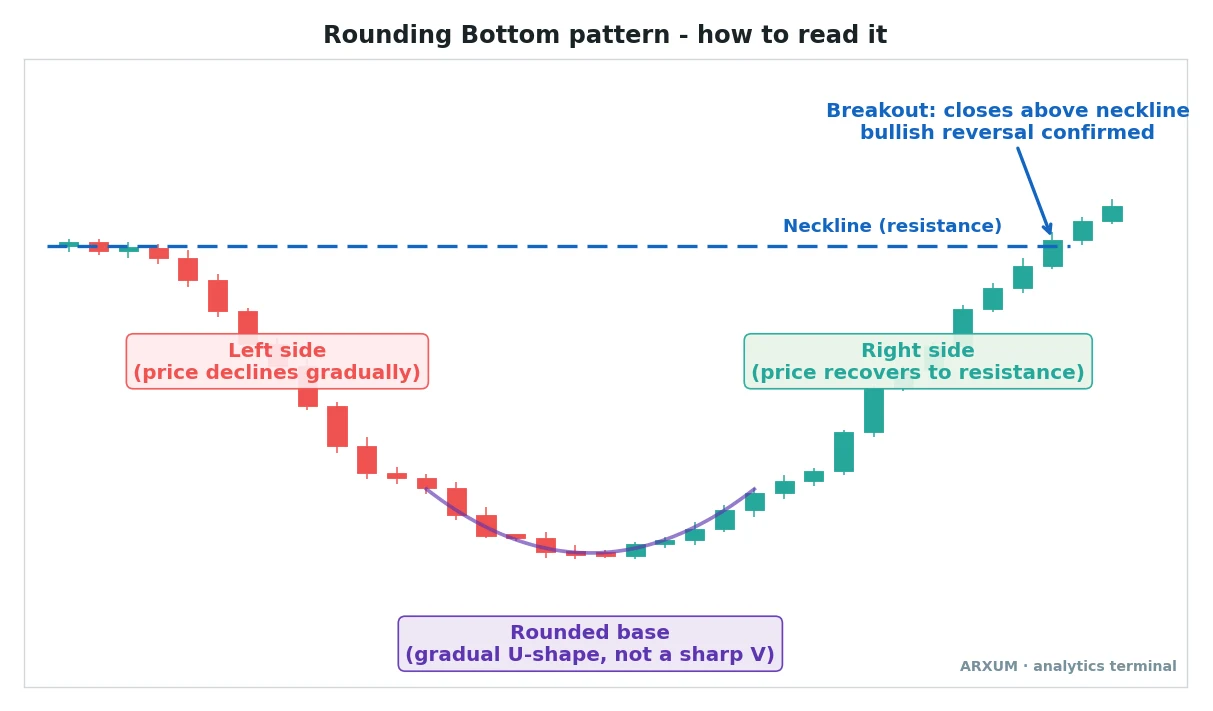
Now that the picture is on screen, the parts are easy to name. Read them left to right.
- The left side: a slow, controlled decline. Not a crash, just steady selling that keeps losing steam.
- The rounded base: the U-shaped floor where the trend goes quiet. This is accumulation, and its lowest point sets the depth of the pattern.
- The right side: a mirror of the left, price recovering just as gradually back toward where it started.
- The neckline: the flat resistance at the level the decline began. The pattern is not confirmed until a candle closes above it.
The single most important detail is the shape of that base. It has to be a gradual curve, not a sharp V.
A V-bottom is a fast panic reversal, which is a different animal. The rounded bottom is patient, and that patience is what makes it reliable when it does complete.
| Part | What it is | What to look for |
| Left side | The gradual sell-off | A slow, rounding decline, not a straight drop |
| Rounded base | The accumulation floor | A smooth U-shape, quiet range, no sharp V |
| Right side | The gradual recovery | A symmetrical climb back to the neckline |
| Neckline | The confirmation level | A close above the old resistance |
The three stages and what each one tells you to do
Spotting the bowl is only half the job. The value is knowing what each stage is telling you, because the pattern takes a long time to build and most of that time you are waiting, not trading.
This is the core of the whole method.
| Stage | How you use it | Best read |
| Left decline | Note it, do not trade it | A slow curve down, selling losing momentum |
| Rounded base | Mark the low, start watching | A quiet U-shape, sideways drift, shrinking range |
| Right recovery | Draw the neckline, get ready | A steady climb back toward the old high |
| Neckline breakout | Your trigger to buy | A decisive close above the neckline |
| Stop | Caps the loss if the breakout fails | Below the base low or the last pullback |
| Target | Where you plan to take profit | The bowl's depth projected up from the breakout |
A word on the target, because it is the part beginners skip. Measure the depth of the bowl, from the neckline straight down to the lowest point of the base.
Take that distance and project it upward from where price breaks the neckline. That projected level is your first target, and it is what gives the pattern its natural reward against risk.
The risk-reward ratio guide takes that math apart in plain terms.
Rounding bottom, cup and handle, and double bottom
The rounding bottom gets confused with two close cousins. They all mark a bottom, but they are not the same trade, and knowing the difference saves you from forcing the wrong one.
| Pattern | Shape of the base | Entry trigger |
| Rounding bottom | One smooth U, no handle | Close above the neckline |
| Cup and handle | A U, then a small dip | Break above the handle |
| Double bottom | Two sharp lows, a W | Close above the middle peak |
The link to the cup and handle is the useful one. A rounding bottom that pauses and dips just after tagging the neckline has grown a handle, and you have a cup and handle.
If it breaks straight through instead, it stayed a plain rounded bottom. Either way you are trading the same reversal.
The double bottom is the sharper, faster version of the same idea. Two clean tests of a floor instead of one long curve.
- Choose the rounding bottom read when the turn is slow and smooth, with no obvious double low.
- Switch to the cup and handle when a small dip forms right under the neckline before the break.
- Call it a double bottom when you see two distinct spikes down to the same level, not a gradual bowl.
For the reversal cousin that marks the same slow turn using a head-and-shoulders shape, see the inverse head and shoulders guide.
The one rule that decides it: does the market actually turn?
A rounding bottom is a reversal pattern. It only pays when a falling market genuinely flips to rising, and that is not something the shape alone can promise.
Get this wrong and the prettiest bowl still fails.
The tell is the market’s bigger picture. A gradual base that forms while the whole asset is grinding lower into a real bear leg often just becomes a pause before more selling.
A base that forms after a long decline in an asset with a habit of turning, like gold or oil, is far more likely to complete. The 200-period moving average, the 200-EMA, is the simplest regime check.
| What you see | What it means | What to do |
| Base forms, price reclaims the 200-EMA | The reversal is taking hold | Trade the neckline breakout |
| Base forms far below a falling 200-EMA | Still a downtrend, no turn yet | Wait for price to reclaim the line |
| Bowl on an asset with no real up-cycles | Low odds the reversal sticks | Skip, or demand the breakout plus volume |
This is why the rounded bottom reads so differently market to market. An asset that swings in real cycles gives the pattern a genuine trend to reverse into.
An asset stuck in a grinding one-way decline keeps drawing bowls that never complete.
The rounding bottom on gold: the natural home for a slow turn
Spot gold (XAU/USD) is where this pattern lives. Gold moves in long accumulation phases and then trends hard, so a rounded base on the daily often marks the real start of a leg higher.
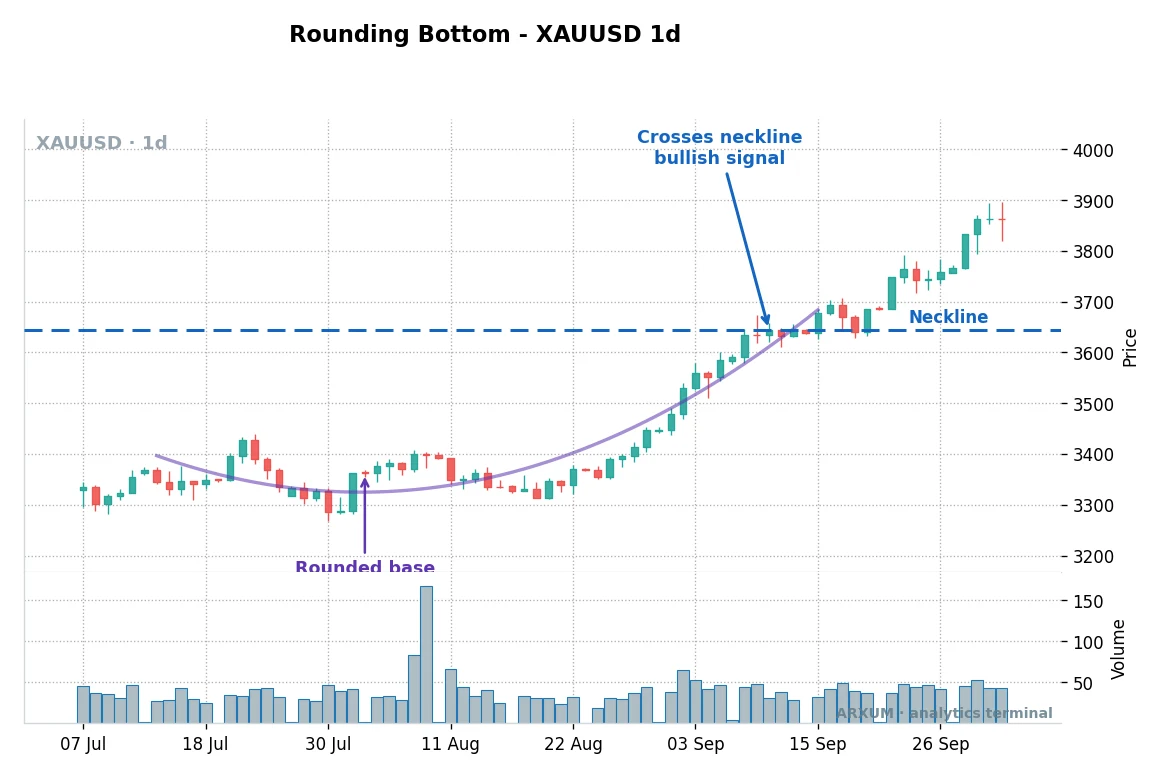
On that gold chart, the sequence is textbook. Price drifts into a shallow bowl, the purple curve traces the rounded base, and the breakout label marks the close above the neckline where the reversal confirms.
- How it looks on gold: long, patient bases that can take weeks to form on the daily, then a decisive break.
- Why it works here: gold’s up-cycles are real, so the reversal has somewhere to go once the neckline gives way.
- The volume note: gold shows tick volume, a count of price updates rather than money traded, so read the shape of the base and the neckline break, not the volume bar.
| Market | Best timeframe | What to lean on |
| Spot gold (XAU/USD) | Daily | A smooth base and a clean neckline close |
| Silver (XAG/USD) | Daily | Same shape, expect a rougher base and more fakeouts |
| Oil (WTI) | Daily, weekly | Cyclical, so real bottoms form; wait for the close above |
Gold’s own support and resistance levels matter here too. A neckline that lines up with a well-tested resistance shelf is a harder break, and clearing it means more.
The rounding bottom on Forex majors
The majors form rounded bottoms too, but they behave differently from gold. EUR/USD and GBP/USD range more than they trend, so the pattern reads best when a clear directional leg is starting, not in the middle of chop.
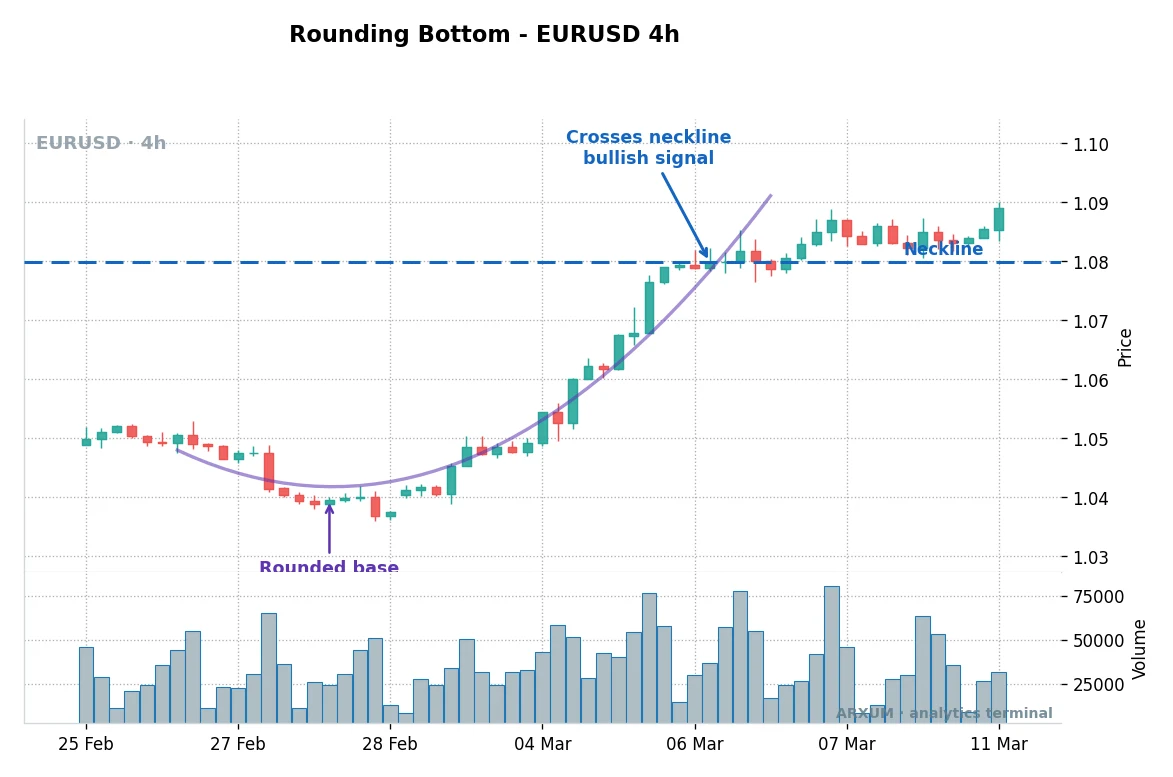
That EUR/USD chart is the same pattern on a faster timeframe. The base is tighter and forms in days rather than weeks, but the read is identical, wait for the close above the neckline.
- In a real turn: the base is orderly and the neckline break holds, just like gold on the daily.
- In a range: the same bowl shape prints constantly and fails both ways, so the wider trend has to be doing the work.
- The volume rule: like gold, Forex shows tick volume, so skip the volume filter and trade the base shape and the break.
| Pair | Best timeframe | Condition |
| EUR/USD | Daily, 4-hour | A clear base and a decisive neckline close |
| GBP/USD | Daily, 4-hour | Trends hard once it turns, so breaks run further |
| Yen crosses | Daily | Strong moves, but news-driven; mind the calendar |
There is a volume split worth naming, because it decides whether you can trust a surge on the break. On Bitcoin and crypto, exchanges report real traded volume, so a rising base-and-breakout volume profile is a genuine tell.
On gold and the majors that same bar is only tick volume, a proxy. Lean on structure there instead.
| Market | Volume shown | Trust a surge on the break? |
| Bitcoin, crypto | Real exchange volume | Yes, a surge confirms the breakout |
| Gold, silver, oil | Tick volume, a proxy | No, read the base and the neckline |
| EUR/USD, GBP/USD | Tick volume, a proxy | No, lean on the shape and the trend |
Which timeframe to watch it on
The chart you use changes this pattern more than most. A rounded bottom is a slow structure, so it rewards patience and punishes a fast chart where every wobble looks like a bowl.
| Timeframe | Character | Best use |
| Weekly, daily | Fewer, cleaner bases; each is a real trend turning | The core read on gold and Forex |
| 4-hour (H4) | Faster bases, more noise; needs a clear leg | Active swing entries in a real turn |
| 1-hour (H1) | Mostly noise; most bowls never complete | Skip, or only to time an entry the daily set up |
There is a practical tell in that. If you are spotting three rounded bottoms before lunch, you have dropped to a chart where the shape is random.
More signals is not more opportunity with this pattern. It is the warning light that you are reading noise, so step back up a timeframe.
How to trade the rounding bottom, step by step
The rules are mechanical, which makes this a good pattern for a newer trader who can be patient. Here is the whole method as a checklist.
- Confirm the setup is a real turn. After a long decline, price should be flattening and reclaiming the 200-EMA. No turn, no trade.
- Mark the base. Watch for a smooth U-shape, not a sharp V. Note the lowest point, because that depth sets your target.
- Draw the neckline. Run a flat line across the resistance where the decline began. That is your trigger level.
- Buy the breakout. Enter on the candle that closes above the neckline. On crypto a volume surge adds conviction; on gold and Forex, do not wait for one.
- Place the stop and target. Stop below the base low or the last higher-low pullback. Target the bowl’s depth projected up from the neckline. You can take part off at the halfway mark and trail the rest, moving your stop up behind price to lock in gains.
On order placement, you do not have to sit and watch for the close. Most platforms let you leave a buy-stop order, an instruction that automatically buys the moment price trades above a level you set, just over the neckline.
In the same ticket you fill the stop-loss field below the base and the take-profit field at your measured target, so the whole trade goes in at once. The neckline break is a form of breakout trading, and a patient one, since the base gives you days of warning.
Sizing, in plain numbers. Risk a small fixed slice of the account, usually 1 to 2%, per trade, and let the distance from your entry to the stop decide the position size, never the other way around.
Say you risk $20 and your stop sits $100 below your entry: you take a size where each $1 move is worth 20 cents, so a $100 move against you hits the stop for your $20 and nothing more. A tighter base means a closer stop, which lets you trade a bigger size for the same fixed risk.
One discipline rule sits on top of the math. A reversal pattern will hand you false breaks when a base fails, so expect some losers.
Two or three in a row mean nothing. A run of five or six failed necklines in a row usually means you are calling bottoms in a market that is still falling, so stand down and let a real turn prove itself first.
Where the rounding bottom fails
The losers teach this pattern as well as the winners. Almost every failed setup comes from one of these.
- A V-bottom in disguise. A sharp spike down and straight back up is not a rounding bottom. It is a different, faster reversal, and the slow measured-move logic does not apply.
- No real turn underneath. A tidy bowl in the middle of an ongoing downtrend is a pause, not a reversal. The regime check exists to catch this.
- Front-running the neckline. Buying inside the base before the break feels clever and gets you chopped up. The close above the neckline is the trigger for a reason.
- A base that is too short. On a fast chart a handful of candles is not accumulation. The pattern needs time to be real, so favour the daily.
- Trusting tick volume. On gold and Forex a volume spike on the break is a proxy, not proof. Do not build the trade on it.
Decision table: what to do, at a glance
| Situation | Do this |
| Smooth base, price reclaims the 200-EMA, closes above the neckline | Buy the breakout |
| Crypto, breakout on a real volume surge | Take it; the volume adds conviction |
| Gold or Forex, waiting for a volume spike | Do not wait; trade the structure |
| Sharp V-shape instead of a smooth bowl | Skip; that is a different pattern |
| Bowl inside an ongoing downtrend | Wait for price to reclaim the 200-EMA |
| Many bowls per session on the 1-hour | Step up a timeframe; that is noise |
| Five or six failed necklines in a row | Stop; you are calling bottoms too early |
What works: the short version
If you remember three things about the rounded bottom, make it these.
- Shape first. A smooth U-shaped base, not a sharp V, after a long decline. If it is not a gradual bowl, it is not this pattern.
- Wait for the neckline close. The base is the setup; the close above the neckline is the trigger. Buy that, stop below the base, target the bowl’s depth projected up.
- Demand a real turn. Reversals need a market that actually reverses. Favour assets with genuine up-cycles like gold, and let the 200-EMA confirm the regime.
The rounding bottom is the patient bottom, the same base that sits under a cup and handle. For the faster, sharper way a market marks the same floor, see the double top and double bottom guide, and for the wider menu of setups, the bullish chart patterns roundup.
Glossary
- Rounded base: the smooth U-shaped floor of the pattern, where selling exhausts and buyers slowly take over.
- Neckline: the flat resistance at the level the decline began; a close above it confirms the reversal.
- Reversal pattern: a shape that turns a trend from down to up, unlike a continuation pattern that resumes it.
- Measured move: projecting the depth of the base up from the neckline to set the target.
- 200-EMA: the 200-period exponential moving average, a trend filter; reclaiming it points to a real turn.
- Tick volume: a count of price updates, shown by gold and Forex platforms in place of real traded volume.
- Accumulation: the quiet phase in the base where buyers absorb supply before the move up.
FAQ
What is the rounding bottom pattern in trading?
The rounding bottom is a bullish reversal chart pattern. Price declines gradually, flattens into a smooth U-shaped base rather than a sharp V, then curves back up until it closes above the neckline, the flat resistance where the decline began. You buy the close above the neckline, place the stop below the base, and target the depth of the bowl projected up from the breakout.
Is a rounding bottom bullish or bearish?
It is bullish. The pattern marks the slow end of a decline and the start of a recovery, so it is a reversal from down to up. The base is accumulation, the quiet phase where buyers absorb selling, and the breakout above the neckline confirms the turn. Its mirror image, the rounding top, is the bearish version.
What is the difference between a rounding bottom and a cup and handle?
They share the same U-shaped base. A rounding bottom breaks straight up through the neckline. A cup and handle adds a small dip, the handle, just after price reaches the neckline, and you enter on the break above that handle instead. If a rounded bottom pauses and dips right under the neckline before breaking, it has effectively become a cup and handle.
How do you trade a rounding bottom, step by step?
Wait for a smooth U-shaped base to form after a long decline, then draw a flat neckline across the resistance where the drop began. Enter on the candle that closes above the neckline, place the stop below the base low, and set the target by projecting the depth of the bowl up from the breakout. On gold and Forex, trade the structure rather than waiting for a volume spike, because those markets only show tick volume.
How do you set the target on a rounding bottom?
Measure the depth of the bowl, from the neckline straight down to the lowest point of the base. Project that same distance upward from the point where price breaks above the neckline. That projected level is your first target. Because the stop sits just below the base while the target is the full depth of the pattern, it naturally offers a favourable reward against risk.
What timeframe is best for the rounding bottom?
The weekly and daily are the core reads, because the pattern is a slow accumulation structure and each base reflects a real trend turning. The 4-hour also works for active swing traders when a clear leg is starting. The 1-hour is mostly noise, where most bowls never complete, so use it only to fine-tune an entry a higher timeframe already set up.
Does the rounding bottom pattern actually work?
It works, but only where a market genuinely turns from falling to rising. That is the whole condition. A tidy bowl in the middle of an ongoing downtrend is usually just a pause. On assets with real up-cycles, like gold, a rounded base that forms after a long decline and reclaims the 200-EMA is far more likely to complete. The shape is real; the market decides whether it pays.
Why did my rounding bottom trade fail?
The most common reasons are a base that was really a sharp V, no genuine reversal underneath, or entering before the neckline break. A V-shaped spike is a different, faster pattern. A bowl inside a downtrend has no turn to confirm. And buying inside the base before the close above the neckline means trading without the trigger. Confirm the smooth shape, check the regime with the 200-EMA, and wait for the neckline close.
Real-time trade setups with entry, stop loss and take profit. Daily market analysis. No subscription, no complicated theory.
🌍 Our recommended brokers


Reader Reviews
Be the first to review this — tell other traders what actually helped, or where it fell short.
Leave a Review

Forex Analyst & Senior Trader
Former FX desk trader with 8 years in institutional forex. Works in multi-timeframe analysis and order flow, turning desk experience into systematic, testable rules across forex and metals.
