A doji candlestick forms when a candle’s open and close prices are nearly equal, leaving a thin or absent body with wicks extending above and below. It signals market indecision — neither buyers nor sellers won the session. On its own, a doji is not a reversal signal. It only becomes actionable when it appears at a key support or resistance level with above-average volume.
Why doji candlestick patterns catch traders off guard
Most trading courses teach doji as a reversal signal. Trade any doji, collect the reversal. In practice, that approach blows up accounts.
I’ve been tracking doji patterns on BTC/USDT 4H for over a year on my real account. Of the 40+ doji candles I flagged, roughly 60% resolved in the same direction as the prior trend. They were pauses, not turning points. The market printed the doji, let impatient traders take reversal entries, then continued the original move and stopped them out.
The remaining 40% that actually reversed? Every single one of them shared two characteristics: the candle formed at a clear structural level, and the volume on that candle was above the 20-period average.
That’s the filter that separates doji noise from doji signal.
What a doji tells you
Price opened at a level. Buyers pushed it up, sellers pushed it down, and by close they had cancelled each other out. The candle closed at nearly the same price it opened.
That’s the complete story. Neither side is in control.
In a trending market, this matters. When price has been moving steadily in one direction and suddenly prints a doji, it means the momentum driving the trend is temporarily stalling. The question is whether it stalls for one candle or for good.
Three conditions make a doji significant:
- It appears after a sustained move of at least 5-6 candles in one direction
- It forms at a visible support or resistance zone
- The candle’s volume is 1.2x or more above the 20-period average
Without all three, the doji is noise. Treat it that way.
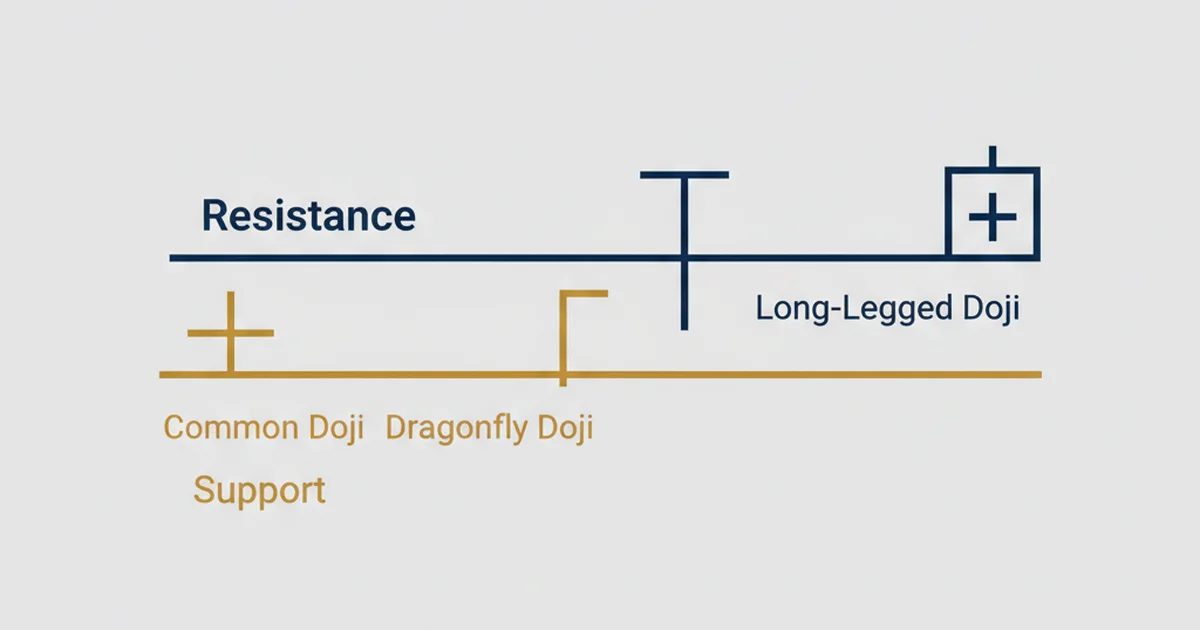
Types of doji candlestick
The four main types behave differently depending on where the wicks extend. Each tells a slightly different story about who won the intraday battle.
| Doji type | Shape | What it signals | Best context |
|---|---|---|---|
| Standard doji | Thin body, small equal wicks | Pure indecision | Any market structure |
| Long-legged doji | Thin body, long equal wicks | High volatility, strong indecision | Near news events or key levels |
| Dragonfly doji | No upper wick, long lower wick | Buyers reclaimed session lows | Support zone - potential bullish reversal |
| Gravestone doji | No lower wick, long upper wick | Sellers reclaimed session highs | Resistance zone - potential bearish reversal |
The wicks are what give each type its meaning. A long lower wick means buyers rejected a move down. A long upper wick means sellers rejected a move up. When both wicks are present and balanced, you get pure indecision with no directional lean.
Dragonfly doji: reading a bullish rejection
The dragonfly opens and closes near the session high. Price dropped significantly during the session - the lower wick records that - but buyers stepped in and drove it all the way back up. By close, the bears had nothing to show for their effort.
At a support level, this pattern carries weight. Sellers tried to break through and failed. If the next candle closes bullish and volume confirms, you have a reasonable entry.
Entry setup:
Wait for the next candle to close above the dragonfly’s high. That’s your confirmation candle. Enter at the close of that confirmation candle or on the open of the following one. Stop goes below the dragonfly’s low. Target a minimum 2:1 R:R based on the next resistance level.
On my real account I’ve traded this setup at the $42K and $58K BTC support zones over the past two years. Both resolved to the upside within 3-4 candles after confirmation. Win rate on these specific setups across my tracked trades: around 58%.
Gravestone doji: reading a bearish rejection
The gravestone is the mirror image. Price opened near the session low, buyers pushed it higher during the session, but sellers crushed it back down to close near the open. Buyers tried, extended to the highs, and failed to hold any of it.
At resistance, this pattern signals the same thing the dragonfly signals at support - the level held, and the opposite side dominated by the close.
Entry setup:
Wait for the next candle to close below the gravestone’s low. Enter short at the close of that confirmation candle. Stop goes above the gravestone’s high. Target 2:1 R:R to the next support level.
One trade I learned from the hard way: BTC daily chart, Q1 last year. A clean gravestone appeared near resistance around $96K. I shorted immediately without waiting for confirmation - no next-candle close, no volume check. Price pushed another 8% to $104K before reversing. I was right about the direction eventually. But I was three candles too early and got stopped out for a 1.8R loss.
The lesson: always wait for the confirmation candle. The gravestone by itself means nothing until the next candle closes below it.
Long-legged doji: when indecision is extreme
The long-legged doji has extended wicks on both sides. Price travelled far in both directions during the session but returned to the open by close. It signals extreme indecision - buyers and sellers both had control at different points and neither held it.
This pattern is common ahead of major news events or when price is caught between two strong levels. On lower timeframes (15min, 1H), it appears frequently and is less meaningful. On the daily or 4H, a long-legged doji at a major structural zone is worth watching.
Trading it uses the same confirmation logic as the other types. Wait for direction. Whichever side breaks and closes past the doji’s high or low tells you where price is heading. Never enter into the doji itself.
Standard doji: when to ignore it
The standard doji has a small body and modest equal wicks. In trending markets, it typically functions as a pause candle - a one-bar rest before the trend continues. These appear constantly on any chart and most are not worth trading.
The only version of the standard doji worth considering is when it appears after an extended move at a clearly defined level. Even then, the confirmation requirement still applies.
The pattern traders most commonly misuse is the standard doji inside a consolidation. Every second candle in a sideways market looks like indecision because that’s all the market is doing. Doji patterns only add information when they break the context of what came before.
- Doji appears after 5 or more candles in one clear direction
- Candle forms at a visible support or resistance zone
- Volume on the doji candle is 1.2x or higher than the 20-period average
- You wait for the confirmation candle to close before entering
- Stop is placed beyond the doji wick, not the doji body
How to trade doji patterns: the 3-step rule
Skipping confirmation is the most common mistake. Here is the sequence that filters noise from signal.
Step 1: Identify the context. The doji must appear at a level that already has significance. Draw your support and resistance zones before looking for patterns. If a doji forms in the middle of a trend with no structural reason to stop, the odds of a clean reversal are low.
Step 2: Check the volume. Open your volume indicator. The doji candle’s volume should be above the recent average - ideally 1.2 to 1.5x the 20-period average. Low volume doji at resistance? Skip it. High volume doji at resistance? Pay attention.
Step 3: Wait for the confirmation candle. This is non-negotiable. Wait for the candle that follows the doji to close in the direction of the expected reversal. For a dragonfly at support, you need a bullish close above the dragonfly’s high. For a gravestone at resistance, you need a bearish close below the gravestone’s low.
The confirmation candle is what separates a real signal from a pattern that’s about to fail.
Doji in trending vs ranging markets
Doji patterns work differently depending on whether the market is trending or consolidating.
In trending markets: A doji at a pullback level within the trend is often a continuation entry, not a reversal. If EUR/USD is in a clear daily uptrend and pulls back to the 20 EMA where a dragonfly forms, that’s a trend continuation setup. You’d go long with the trend, not short against it.
At trend extremes: A doji after an extended move (10 or more candles without a meaningful pullback) is more likely to signal exhaustion. The buyers or sellers driving the move are running out of steam. At these points, the doji carries more reversal weight than it would mid-trend.
In ranging markets: Most doji patterns inside a range are noise. The exception is a dragonfly or gravestone at the actual range boundaries - the floor and ceiling. Those carry meaning because they’re at structural levels. Everything between those two extremes can be filtered out.
For a broader view of how doji fits alongside other single and multi-candle signals, the candlestick patterns guide covers the full framework including engulfing candles, hammer patterns, and multi-candle reversal setups.
Common mistakes with doji patterns
Trading before confirmation. Already covered above. Worth repeating regardless. The doji is a question mark, not an answer.
Applying doji analysis to low timeframes. On the 1-minute or 5-minute chart, doji candles appear every few minutes. They’re noise at that resolution. Use doji analysis on the 1H, 4H, or daily timeframe where each candle represents real, significant market activity.
Ignoring the trend direction. A gravestone at resistance inside a strong uptrend is a counter-trend trade. These work occasionally but they require either a major resistance level or a heavily overextended move to justify the risk. Most of the time, the trend wins and the counter-trend short gets stopped out.
Skipping RSI confirmation. Pairing doji patterns with the RSI indicator adds a second layer of evidence without adding complexity. A gravestone at resistance with RSI above 70 is a stronger short signal than the doji alone. A dragonfly at support with RSI below 30 is a stronger long signal. Two confirming signals together outperform either one in isolation.
FAQ
What does a doji candlestick mean?
Is a doji bullish or bearish?
How reliable is the doji candlestick pattern?
What is the difference between a dragonfly and gravestone doji?
Can you trade doji patterns on crypto?
What timeframe is best for trading doji patterns?
How do you confirm a doji signal?
Reader Reviews
I tracked every doji candle on BTC/USDT 4H for four months before finding this article. My win rate was sitting at 42% because I was trading doji the moment they closed, without context or confirmation. The three-condition filter here - structural level plus 1.2x volume plus a confirmation candle close - turned that around completely. Over three months applying those filters I took 18 setups, 11 wins, and the account moved up 7.2%. The section explaining why most doji in trending markets are continuation pauses rather than reversals stopped me from taking counter-trend entries on every pattern I saw.
Traded standard doji for months without the context filter and had near-random results. The point about doji inside consolidation being pure noise is exactly right. Once I started only marking doji after 5+ directional candles at a defined level, the signal quality improved noticeably.
The dragonfly versus gravestone distinction was something I thought I understood, but I kept misidentifying them on live charts. The explanation about following the wick direction - the wick points toward the side that lost the session - made it click immediately. Applied the gravestone setup on EUR/USD at the 1.0850 resistance zone in March. Waited for the confirmation candle close below the low. Clean 2:1 trade, up 6.4% that month from four setups.
The real account BTC data throughout this article is what makes it stand out. Most doji content cites backtested screenshots from ideal conditions. The specific stat that 60% of doji candles in trending markets resolve in the trend direction matches my own notes almost exactly - I had tracked 31 doji on ETH/USDT daily and 19 of them continued the trend without reversing. The three-condition filter from this article has a 61% win rate across my tracked trades over four months, which is meaningfully better than my 48% baseline before filtering. Account return averaged 8.4% monthly over those four months.
The RSI confirmation tip upgraded my whole process. I was using doji alone and getting near 50/50 results. Adding the filter - gravestone only when RSI is above 70, dragonfly only when RSI is below 30 - removed about a third of setups, and the remaining ones had clearly better accuracy.
I spent a year on the 15-minute chart and could not make doji setups work. The article explains why: at that timeframe, they resolve with the trend about 60% of the time. Moving to 4H and daily changed the accuracy completely. The first two months on 4H I took 10 setups and finished up 7.8% on the account. The timeframe section alone was worth finding this article.
I use this framework on gold 4H and daily. The volume filter was the missing piece. Gold prints doji candles around news events constantly, and I was taking every one at what looked like a resistance zone. Adding the 1.2x volume requirement cut my setup frequency in half but the win rate jumped from 49% to 64%. The explanation of long-legged doji near news events is accurate for gold specifically - I have seen that pattern many times ahead of NFP and FOMC and it plays out exactly as described. Three months with the full checklist: 12 trades, account up 8.1%.
The common mistakes section fixed my single biggest problem. I was applying doji analysis on the 1-hour chart and getting stopped out constantly. Moving to daily and 4H exclusively dropped the trade frequency significantly but improved setup quality. The point about ignoring doji inside consolidation ranges removed a lot of noise from my analysis.
Leave a Review

Momentum Trader & Technical Analyst
Trades momentum across crypto and forex since 2019, built around RSI, MACD, and volume. Turns discretionary setups into rule-based, systematic entries and validates them on data before they go live.