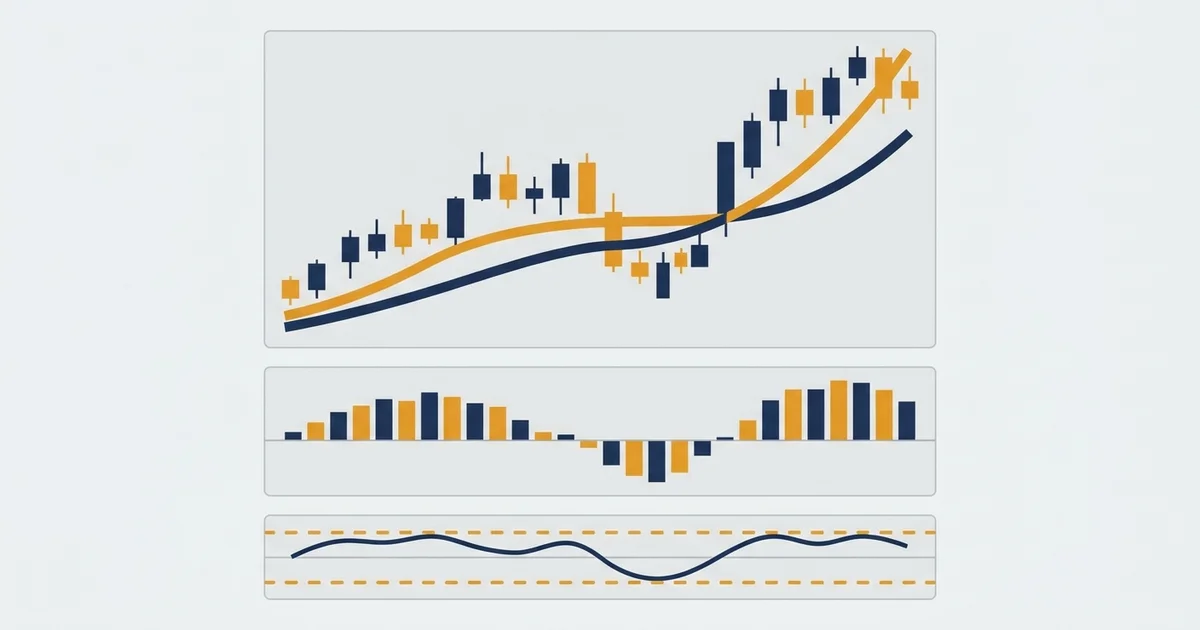

What indices trading actually is
A stock index is just a basket of shares bundled into one number. Index trading lets you trade that number up or down without buying a single share underneath it.
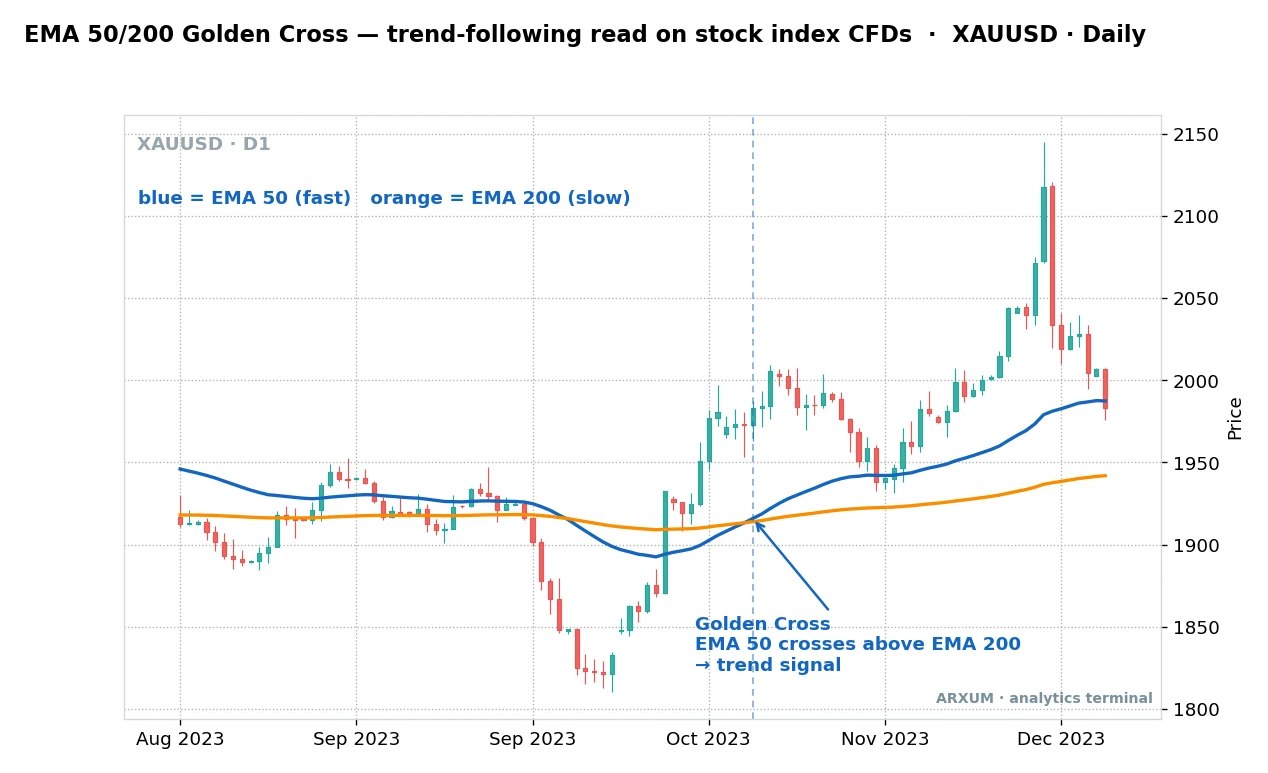
That chart is the first thing to learn, because the trend is the read an index rewards most. Two lines tell the whole story.
- EMA 50 (blue), the fast line. A moving average of the last 50 bars. It hugs price closely and turns quickly.
- EMA 200 (orange), the slow line. A moving average of the last 200 bars. It moves slowly and marks the longer trend.
- The golden cross. When the fast line climbs above the slow line, the shorter trend has overtaken the longer one. That is a buy-side trend signal.
- The death cross. The mirror image, fast line dropping below slow, flags a sell-side trend.
An index spends long stretches in one direction, so this single read keeps you on the right side more often than it does on a choppy Forex pair.
The main index CFDs to trade
Before the methods, know your instruments. The broker ticker is in brackets, and each index has its own character.
| Index CFD | Tracks | Home session (UTC) | Character |
|---|---|---|---|
| US500 (S&P 500) | 500 large US firms | 13:30 to 20:00 | Broad, steady, the benchmark |
| US100 (Nasdaq 100) | 100 US tech names | 13:30 to 20:00 | Fast, volatile, tech-led |
| US30 (Dow) | 30 US blue chips | 13:30 to 20:00 | Fewer names, big point swings |
| DE40 (DAX) | 40 German firms | 07:00 to 15:30 | Sharp European open moves |
| UK100 (FTSE 100) | 100 UK firms | 07:00 to 15:30 | Commodity and bank heavy |
| JP225 (Nikkei) | 225 Japanese firms | 00:00 to 06:00 | Asian session, yen sensitive |
A few plain notes on picking one:
- Start with US500. It is the cleanest trender and the most forgiving for a beginner learning indices trading.
- US100 pays and punishes. Its tech weighting makes moves bigger, so treat it as the fast option, not the first one.
- DE40 suits European hours. If you trade the London morning, the DAX is awake when the US indices are still asleep.
- Match the index to your clock. The best index to trade is the one whose cash session lands in your own trading hours, covered in the sessions table further down.
Three ways to trade index CFDs
You do not need a shelf of indicators. Three reads cover the way an index actually behaves: when it trends, when it accelerates, and when it stretches too far and snaps back.
Here is each one, the exact signal, and where it earns its keep.
1. Trend-following with the EMA 50 and 200
This is the backbone of any trading indices strategy. You are not calling tops or bottoms, just joining a move already underway and staying with it.
The signal is the golden cross at the top of this guide: the fast EMA 50 crossing above the slow EMA 200 turns the bias long, and the death cross turns it short.
How it looks:
- Fast line above slow line, both sloping up, means a healthy uptrend. Buy the dips, ignore shorts.
- Fast line below slow line, both sloping down, means a downtrend. Sell the bounces, ignore longs.
- The two lines tangled and flat means no trend. This read stands down and you wait.
- The cross itself is a late but reliable trigger, best on the daily and 4-hour charts.
The catch, stated plainly: the golden cross lags. By the time it prints, part of the move is gone, so it is a trend-joining tool, not an early-entry tool.
Pair it with the ADX indicator to confirm the trend is strong enough to bother with. ADX above 25 means the trend has real force behind it.
Application table: the trend read
| Role | How you use it | Best TF and index |
|---|---|---|
| Direction call | Trade only with the fast-over-slow bias | D1 on US500, H4 on DE40 |
| Regime filter | Golden cross on, trade trend setups only | D1 on US100 and US30 |
| Trend entry | Buy the first pullback after the cross | H4 on US500, UK100 |
| Exit cue | Trim or exit when the fast line rolls back under | D1 and H4, any index |
2. Momentum with the MACD zero-cross
Where the golden cross tells you the trend exists, momentum tells you the trend is accelerating. The MACD is the standard gauge for it.
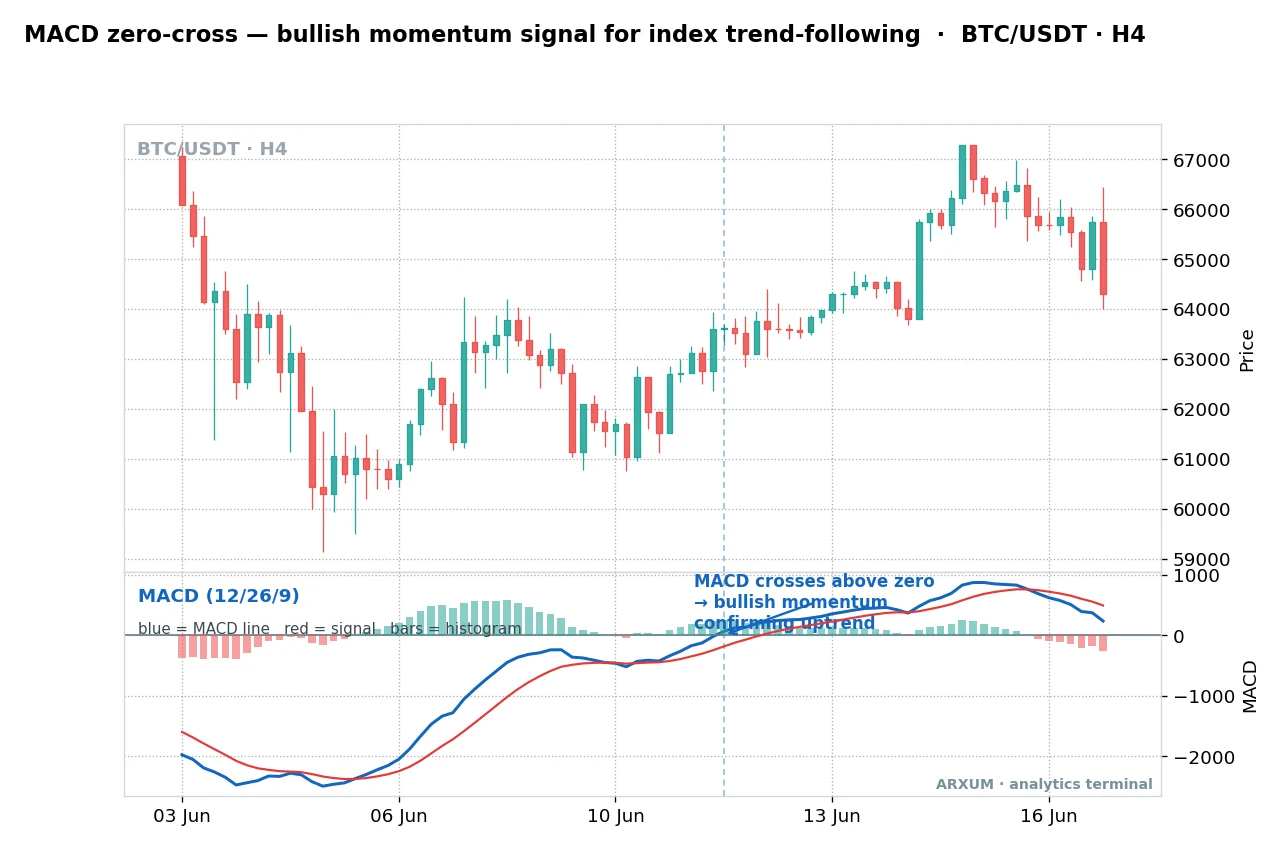
Read that lower panel, and the full guide to the tool sits in the MACD indicator guide. Three parts do the work.
- MACD line (blue). The difference between a fast and a slow moving average. It rises when momentum builds.
- Signal line (red). A smoothed version of the MACD line, used as a trigger.
- Histogram (bars). The gap between the two lines, drawn as bars. Growing bars mean momentum is speeding up.
- The zero line. The pivot. Above zero the fast average sits above the slow one, so momentum is net positive.
The signal on the chart is the MACD line crossing up through zero. On an index that confirms a trend has genuine thrust, not just a drift.
How it looks:
- MACD crossing above zero while price makes higher highs is the cleanest long confirmation.
- MACD crossing below zero as price makes lower lows confirms a sell.
- Histogram bars shrinking toward zero warn that the move is tiring, even before price turns.
- A cross that happens while price chops sideways is noise, so wait for price to agree.
The catch: the MACD confirms, it does not lead. Use it to filter trend entries, not to fire the first shot on its own.
Application table: the momentum read
| Role | How you use it | Best TF and index |
|---|---|---|
| Trend confirmation | Take longs only when MACD is above zero | H4 on US100, US500 |
| Entry trigger | Enter on the zero-line cross in the trend’s direction | H4 and H1 on US30, DE40 |
| Momentum fade | Watch a shrinking histogram to tighten stops | H1 on US100 intraday |
| Filter | Skip counter-trend setups while MACD disagrees | Any index, any TF |
3. Mean-reversion with the RSI oversold read
Indices do not only trend. Inside a range, or after a sharp drop into support, they stretch too far and snap back, and the RSI catches that stretch.
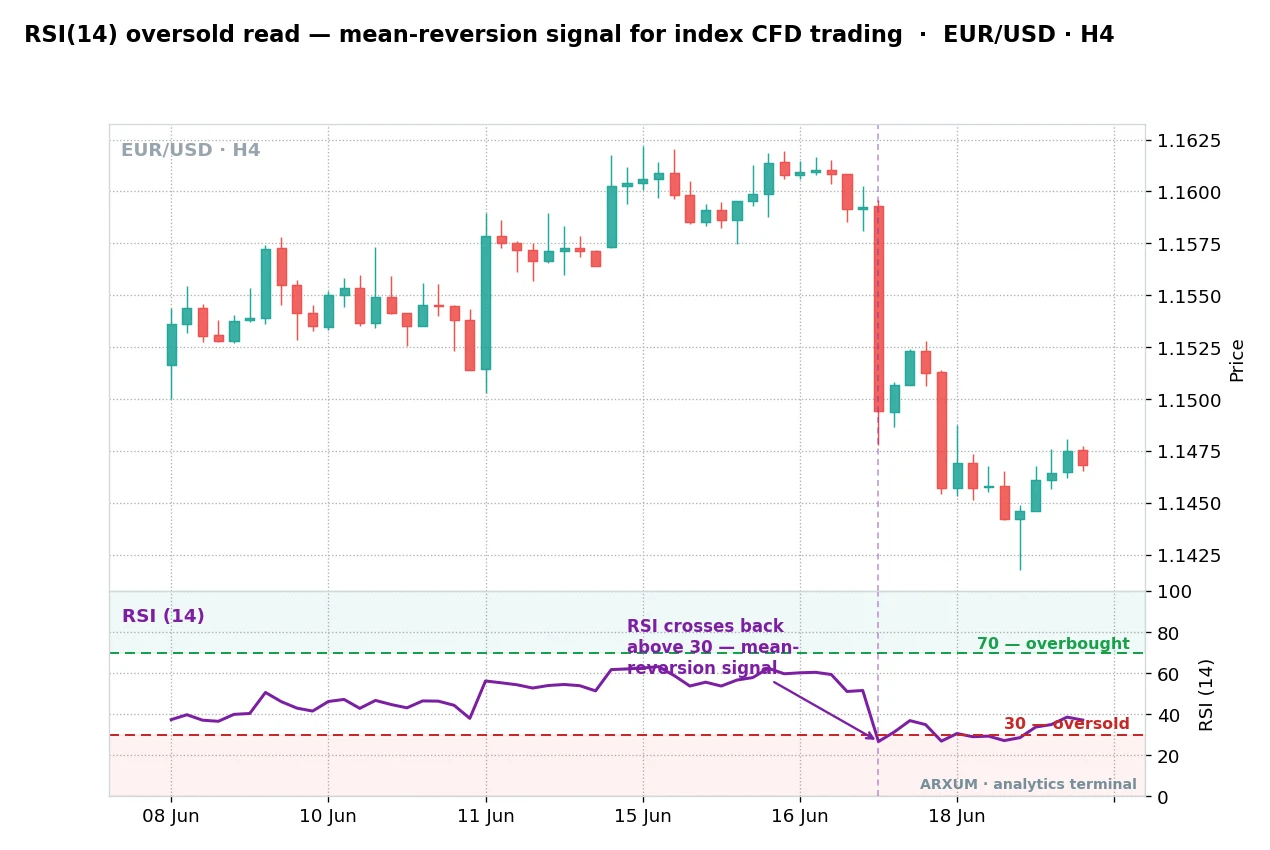
The RSI is a momentum oscillator that swings between 0 and 100, and the full breakdown is in the RSI indicator guide. Two levels matter.
- 30, the oversold line. RSI below 30 means price has fallen fast and may be stretched to the downside.
- 70, the overbought line. RSI above 70 means price has risen fast and may be stretched to the upside.
- The trigger. Not the dip below 30 itself, but RSI crossing back above 30. That is the moment the bounce actually starts.
- The RSI(14). The 14 is the lookback, the standard setting, counting the last 14 bars of gains against losses.
On an index, this read works best when the market is ranging or pulling back within a larger uptrend, never against a hard trend.
How it looks:
- RSI drops below 30, then crosses back above it: a long signal in a range or an uptrend pullback.
- RSI pushes above 70, then crosses back below it: a short signal, best used to fade a spike, not a strong trend.
- The deeper the dip and the sharper the recross, the cleaner the bounce tends to be.
- A market pinned under 30 for a long stretch is trending down hard, and mean-reversion loses money there.
The catch, and it is the big one: oversold can stay oversold. In a real downtrend the RSI can sit below 30 for days while price keeps falling, so only fade the extreme when the bigger picture is a range or an uptrend.
Application table: the mean-reversion read
| Role | How you use it | Best TF and index |
|---|---|---|
| Range entry | Buy the recross above 30 inside a sideways range | H4 on UK100, US30 |
| Pullback entry | Fade an oversold dip within a golden-cross uptrend | H4 and D1 on US500 |
| Overbought fade | Short the recross below 70 on a stretched spike | H1 and H4, range only |
| Avoid | Never fade RSI against a strong trending index | Any index in a hard trend |
Which read fits which index condition
The three reads are not rivals, you pick by what the market is doing. This table is the whole guide in one place.
| Read | What it answers | Use it when | Weakness |
|---|---|---|---|
| Trend (EMA 50/200) | Which way is the index going | The index is trending cleanly | Lags, late entries |
| Momentum (MACD) | Is the trend accelerating | Confirming a trend has thrust | Confirms, does not lead |
| Mean-reversion (RSI) | Is the move overstretched | The index is ranging or pulling back | Fails against a hard trend |
A few rules of thumb that fall straight out of that table:
- Read the regime first, pick the tool second. Trending index, use the trend and momentum reads. Range-bound index, use RSI mean-reversion.
- Trend and momentum are partners. The golden cross says a trend exists, the MACD zero-cross says it has force. Together they are stronger than either alone.
- Mean-reversion is the odd one out. It works in the exact conditions the other two hate, a flat or pulling-back market, so never run it against a strong trend.
- Slower timeframes read cleaner. All three are sharpest on H4 and D1. Drop to the 15-minute and every one of them whipsaws.
Sessions: when each index actually moves
Indices, unlike Forex or crypto, keep office hours. Trade them when their home market is open and skip the dead zones, the desk read beginners miss most.
| Index | Cash session (UTC) | Best window to trade | Quiet zone to skip |
|---|---|---|---|
| US500, US100, US30 | 13:30 to 20:00 | First 90 min after 13:30 | Overnight and pre-open |
| DE40, UK100 | 07:00 to 15:30 | 07:00 to 09:00 open drive | Lunchtime lull midday |
| JP225 | 00:00 to 06:00 | Tokyo morning | US afternoon |
Two honest points on sessions:
- The open is where the range is set. The first hour of a cash session carries most of the day’s move, which is where the three reads fire cleanest. The same logic drives breakout trading on the open.
- CFDs trade nearly around the clock, but the liquidity does not. Outside the cash session spreads widen and moves get thin, a point the guide to after-hours trading covers in full.
Position sizing and risk on index CFDs
The reads find the trade, and risk control keeps you in the game long enough for them to pay. None of this needs a big account.
- Risk a fixed small slice per trade. A common rule is 2% of the account on any single trade, so one loss never dents you badly.
- Size from the stop, not the other way round. Decide where the trade is wrong first, then size the position so hitting that stop costs your 2%.
- Know your point value. On an index CFD, each index point is worth a set dollar amount per contract, and it differs by index and broker. Check it before you size.
- Frame the target as reward-to-risk. A trade risking 30 points to make 60 is a 1:2, covered in the risk-reward-ratio guide. Aim for at least 1:1.5 so a modest win rate still profits.
A quick worked example, illustrative only, on a $1,000 account:
- Risk budget: 2% of $1,000 is $20 per trade.
- Stop distance: say your setup puts the stop 40 points away.
- Size: $20 risk divided by 40 points is $0.50 per point, so you pick the contract size whose point value is closest to $0.50.
- Target: at 1:2, you aim 80 points the other way for a $40 gain.
That is the entire money math. No index point value is invented here, because it varies by broker, so plug in your own and the division stays the same.
One discipline note from the desk: an index can gap over the weekend or on a data release, jumping straight past your stop. Size for that by never risking more than you can afford to lose, and trim size into major economic releases.
What works: three things to remember
If you keep only three points from this guide on how to trade indices, keep these.
- Read the regime before the entry. Trending index means the golden cross and MACD reads. Ranging index means the RSI bounce. The market picks the tool, you do not.
- Confirm, do not guess. The golden cross says a trend exists, the MACD says it has force, the RSI recross says a stretch is snapping back. Wait for the actual signal, not a hunch.
- Trade the session, size the risk. An index moves in its cash hours, so trade then. Risk a small fixed slice each time, and let reward-to-risk do the compounding.
Indices trading is one of the cleaner corners of the market for a newer trader, because a basket of stocks trends more honestly than a single share and respects its hours. Learn the three reads, match them to the indicators that suit your timeframe, and you have a full toolkit for the S&P 500, the Nasdaq and the DAX without ever touching a share certificate.
FAQ
What is indices trading, in plain terms?
Indices trading means trading a whole stock index, like the S&P 500 or the Nasdaq 100, as one instrument instead of buying the shares inside it. Most retail traders use a CFD, a contract that tracks the index price and lets you go long or short with a small deposit. You profit from the direction of the basket, not from owning any company.
How do you trade indices as a beginner?
Open an index CFD like US500, read whether it is trending or ranging, then apply the matching read. In a trend, use the EMA 50/200 golden cross and the MACD zero-cross to join the move. In a range, use the RSI dipping under 30 then crossing back above it to buy a bounce. Risk a small fixed slice of your account per trade and trade during the index's cash session.
What are the best indices to trade?
For a beginner, the US500 (S&P 500) is the cleanest and most forgiving because it trends steadily. The US100 (Nasdaq 100) moves faster thanks to its tech weighting, so it pays and punishes more. In European hours the DE40 (DAX) is the natural pick. The best index for you is the one whose cash session lands inside your own trading hours.
Is indices trading good for beginners?
It suits beginners better than many markets because a basket of stocks trends more honestly than a single share and keeps regular office hours. That makes trend reads more reliable and timing easier. The risks are real though, since CFDs use leverage and indices can gap over weekends or on data, so keep position sizes small while you learn.
What is the difference between trading an index and trading a stock?
A stock is one company, so it moves on that company's news and can swing wildly. An index is a basket of many companies, so single-name shocks get diluted and the price reflects the broader market. That averaging makes an index smoother and more trend-friendly, which is why the three reads in this guide work well on it.
What is the best strategy for trading indices?
There is no single best one, because it depends on the market condition. In a trend, follow the EMA 50/200 golden cross and confirm with the MACD crossing above zero. In a range or a pullback, fade the extreme with the RSI oversold bounce. The skill is reading the regime first, then picking the strategy that fits it.
What is the best timeframe for indices trading?
The 4-hour and daily charts give the cleanest reads for all three methods, because trends and momentum mean more on slower bars. Intraday traders use the 1-hour and the 15-minute, but signals whipsaw more there. Beginners should start on the 4-hour to learn the patterns before speeding up.
When is the best time to trade indices?
Trade an index during its home cash session. For US500, US100 and US30 that is roughly 13:30 to 20:00 UTC, and the first 90 minutes carry most of the move. For DE40 and UK100 it is 07:00 to 15:30 UTC, with the strongest drive at the open. Outside those hours spreads widen and moves get thin, so it is best skipped.
Can you trade the S&P 500 as a CFD?
Yes. Trading the S&P 500 CFD, listed by most brokers as US500 or SPX500, lets you go long or short on the index without owning the 500 shares. The CFD tracks the index price, uses leverage, and can be traded in both directions, which is why it is the most popular index CFD for retail traders.
How much money do I need to start trading indices?
Because index CFDs use leverage and you can size positions small, you can start with a modest account, and many traders begin with a few hundred dollars. The number that matters is risk per trade, not account size. Risking about 2% per trade means a $1,000 account risks around $20 at a time, which is enough to trade real setups while you learn.
Real-time trade setups with entry, stop loss and take profit. Daily market analysis. No subscription, no complicated theory.
🌍 Our recommended brokers


Reader Reviews
Be the first to review this — tell other traders what actually helped, or where it fell short.
Leave a Review

Forex Analyst & Senior Trader
Former FX desk trader with 8 years in institutional forex. Works in multi-timeframe analysis and order flow, turning desk experience into systematic, testable rules across forex and metals.
