
What the gold-silver ratio actually is
The ratio is a single division. Take the spot price of gold, divide it by the spot price of silver, and the answer is how many ounces of silver equal one ounce of gold.
Here is the whole picture on one chart before we break down the parts.
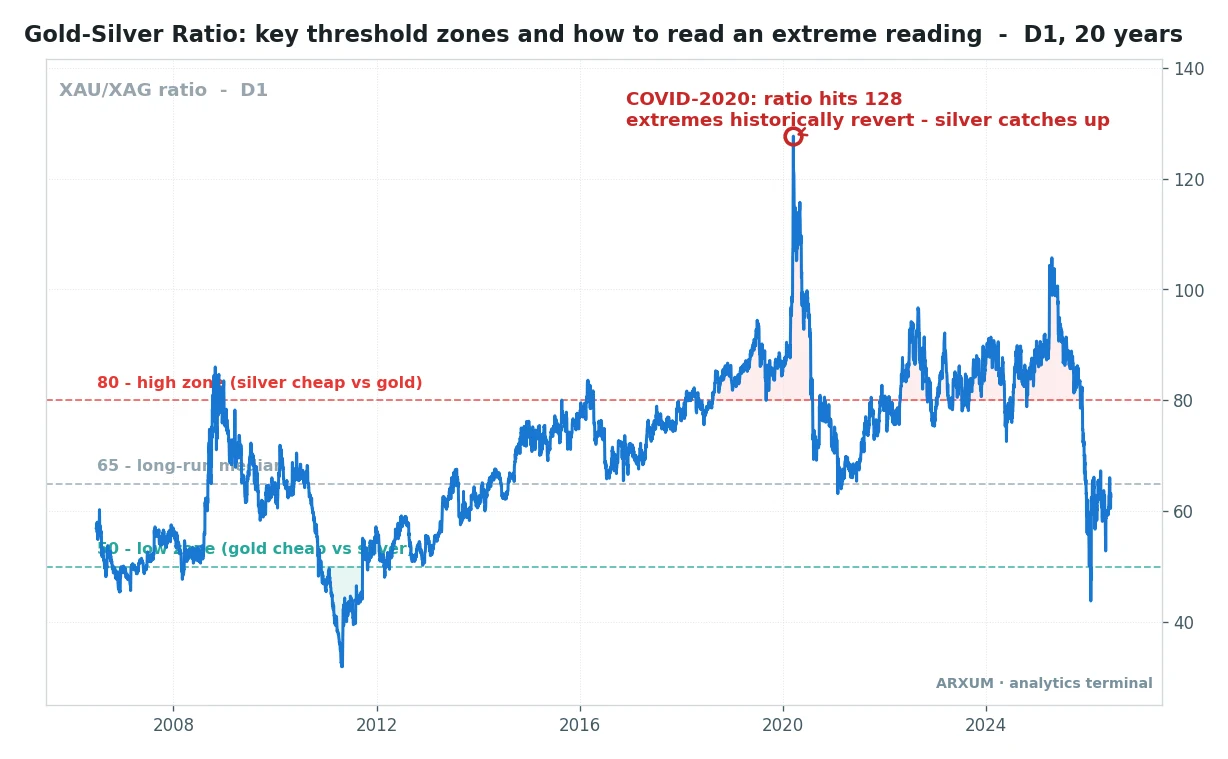
A few plain points fall out of that chart.
- A high number means silver is cheap. It takes a lot of ounces of silver to buy one ounce of gold, so silver is lagging.
- A low number means gold is cheap. Fewer ounces of silver buy the gold, so silver has run ahead.
- The middle is home. The ratio spends most of its time drifting between the bands and tends to gravitate back there after a spike.
- It is a relative read, not a price. The ratio can rise while both metals fall, as long as silver falls faster.
The reason traders care is simple. Gold and silver move together most of the time, so when one gets far out of line with the other, the gap is the trade rather than the direction of the metals themselves.
Gold silver ratio history: the range and the extremes
The ratio has a long memory, and its history is the best guide to what counts as high or low. Reading the ratio without that context is how people call 80 “extreme” when it has been the normal ceiling for years.
| Era | Rough ratio | What was going on |
| Late last century | 50 to 60 | The old normal, a tighter band |
| The credit crisis | Up toward 80 | Risk-off, silver sold harder than gold |
| The last silver run | Down near 30 | Silver ripped, the ratio collapsed |
| The pandemic crash | Spike past 120 | Panic, silver dumped, then snapped back |
| Recent years | Elevated, 80 to 100 | A higher plateau, silver the laggard |
The pattern worth taking from that history:
- The average has drifted up. The old 50-to-60 world is gone, and the ratio has spent long stretches nearer 80 to 100. What is “high” today would have been off the chart decades ago.
- The biggest spikes come in a crisis. A panic sends money into gold first, so the ratio jumps when silver gets hit harder in a sell-off.
- The sharpest falls come from silver. When silver runs, it moves faster than gold, and the ratio can drop a long way in a hurry.
- Extremes have reverted, but slowly. Every big spike has come back toward the middle. The catch is that “eventually” has meant months, sometimes years.
That last point is the whole risk of trading the ratio, and it gets its own section below.
How to read a high or low reading
A stretched reading is a lean, not a signal by itself. The idea is that a very high ratio flags silver as the cheap metal, so silver has room to catch up, while a low ratio flags the opposite.
The practical way to turn a reading into a lean:
| Reading | What it says | The usual lean |
| High, near 80 or above | Silver is cheap vs gold | Favour silver, expect it to catch up |
| Middle, around 65 | Neither metal stands out | No edge, stand aside |
| Low, near 50 or below | Gold is cheap vs silver | Favour gold, silver has run ahead |
A few honest notes on reading it:
- Wait for a real extreme. The edge, such as it is, lives at the tails. A ratio sitting in the middle tells you nothing worth acting on.
- The high side has the better history. Buying the cheaper metal from a stretched high reading has been the more reliable lean. Chasing from a low reading is the weaker trade.
- A reading is a starting point. It tells you which metal is relatively cheap. It does not tell you the gap will close this week, and it never sets your stop for you.
This is a mean-reversion idea at heart. You are betting a stretched gap comes back to normal, so it works when the ratio is genuinely extreme and fails when there is no gap to close.
Three ways to trade the gold silver ratio
Reading the ratio is one thing. Acting on it is another, and there are three common routes depending on what you trade and how long you hold.
Physical metal rotation
The oldest version, and the one long-term metal holders use. You swap ounces of one metal for the other when the ratio hits an extreme, aiming to end up with more total ounces over a full cycle.
| Piece | How you set it | Best fit |
| Trigger | Swap at a stretched high or low reading | Patient holders, multi-year view |
| Action | High ratio, buy silver with gold; low ratio, reverse | Growing an ounce count, not cash |
| Cost | Dealer spreads and storage each swap | Few, well-spaced trades only |
| Horizon | Years, one full cycle | Stackers who do not need the cash |
Why people use it:
- It grows your total ounces without needing the ratio to hit any exact number.
- It suits someone who holds metal anyway and just wants to tilt the mix.
- The dealer spreads make it a slow game. Frequent swaps get eaten by costs.
ETF and market pairs
The trader’s version. Instead of moving metal, you go long the cheap metal and short the expensive one through funds or CFDs, so you profit from the gap closing regardless of whether both metals rise or fall.
| Piece | How you set it | Best fit |
| Setup | Long the cheap metal, short the expensive one | Active traders with margin |
| Sizing | Balance the two legs by value, not by ounces | Keeping the trade market-neutral |
| Exit | Close when the ratio returns to the middle | A defined mean-reversion target |
| Risk | The ratio stretches further before it reverts | Needs a stop on the ratio itself |
This is a pairs trade, the same market-neutral idea used on correlated stocks. The read on it:
- You are trading the spread, not the metals, so a broad sell-off in both hurts you far less.
- Balancing the two legs by dollar value is what keeps it neutral. Matching ounces does not.
- The risk is the same as any reversion trade. A stretched ratio can stretch more, so the ratio itself needs a stop.
Futures spread
The professional’s tool, and the most capital-efficient. You trade the ratio directly as a spread between gold and silver futures, which brokers often margin as one position rather than two.
| Piece | How you set it | Best fit |
| Instrument | Long one metal's future, short the other's | Experienced futures traders |
| Margin | Often netted as a spread, lower than two outrights | Capital-efficient positioning |
| Contract size | Watch the notional gap between the two metals | Traders who can balance it |
| Roll | Manage expiry on both legs | Those comfortable with futures admin |
The honest picture on the spread route:
- It is the cleanest way to trade the ratio as one thing, and the margin treatment helps.
- The contract sizes on the two metals are not equal, so balancing the legs takes care. For the mechanics of the silver leg, see the silver futures guide.
- It is a professional tool. Futures leverage cuts both ways, and a stretched ratio can drain margin before it reverts.
The ratio versus its moving average as a rotation signal
A raw reading is static. To turn the ratio into something with timing, many traders watch it against its own moving average, so a cross flags a shift in which metal is winning.
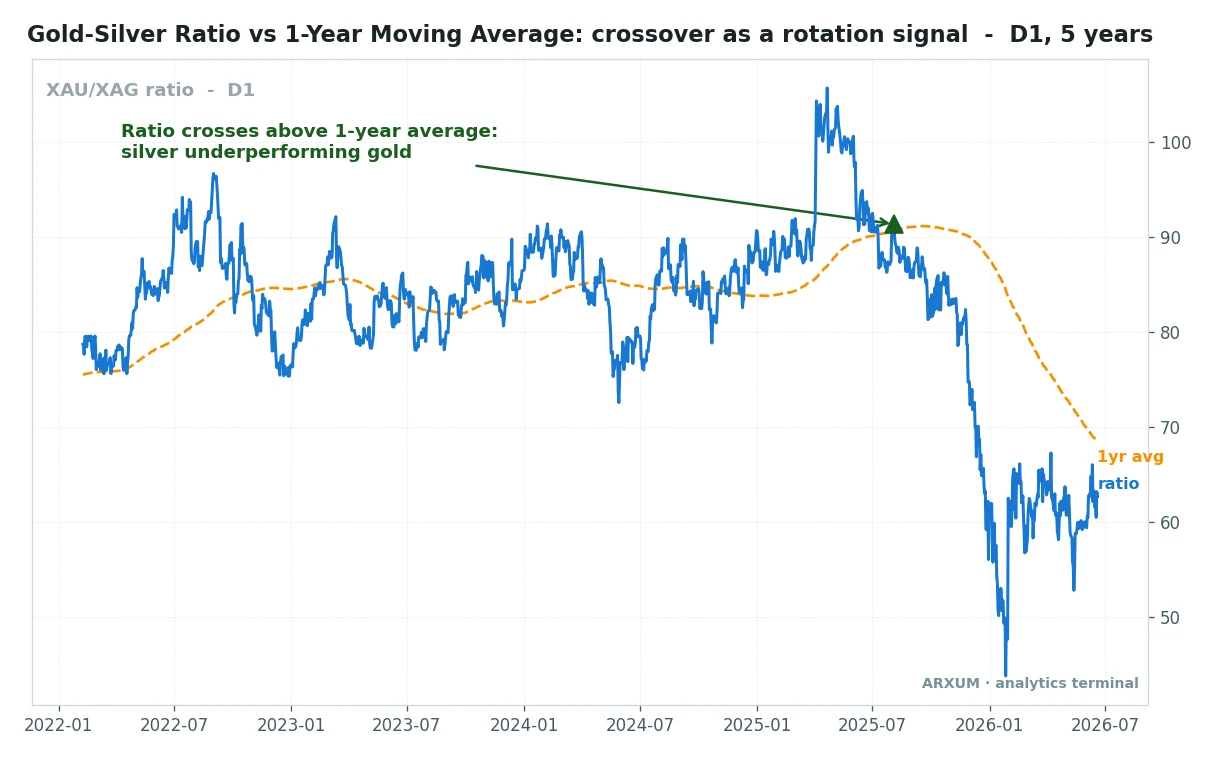
How traders use the average:
| What you see | What it means | The rotation cue |
| Ratio crosses above the average | Ratio rising, silver lagging gold | Lean toward gold, silver is weak |
| Ratio crosses below the average | Ratio falling, silver catching up | Lean toward silver, it is turning |
| Ratio hugs the average | No clear trend in the spread | No rotation signal, wait |
The read on this method:
- The average smooths the noise. A raw ratio jumps around. Comparing it to a slow line filters the day-to-day chop and shows the bigger tilt.
- A cross is a shift, not a top. It flags that the leadership between the metals is changing, not that the ratio has peaked. The turn can be early or late.
- It lags on purpose. A one-year average is slow, so it keeps you on the right side of a long swing but will never catch the exact high or low. This is the same trade-off you get with any moving average crossover.
Reading the ratio next to the gold price
The ratio does not live in a vacuum. Put it beside the gold price and the two panels tell a story that neither tells alone, which is why the ratio also gets used as a rough risk mood gauge.
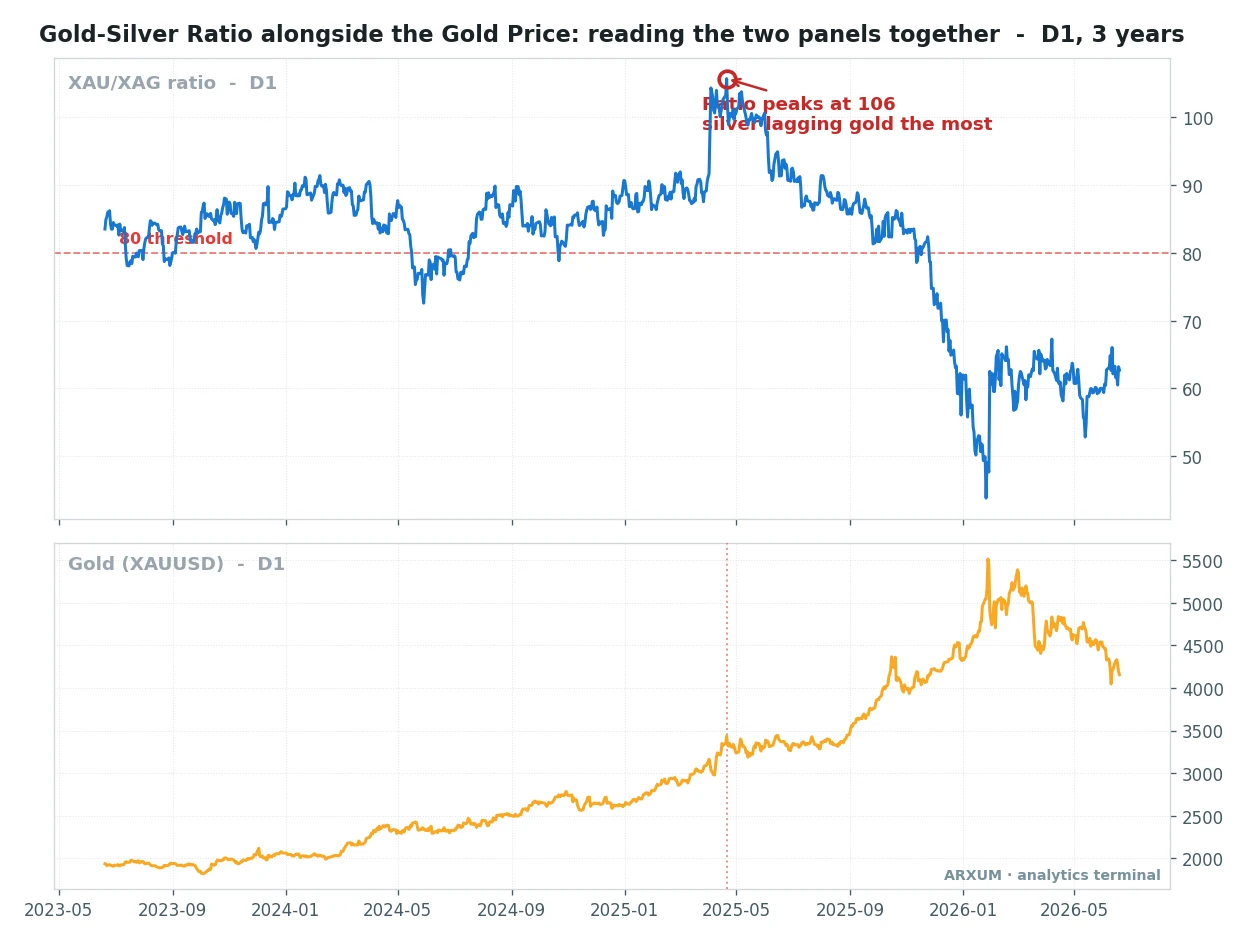
What the pairing tells you:
- A spiking ratio often lines up with fear. Money crowds into gold first in a scare, so a fast-rising ratio tends to coincide with risk-off moods. It is a rough read, not a precise recession clock.
- A rolling-over ratio can mean the risk mood is thawing. When silver starts to close the gap, it often means appetite for the more industrial metal is coming back.
- Gold’s own trend sets the backdrop. A strong one-way run in gold, like the recent one, can keep the ratio elevated for a long time simply because gold keeps outpacing silver.
If you trade the metals directly rather than the spread, the direction of gold still matters most. The gold trading guide covers that side, and the ratio is best treated as a layer of context on top of it.
The limits: when the ratio lies
The ratio is a useful lens, but it fools people who treat it as a law. The mistakes are almost always the same.
- It can stay extreme for years. There is no rule that says a high ratio must revert on your timeline. The recent elevated plateau has punished plenty of early “silver is cheap” bets.
- There is no hard reversion guarantee. The pull toward the middle is a tendency, not a spring. Some of that pull is silver rising, but some is just the average slowly drifting up to meet the ratio.
- The “normal” level shifts. Silver has a big industrial demand side that gold does not, so structural changes in that demand can reset what counts as a fair ratio. Anchoring to an old average is a trap.
- A crisis breaks the pattern. In a genuine panic, the ratio can blow past any threshold you thought was extreme, as the pandemic spike showed.
- It says nothing about size or stops. The ratio tells you which metal is relatively cheap. It never tells you how much to risk. That still comes from your own risk and position plan.
The one-line version: the ratio is a relative-value read that leans you toward the cheaper metal, and leans get run over when you treat them as certainties.
Which read to use when
A quick map from what you want to what fits.
| If you | Use |
| Hold physical metal for years | Rotate ounces at extremes |
| Trade actively with margin | The long-cheap short-expensive pair |
| Trade futures and want efficiency | The gold-silver futures spread |
| Want a timing cue, not just a level | The ratio against its moving average |
| Just want a market mood read | The ratio beside the gold price |
The takeaway
Strip it back and the gold-silver ratio comes down to three things that actually help.
- Read it against its own history. High is roughly 80 and up, low is near 50 and below, and the middle near 65 is no-man’s-land. Today’s “normal” sits higher than the old textbooks say.
- Trade the extreme, not the middle. A stretched high reading leans you toward silver, a low reading toward gold. The high side has the better track history, and the middle is not a trade.
- Respect the limits. The ratio can stay extreme for years, there is no guaranteed snap back, and it never sets your risk. Use it as context on top of a real plan, not as the plan.
Used that way, the ratio is a genuinely useful lens on two markets that move together. It quietly tells you which of the two is on sale, and that is worth knowing before you pick a side.
Glossary
- Gold-silver ratio: the price of gold divided by the price of silver, or how many ounces of silver buy one ounce of gold.
- XAU/XAG: the ticker shorthand for the ratio, gold (XAU) over silver (XAG).
- High reading: a large ratio, meaning silver is cheap relative to gold.
- Low reading: a small ratio, meaning gold is cheap relative to silver.
- Rotation: moving your exposure from one metal to the other based on the reading.
- Mean reversion: the idea that a stretched value tends to return toward its average over time.
- Pair trade: going long one asset and short a correlated one to profit from the gap between them.
- Futures spread: trading the difference between two futures, here gold and silver, as a single position.
- Risk-off: a mood where investors sell riskier assets and crowd into safe havens like gold.
FAQ
What is the gold silver ratio, in plain terms?
The gold-silver ratio is the price of gold divided by the price of silver. It tells you how many ounces of silver it takes to buy a single ounce of gold. If gold trades near 4,000 and silver near 50, the ratio is about 80, meaning it takes 80 ounces of silver to equal one ounce of gold. Traders watch it as a relative-value gauge. A high number means silver is cheap against gold, and a low number means gold is the cheaper metal. It is a lens on which of the two is relatively on sale, not a price of either one by itself.
What is a good gold silver ratio?
There is no single good number, because it depends on the era. For decades the ratio averaged somewhere near 50 to 60, so anything above 80 looked stretched. In recent years it has spent long stretches nearer 80 to 100, so the old anchors read too low. The useful way to judge it is against its own recent history rather than a fixed figure. Roughly, near 80 or above is a high reading where silver looks cheap, near 50 or below is a low reading where gold looks cheap, and the middle around 65 is no clear signal.
Is the gold silver ratio high or low right now?
For the past few years the ratio has sat on the elevated side, spending time in the 80 to 100 area rather than the old 50 to 60 range. A strong one-way run in gold has kept it high, because gold has been outpacing silver. Since the exact level moves every day, the honest answer is to check a live chart against the threshold zones. If it is near 80 or above, silver is the historically cheap side. If it has fallen back toward the middle or below, that edge has faded and silver has been catching up.
How do you trade the gold silver ratio?
There are three common routes. Physical holders rotate ounces, swapping gold for silver at a high reading and back at a low one, aiming to grow their total ounce count over a full cycle. Active traders run a pair, going long the cheaper metal and short the expensive one through funds or CFDs, so they profit from the gap closing rather than the direction of the metals. Futures traders use a gold-silver spread, which brokers often margin as one position. In every version you are betting a stretched ratio reverts toward its middle, so the ratio itself needs a stop.
What does a high gold silver ratio mean?
A high ratio means it takes a lot of ounces of silver to buy one ounce of gold, so silver is cheap relative to gold. It usually happens when silver has lagged or been sold harder than gold, which is common in a risk-off or crisis mood when money crowds into gold first. The classic lean from a stretched high reading is to favour silver, on the idea that it has room to catch up. That lean has the better history of the two, but a high ratio can stay high for a long time, so it is a starting point, not a guarantee.
Does the gold silver ratio actually work as a signal?
It works as a lean at the extremes, not as a precise timing signal. When the ratio is genuinely stretched, buying the cheaper metal has tended to pay over the following weeks and months, with the high side of the ratio having the more reliable history. In the middle of its range it tells you nothing worth trading. The big weakness is patience. The ratio can stay extreme for years with no reversion, so it belongs as a context tool layered on top of a real plan with defined risk, not as a standalone buy-and-sell trigger.
Is the gold silver ratio a recession indicator?
Loosely, yes, but it is a rough read rather than a clock. A fast-rising ratio often lines up with fear, because in a scare investors pile into gold as a safe haven while silver, which has a big industrial side, gets sold harder. That pushes the ratio up. The biggest historical spikes, like the pandemic panic, came in exactly those moments. But the ratio has also been high in calm markets, so it should be read as one input on the risk mood, not as a reliable predictor of recessions by itself.
Why is the gold silver ratio so high compared to history?
Two things. First, the long-run average has genuinely drifted higher over time, so the 50-to-60 world of the past no longer sets the norm. Second, gold has been in a strong trend and has outpaced silver, and a ratio is just one price divided by another, so gold running ahead lifts the ratio on its own. Silver also carries heavy industrial demand, which can keep it soft in certain cycles. The takeaway is not to anchor to an old average. Judge the reading against its own recent range instead.
Real-time trade setups with entry, stop loss and take profit. Daily market analysis. No subscription, no complicated theory.
🌍 Our recommended brokers


Reader Reviews
Be the first to review this — tell other traders what actually helped, or where it fell short.
Leave a Review

Forex Analyst & Senior Trader
Former FX desk trader with 8 years in institutional forex. Works in multi-timeframe analysis and order flow, turning desk experience into systematic, testable rules across forex and metals.
