
What a moving average crossover actually is
Strip away the jargon and a crossover is two lines and one event. One line tracks price fast, the other tracks it slow, and the signal is the bar where they swap places.
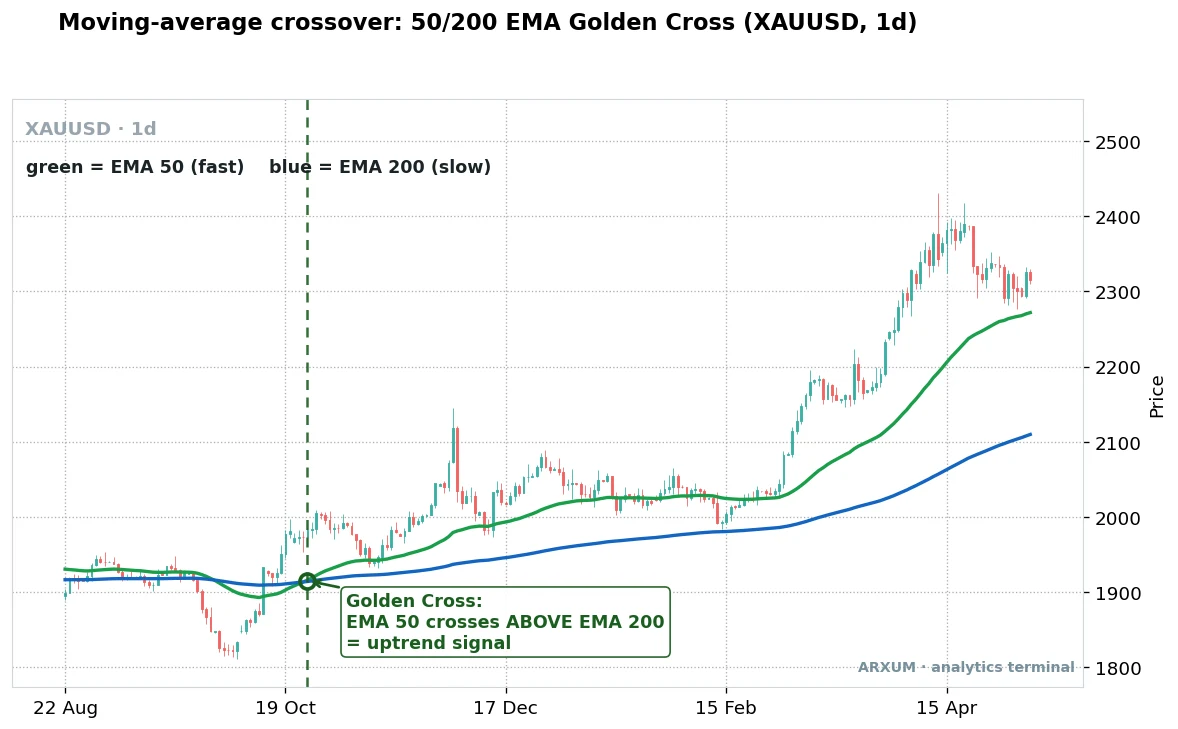
Read the gold chart from the crossover outward. The labels on it are the whole method.
- The green line is the fast average, here the 50 EMA. It hugs price and turns quickly.
- The blue line is the slow average, here the 200 EMA. It lags and shows the bigger trend.
- The vertical marker is the crossover bar, the single candle where the fast line pushes through the slow line.
- Fast above slow, as labelled, is the bullish read. Fast below slow flips it to bearish.
A crossover in one glance
| Part | What it is | Plain read |
|---|---|---|
| Fast average | Shorter lookback, hugs price | Reacts first, more noise |
| Slow average | Longer lookback, smooths price | Confirms the bigger trend |
| Bullish cross | Fast closes above slow | Momentum up, long bias |
| Bearish cross | Fast closes below slow | Momentum down, short bias |
| The gap | Distance between the two lines | Wide gap is a strong trend, tight is indecision |
The signal always lags the turn, because an average needs a run of bars before it bends. So a crossover confirms a trend rather than predicting one.
EMA or SMA inside a crossover
Every crossover needs you to pick two things, the lengths and the type of average. The type comes down to EMA against SMA.
| Type | How it behaves | Best when |
|---|---|---|
| EMA (exponential) | Weights recent bars, turns faster | You want early signals, fast markets like crypto |
| SMA (simple) | Weights all bars evenly, turns slower | You want fewer false crosses, the golden cross |
- Most short-term crossover traders use the EMA, because it reacts sooner and gets you into a move earlier.
- The classic golden cross and death cross are usually quoted on the SMA, which is steadier and cuts down on whipsaw.
- The charts in this guide use the EMA, so the lines you see turn a little faster than an SMA would.
- For the full breakdown the EMA vs SMA guide compares them, and the exponential moving average page covers how the EMA is built.
The moving average pairs traders actually use
There is no single best pair. The right lengths depend on how fast you trade and how much noise you can stomach.
| Pair | Style | Timeframe | Best for |
|---|---|---|---|
| 5/20 EMA | Scalping, fast | M5 to M15 | Quick intraday moves |
| 9/21 EMA | Short swing | H1 to H4 | Intraday to multi-day trends |
| 20/50 EMA | Swing | H4 to D1 | The all-round trend signal |
| 50/200 | Position, regime | D1 and up | The golden and death cross |
| 13/34 EMA | Swing, Fibonacci | H4 to D1 | Traders who like Fibonacci lengths |
| 4/9/18 EMA | Triple, fast | M15 to H1 | Extra confirmation from a third line |
The whole table follows one rule about size.
- The smaller the numbers, the faster the signal and the more false crosses you take.
- The larger the numbers, the slower and more reliable the signal, but you give back more of the move before you get in.
- Two lines is the standard. The triple systems add a third average as a filter, covered further down.
- The best moving average crossover is not a fixed pair. It is the one that matches your timeframe and the market you trade.
Three crossover systems worth knowing
Rather than drown in pairs, learn three: a fast one for early signals, a mid one for swing trends, and a slow one for the regime. Each is the same idea tuned to a different job.
The fast crossover: 9/21 EMA
This is the short-swing workhorse. It is quick enough to catch an intraday move and slow enough to filter the smallest wiggles.
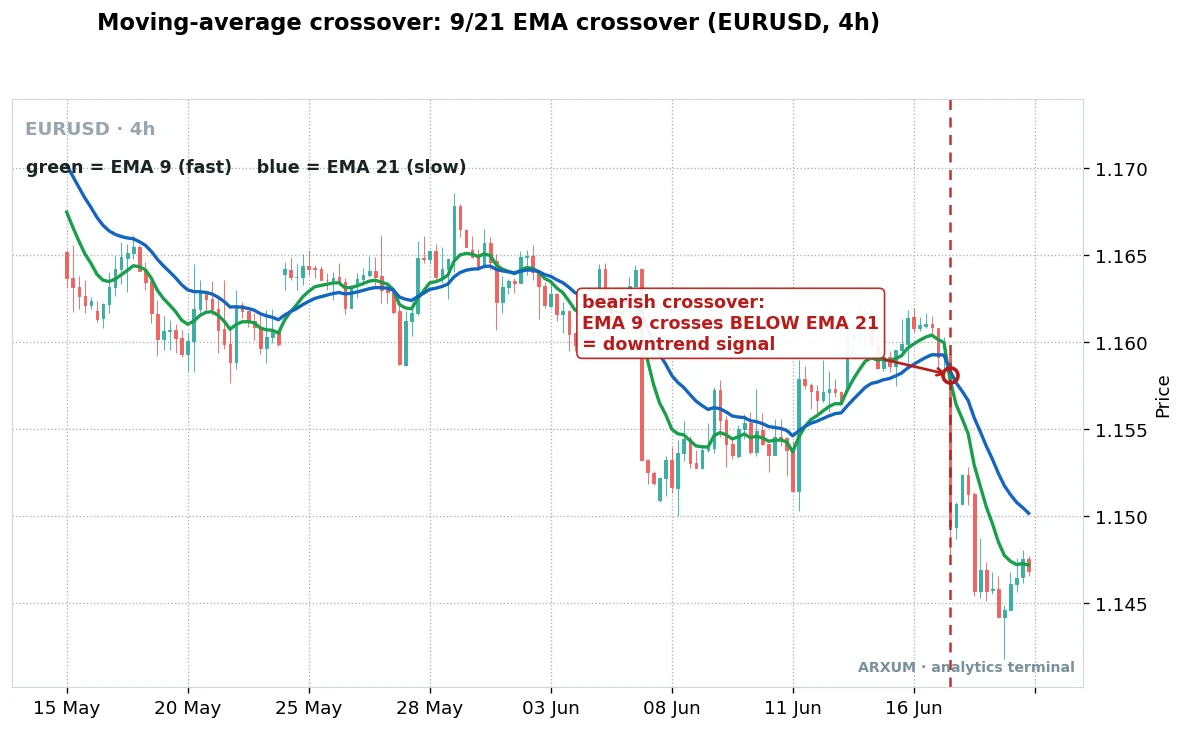
Look at how the two lines behave across the chart.
- Through the quiet middle the two EMAs weave together. That tangle is the range where crossovers fail.
- At the marked vertical line the 9 EMA cuts down through the 21 EMA, the bearish cross.
- The lines then separate and fan out. That widening gap is the trend picking up speed.
- The mirror image, the 9 EMA crossing up through the 21, would be the bullish version.
| Role | How you use it | Best TF and instrument |
|---|---|---|
| Entry trigger | Enter on the close of the crossover bar | H1 to H4 on EUR/USD, gold |
| Trend read | 9 above 21 is a long bias, below is short | H4 on Forex majors |
| Exit cue | Close when the pair crosses back the other way | H1 to H4, any instrument |
| Filter | Skip crosses while the two lines are tangled | Quiet, low-range sessions |
The trade-off: the 9/21 gets you in early and out early, so you catch more of each move but pay for it with more false starts when the market goes quiet.
The swing crossover: 20/50 EMA
Step up a gear and the 20/50 becomes the all-rounder. Fewer signals than the 9/21, and each one carries more weight.
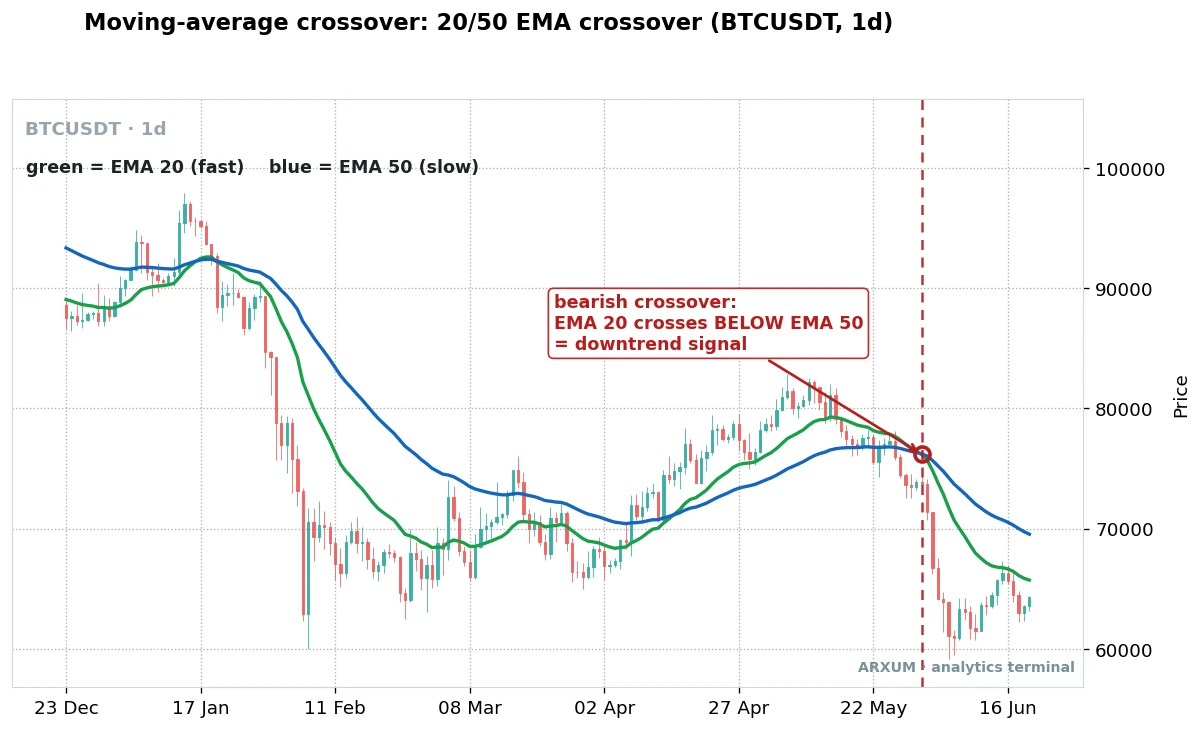
The Bitcoin chart shows why this pair loves a trending market.
- The 20 EMA leads price down, the 50 EMA follows, and they cross once, cleanly, at the marked bar.
- No tangle of repeated crosses here, because the market was actually trending, not ranging.
- After the cross the gap between the lines holds wide, which keeps you on the right side of the move.
- The same 20/50 read works long. The 20 crossing up through the 50 would flag the uptrend.
| Role | How you use it | Best TF and instrument |
|---|---|---|
| Entry trigger | Enter on the crossover close, with the trend | D1 on BTC, gold; H4 on FX |
| Trend regime | 20 above 50 is bullish structure, below is bearish | D1 on crypto and gold |
| Confirming gauge | Confirm a breakout that fires in the cross direction | H4 to D1, any instrument |
| Exit cue | Trim when the pair crosses back the other way | D1 swing holds |
Why crypto: Bitcoin and the majors run hard and around the clock, so a mid-speed pair like the 20/50 catches the meat of a move. It is a solid base for a crypto trend-following plan.
The regime crossover: the 50/200 golden and death cross
The slowest of the three is the one everyone has heard of. The opener chart is this exact signal.
On spot gold, daily, the 50 EMA crossing above the 200 EMA was the golden cross that opened months of gains. Flip it and the 50 dropping below the 200 is the death cross.
- The golden cross is the 50 crossing above the 200. It marks a shift into a bullish regime.
- The death cross is the 50 crossing below the 200. It marks a shift into a bearish regime.
- These fire rarely, a handful of times a year at most on the daily, so they are big-picture calls, not day-trade triggers.
- They arrive late by design. The trend is usually well underway before the slow lines confirm it.
| Role | How you use it | Best TF and instrument |
|---|---|---|
| Regime filter | Take longs only above a golden cross, shorts below a death cross | D1 on gold, BTC, indices |
| Bias for faster pairs | Let it set the direction, trade the 9/21 or 20/50 in that direction | D1 sets bias, H4 triggers |
| Context | Read the wide gap as a mature trend, a tightening gap as fading | D1 and weekly |
| Avoid | Do not use it as a timing entry, it is far too slow | Any fast timeframe |
The full mechanics, including how far behind the turn each cross lands, sit in the golden cross and death cross guide.
Adding a third line: the triple moving average
The triple systems answer one complaint about two lines, that a single cross can be a fluke. A triple moving average strategy stacks a third average in between and only trades when all three line up.
- A common set is the 4/9/18 EMA, fast, medium and slow, read together as a ribbon.
- The signal is all three in order, fast over medium over slow for longs, and the reverse for shorts.
- The payoff is fewer false trades, because a fluke cross of two lines rarely gets the third to agree.
- The cost is later entries and a busier chart. You wait for full alignment, so you give up the earliest part of the move.
| Setup | Signal | Trade-off |
|---|---|---|
| Two-line (9/21, 20/50) | Fast crosses slow | Earlier, but more false crosses |
| Triple (4/9/18) | All three stack in order | Cleaner, but later and busier |
Does the moving average crossover strategy work
Yes, in the market it was built for, and no, in the one it was not. The crossover is a trend tool.
Point it at a clean, one-way move and it earns its keep. Point it at a flat, choppy range and it hands you a string of false signals as the two lines cross back and forth.
The fix is not a better pair. It is a filter that keeps you out of the chop.
| Filter | What it does | How to apply |
|---|---|---|
| Trend filter | Only take crosses with the bigger trend | Longs above the 200 EMA, shorts below |
| ADX filter | Confirms a trend is actually present | Trade the cross when ADX is rising and above 20 |
| Wait for the close | Ignores intrabar fake crosses | Act on the crossover bar's close, not the touch |
| Higher timeframe | Aligns the signal with the bigger picture | Take H4 crosses that agree with the D1 trend |
A few plain notes on the filters above.
- ADX is a trend-strength gauge. A low reading means the market is ranging, which is exactly where crossovers misfire, so a rising ADX keeps you honest.
- The 200 EMA trend filter is the cheapest upgrade. Only trade crosses in the direction of the long-term average and half the whipsaw disappears.
- Waiting for the bar to close stops you acting on a cross that reverses before the candle finishes. It is patience, not a setting.
- A Supertrend line does a similar job to the ADX filter if you prefer a visual on the chart.
When you do take a trade, size it against a real stop and a planned target rather than a hope. The risk-reward ratio guide covers how to set that up so a run of false crosses stays survivable.
Crypto settings vs Forex settings
The same crossover needs different lengths on different markets, because they move at different speeds.
| Market | Typical pair | Why |
|---|---|---|
| Crypto (BTC, majors) | 20/50 or 8/21 EMA | Trends run hard and around the clock |
| Forex majors | 9/21 or 20/50 EMA | Cleaner trends on H4 and D1 |
| Gold (XAU/USD) | 20/50 or 50/200 | Strong multi-month trends suit slower pairs |
- A moving average crossover on crypto can run a touch faster, because the market trends hard and never closes for the weekend.
- Forex majors chop more inside the session, so the extra smoothing of a 9/21 or 20/50 pays off.
- Gold trends for months at a time, which is why the slow 50/200 regime read works so well on it.
- Whatever the market, keep the same pair across your testing. Do not flip lengths trade by trade to fit what already happened.
Which crossover to use when
The three systems are not rivals. You pick by what you are trying to do, and this table is the whole guide in one place.
| System | Signals | Strength | Weakness | Fits best |
|---|---|---|---|---|
| 9/21 EMA | Frequent | Early entries | More whipsaw | Intraday, short swing |
| 20/50 EMA | Moderate | Balanced | Lags sharp turns | Swing trading |
| 50/200 | Rare | Reliable regime | Very late | Position, big picture |
| 4/9/18 triple | Frequent, filtered | Extra confirmation | Still lags, complex | Fast trend confirmation |
A few rules of thumb drawn from that table.
- Use the slow pair to set the bias and a faster pair to time the entry. The 50/200 says which way, the 9/21 or 20/50 says when.
- The faster the pair, the more it needs a filter. A fast ma crossover strategy with no trend filter bleeds out in a range.
- Fewer signals is not worse. The 50/200 fires rarely and is right more often when it does, which is the trade you make with any slow pair.
- Do not stack five pairs on one chart. Two lines you understand beat a ribbon you cannot read.
What works: three things to remember
If you keep only three points from this guide, keep these.
- Match the pair to your timeframe. Fast pairs like the 9/21 for intraday, the 20/50 for swings, the 50/200 for the regime. An ema crossover strategy on the wrong speed just generates noise.
- Crossovers love trends and hate ranges. In a clean move the cross gets you positioned. In a chop the lines tangle and every cross is a false alarm, so filter for a real trend first.
- The signal lags on purpose. It confirms a trend rather than calling a top or bottom, so accept the late entry as the price of a signal that is actually there.
Traded for what it is good at, a moving average crossover is one of the simplest honest signals you can put on a chart. It will not call the turn, and it will lose in a range, but paired with a trend filter and a sensible stop it keeps you on the right side of the moves that matter.
Glossary: the key crossover terms
- Moving average: a line that plots the average price over a set number of bars, smoothing out the noise.
- Fast and slow average: the shorter-length line reacts first, the longer-length line confirms the bigger trend.
- EMA: exponential moving average, which weights recent bars more heavily so it turns faster.
- SMA: simple moving average, which weights every bar equally so it turns slower.
- Bullish crossover: the fast average closing above the slow one, a signal that momentum has turned up.
- Bearish crossover: the fast average closing below the slow one, a signal that momentum has turned down.
- Golden cross: the 50-length average crossing above the 200, a shift into a bullish regime.
- Death cross: the 50-length average crossing below the 200, a shift into a bearish regime.
- Whipsaw: a run of quick opposite signals in a range, where the two lines cross back and forth.
- ADX: a trend-strength gauge used to confirm a real trend is present before trading the cross.
FAQ
What is a moving average crossover, in plain terms?
Does the moving average crossover strategy actually work?
What is the best moving average crossover?
What is the best timeframe for a moving average crossover?
What moving average crossover settings are best for crypto?
Should I use EMA or SMA for a crossover?
What are the golden cross and the death cross?
Can I trade the moving average crossover on its own?
Real-time trade setups with entry, stop loss and take profit. Daily market analysis. No subscription, no complicated theory.
🌍 Our recommended brokers


Reader Reviews
Be the first to review this — tell other traders what actually helped, or where it fell short.
Leave a Review

Momentum Trader & Technical Analyst
Trades momentum across crypto and forex since 2019, built around RSI, MACD, and volume. Turns discretionary setups into rule-based, systematic entries and validates them on data before they go live.
