
What the VIX is: the fear gauge, explained
The VIX index is one number that tells you how nervous the stock market is. The CBOE builds it from the prices traders pay for S&P 500 options, which rise when people rush to buy protection.
High option prices mean the market expects big moves, so a high VIX means fear.
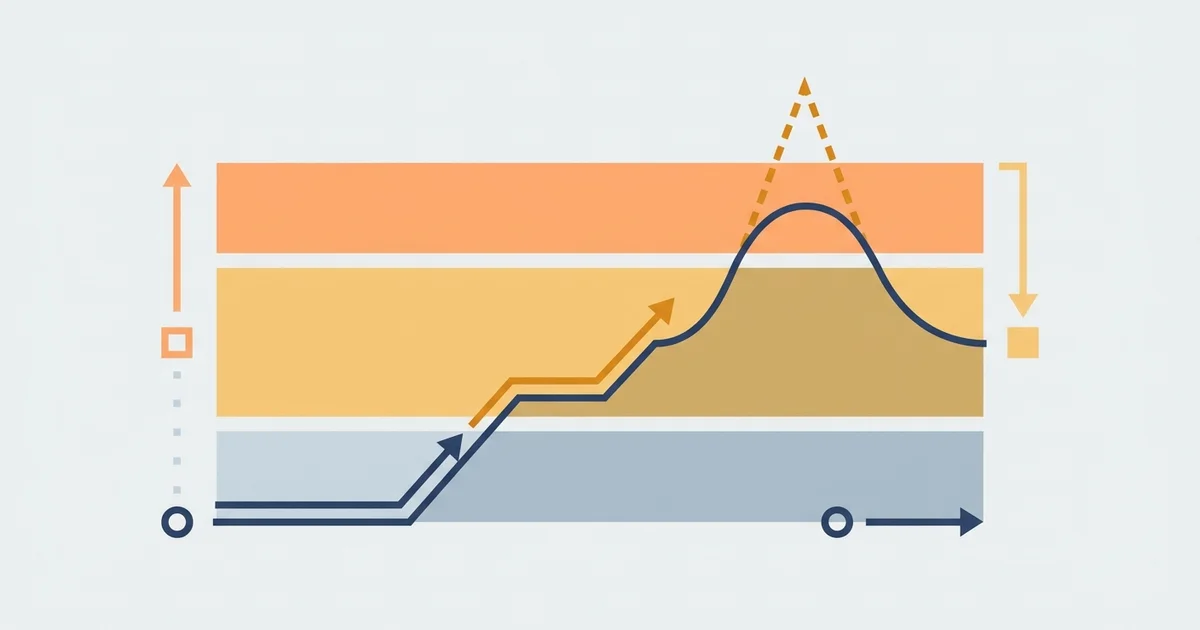
Here is the whole idea on one chart before we break down the parts.
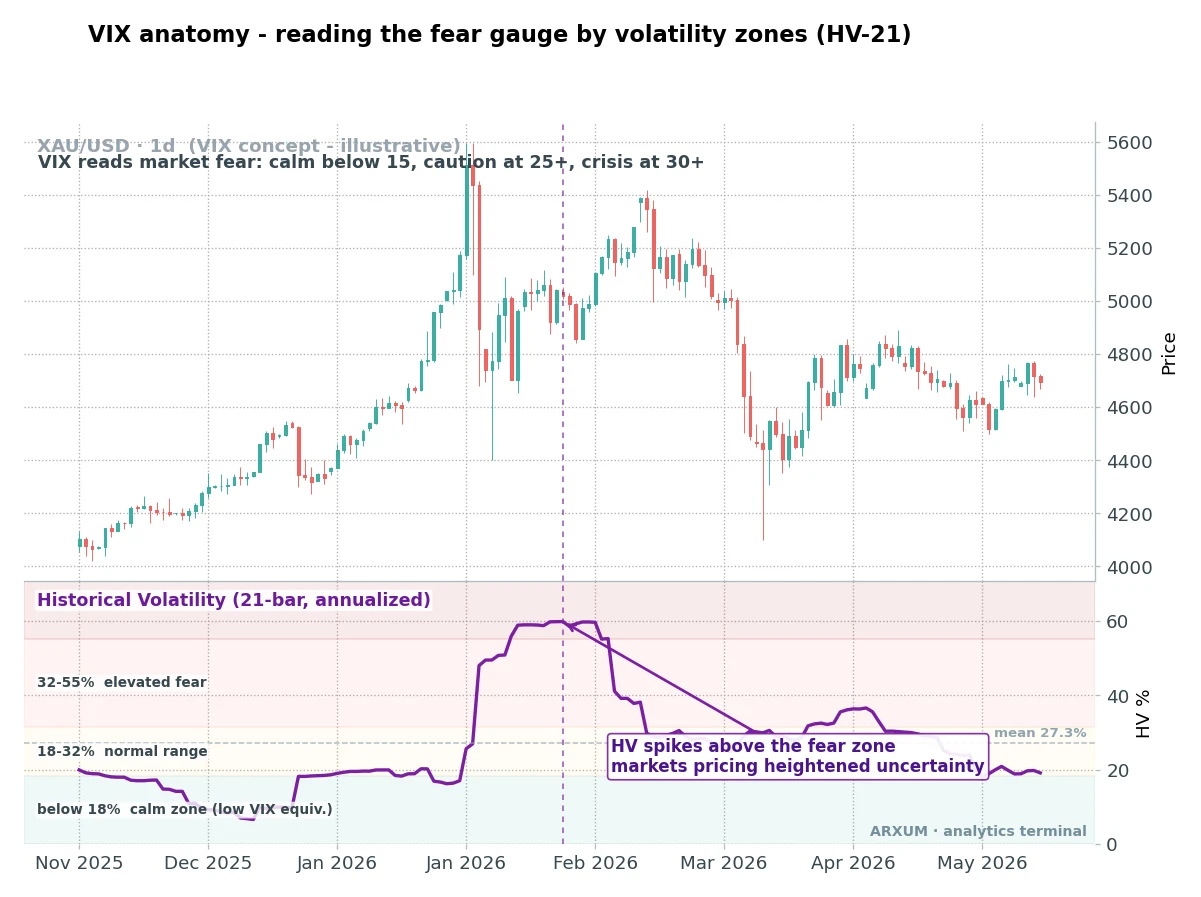
One honesty note before you read on. The VIX only exists for the S&P 500.
To show the same behaviour on the markets you actually trade, the charts here use historical volatility, a plain measure of how much price has already been moving, as an illustrative proxy. The zones and the spikes read identically.
What the picture is telling you:
- The line is a fear meter. When it sits low and flat, the market is calm and drifting. When it jumps, something has spooked traders.
- The zones matter more than the number. Each market has its own normal range, so read where the line sits inside its bands, not the raw figure. The percentages on these charts are each market’s own volatility scale, not the VIX ladder from the next section, so read the zone, not the digits.
- Spikes are events, not trends. Fear arrives fast and fades slowly, which is the single most useful thing to know about volatility.
- HV-21 just means volatility measured over the last 21 bars and scaled to a yearly figure, the standard window.
The VIX index explained: reading the levels
For the real VIX, the numbers have well-worn meanings. This is the ladder every desk keeps in its head, and it is the first thing to learn if you want the VIX index explained in one table.
| VIX level | What it means | Market mood |
| Below 15 | Complacency, low volatility | Calm, slow grind higher |
| 15 to 25 | Normal range | Business as usual |
| 25 to 30 | Elevated fear | Selling pressure building |
| 30 to 40 | Panic | Sharp risk-off, sell-offs |
| Above 40 | Extreme crisis | Crashes and forced selling |
A few facts anchor the ladder:
- Below 15 looks calm, and that is the catch. Cheap protection and a sleepy market are exactly when a shock hurts most, because nobody is hedged.
- Above 30 is where the word panic earns its place. The 2020 COVID crash drove the VIX near 85, its highest reading of the modern era.
- The middle band, roughly 15 to 25, is where the index spends most of its life. Treat it as background noise.
What does high VIX mean in practice: it says option buyers expect large moves soon, usually downward, so it is a proxy for stress rather than a buy or sell button.
Why the VIX moves opposite to stocks
The VIX and the S&P 500 usually pull in opposite directions, and that inverse link is the whole reason traders watch it. Fear and falling prices arrive together.
| Stocks are | VIX tends to | Why |
| Rising steadily | Drift lower | No rush to buy protection |
| Falling sharply | Spike higher | Everyone hedges at once |
| Ranging quietly | Sit low and flat | Expected moves are small |
That relationship gives the VIX two jobs, and both are worth having:
- As a timing signal: an extreme spike often lines up with a washout low in stocks, the point where panic selling burns itself out, because peak fear tends to come near the bottom, not the top. This is why the VIX sits in most market timing toolkits.
- As a mood ring: a slow, steady climb in the VIX while stocks are still near highs is a quieter warning that hedging demand is picking up under the surface.
How to trade VIX: the products
You cannot buy the VIX index itself, so how to trade VIX comes down to picking the right vehicle. Each one tracks volatility differently, and the differences bite.
A quick note on the labels below:
- CFD: a contract that tracks a price, so you trade the move without owning anything.
- ETF and ETN: an ETF is a fund you buy like a share; an ETN is its debt-backed cousin. VXX and UVXY are the names people use to go long volatility this way.
- Futures: a standard contract to buy or sell at a set date, the raw building block the funds above are made from.
| Product | What it is | Watch out for |
| VIX futures / CFD | Direct bet on future VIX | Roll cost between contracts |
| VXX (ETN) | Short-term VIX futures | Roll decay grinds it lower |
| UVXY | Leveraged long volatility | Decay is brutal, short holds only |
| SVXY | Short volatility (inverse) | A single vol spike can gut it |
The one trap that catches every beginner is decay, so it gets its own bullets:
- Roll decay is the silent killer. Later-dated VIX futures usually cost more than the front month, which is the nearest contract, so funds like VXX sell low and buy high every roll, bleeding value over time.
- VXX is not a buy-and-hold. Over long stretches of calm it grinds steadily down, no matter what the spot VIX does. It is a short-term hedge, held for days or weeks.
- UVXY is a hand grenade. The leverage plus the decay means it can lose value even on a day the VIX rises, so it suits only fast, deliberate trades.
- SVXY is the opposite risk. Shorting volatility earns a little most of the time and can lose a lot in one session when fear explodes. In early 2018 a single spike wiped out a similar short-volatility product, XIV, overnight.
Most retail traders reach the VIX through a broker that offers a volatility-index CFD rather than the US-listed ETFs.
VIX options: hedging and fading fear
VIX options are the sharper tool, and they split into two clear playbooks depending on where fear sits. This is where volatility trading gets its cleanest expressions.
A call is the right to buy and a put is the right to sell. You can buy either as insurance, or sell either to collect the premium and take the other side of the bet.
| Play | When | The idea |
| Buy VIX calls | VIX low, market calm | Cheap crash insurance |
| Sell VIX puts | VIX elevated | Bet the VIX itself falls |
| VIX call spread | Before a known event | Defined-risk hedge |
The logic behind each is short and worth memorising:
- Buying calls when the VIX is low is buying insurance while it is cheap. If a shock hits, the calls jump; if nothing happens, you lose only the small premium.
- Selling puts when the VIX is high is a mean-reversion bet. Fear rarely stays extreme, so a high VIX has more room to fall than to rise, and the put seller profits as it eases.
- A call spread before an event, like a central-bank decision, caps both cost and payout. It is the professional way to hedge a specific risk without paying up for open-ended protection.
The through-line is that fear loves to snap back to its average, which is the single trait every VIX options trade leans on.
Volatility trading strategies
Step back from the ticker and volatility trading is really a choice between two sides, plus one signal that warns you when a market has gone too calm.
| Approach | Regime | Reward vs risk |
| Short volatility | Low, stable VIX | Steady premium, rare blowup |
| Long volatility | Calm before a storm | Bleeds slowly, pays big on a spike |
| VIX-SPX divergence | Both rising together | Early warning of a top |
The mean-reversion habit of volatility is the thread that ties them together, and it shows up on any market once you plot its volatility.
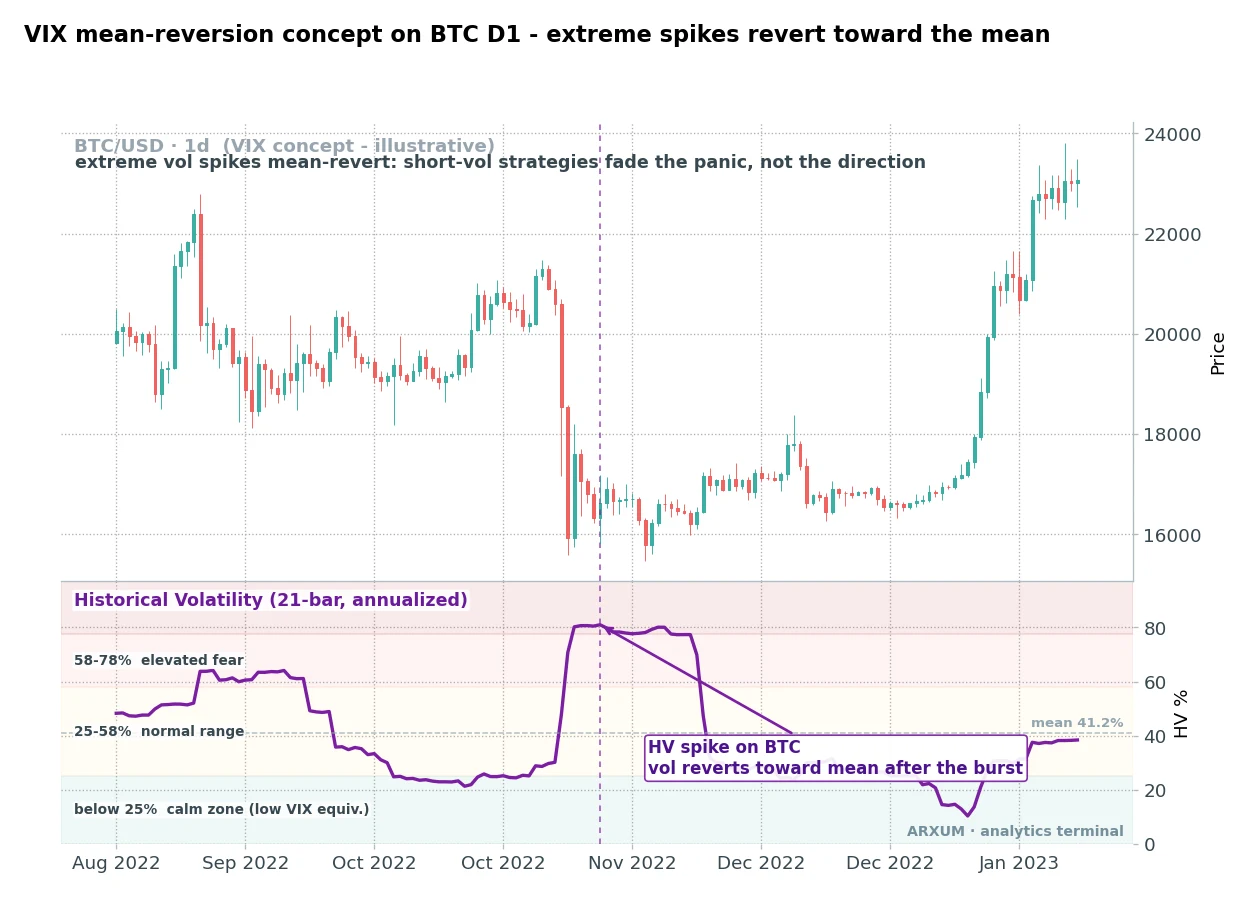
How the three approaches play out:
- Short volatility earns a small, steady return in calm markets by betting things stay quiet. The catch is the rare, violent spike that can erase months of gains, so position size is everything.
- Long volatility is the mirror. It costs you a little every calm week but pays off hard when fear finally arrives, which makes it a tail hedge, protection against a rare, violent move, rather than an income trade.
- VIX-SPX divergence is the odd one: when stocks and the VIX rise together, hedging demand is climbing even as prices push up. That disagreement often flags a nervous, top-heavy market.
The filter sweep here is simple: run these approaches against the regime and only short volatility when the market is genuinely calm and range-bound. When the read is a quiet, stable tape, that calm regime is the gate that greenlights the short-vol trade.
The VIX read on the markets you trade
You may never touch a VIX product and still use its logic every day. Volatility spikes translate straight across to gold, Bitcoin and the forex majors, because fear is a market-wide event.
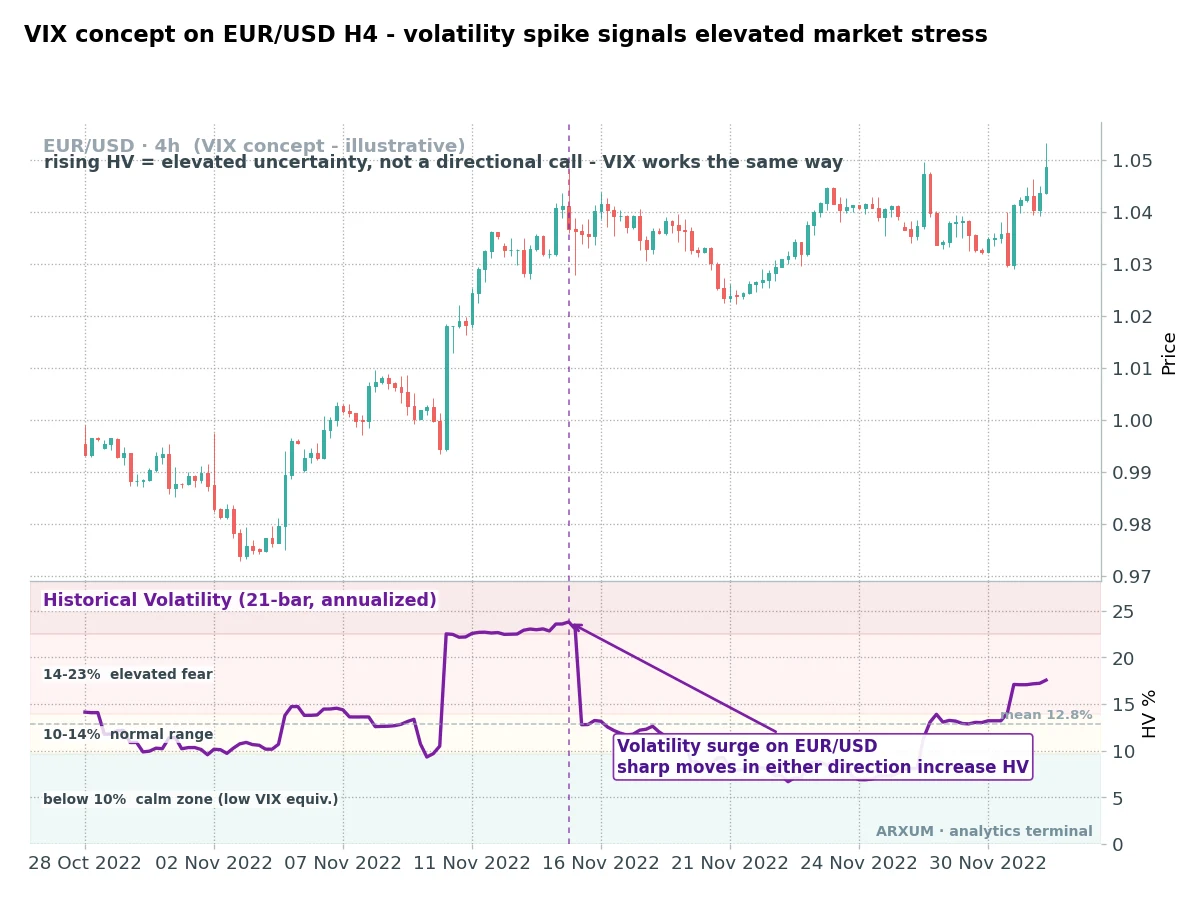
The same fear reads differently on each instrument you trade:
| Market | How fear shows up | Note |
| Gold (XAU/USD) | Often bid when VIX spikes | Safe-haven, volatility jumps too |
| EUR/USD | Wider ranges, dollar bid | Risk-off favours the dollar |
| Bitcoin (BTC/USD) | Sells off with tech | Trades risk-on, sympathy dumps |
| S&P 500 | Falls as VIX rises | The VIX's home market |
Two habits make the cross-market read useful:
- Use the VIX as a risk switch. A reading above 30 is a plain heads-up to trade smaller and expect choppy, gap-prone price action on everything, not just stocks.
- Compare it to ATR, which measures the actual volatility of the one instrument in front of you. The VIX reads the whole market’s mood, while ATR reads your chart, and the two together beat either alone.
VIX and crypto: the sympathy sell-off
Crypto traders get the most direct payoff from watching the VIX, because Bitcoin swings harder than the broad market when fear takes over.
| VIX state | Typical crypto reaction | What to do |
| Low and calm | Free to trend on its own story | Trade the crypto setup |
| Rising past 25 | Correlation with stocks tightens | Tighten risk, expect chop |
| Spiking above 30 | Sympathy sell-off, dumps hard | Stand aside or hedge |
The practical reads for a crypto trader:
- When the VIX is quiet, crypto trades its own drivers, halving cycles, flows and narrative. Ignore it and focus on the chart.
- When the VIX rips above 30, that independence breaks. Bitcoin tends to fall with the Nasdaq as leveraged players sell everything liquid to raise cash.
- The lesson is not to trade crypto off the VIX, but to know when a broad fear event is about to override your setup. For a crypto-native read, pair it with the fear and greed index.
Which VIX approach to use when
Put the pieces together and the choice comes down to what you are actually trying to do.
| You want to | Use | Best when |
| Time a stock entry | VIX spike as a bottom clue | Panic above 30 |
| Hedge a portfolio | VIX calls or a VXX slice | VIX low and complacent |
| Fade extreme fear | Sell VIX puts, carefully | VIX high and easing |
| Read risk-on or risk-off | VIX level plus its trend | Any trading day |
Rule of thumb: if you are new to this, use the VIX as a read, not a trade. The level and its direction tell you how much risk to take on your existing setups long before you ever buy a volatility product.
How to actually use the VIX
You do not need a special account to start reading it. The VIX is free to watch, and the products are a step you take later, if at all.
A simple routine, top to bottom:
- Pull up the VIX. On TradingView or your broker, type the ticker VIX for the CBOE Volatility Index. Add it to your watchlist beside your main charts.
- Read the level against the ladder. Below 15 is calm, 25 to 30 is elevated, above 30 is panic. Note where it sits today.
- Read the direction. A reading rising off a low is early stress. One falling from a spike is fear draining out, often a green light for risk assets.
- Match your risk to the reading. High and rising means trade smaller and wider. Low and flat means normal conditions.
- Only then consider a product. If you want to hedge or trade volatility directly, pick the vehicle from the products table and size it small, because these instruments move fast.
For the volatility read on your own instrument rather than the whole market, add the “Historical Volatility” indicator on TradingView, or on MT4 and MT5 use Insert then Indicators to add an ATR or a volatility gauge. That is the line drawn in the panels above.
Two guardrails keep this honest, and they matter more than any entry:
- Never hold leveraged VIX products for long. VXX and especially UVXY decay, so a hedge you forget about quietly loses money even if you were right about the fear.
- Size volatility trades against the worst case. A short-vol position can lose many times its usual gain in one bad session, so check the reward against the risk and keep the position small. On a $700 account, small means risking a slice you can lose, roughly $15 to $30 on one position, not a big chunk.
What actually works with the VIX
The short version to remember:
- The VIX is a fear meter, not a crystal ball. It tells you how much the market expects to move, and roughly that stocks and volatility move opposite ways. It never tells you the exact top or bottom.
- Extremes mean-revert. A spike above 30 is more likely to fall than to keep climbing, which is why fading extreme fear beats chasing it. The BTC panel above shows that snap-back in action.
- The level sets your risk. Even if you never trade a VIX product, letting the reading dial your position size up in calm markets and down in fearful ones is the edge most traders miss.
The risk, kept honest
The VIX is a genuinely useful gauge, and it is also where beginners lose money fastest if they trade it like a stock:
- The products decay. VXX and UVXY are built to lose value in calm markets, so a long hedge held too long bleeds out. Treat them as short-term tools, not investments.
- Short volatility has a fat tail. Selling volatility feels like free money until the day it is not. One mean-reversion bet against a spike that keeps going can dwarf months of small wins.
- A high VIX is not an automatic buy. Fear can climb and keep climbing in a real crisis. The spike-equals-bottom idea is a tendency, not a rule, so it needs confirmation from price.
- It is a stock-market gauge first. For gold, forex and crypto it is context, a risk-on or risk-off backdrop, not a direct trading signal for those charts.
Key terms
- VIX: the CBOE Volatility Index, the market’s fear gauge, built from S&P 500 option prices.
- Implied volatility: how much the market expects price to move, read from option prices, which is what the VIX measures.
- Calls and puts: a call is the right to buy, a put the right to sell. You can buy either for protection or sell either to collect the premium.
- CFD, ETF and ETN: the wrappers you trade the VIX through. A CFD tracks a price without owning it, an ETF is a fund bought like a share, and an ETN is its debt-backed version.
- Historical volatility (HV): how much price has actually moved over a past window, the proxy used on the charts here.
- Contango and roll decay: later VIX futures usually cost more, so funds like VXX lose value each time they roll.
- Short volatility: betting markets stay calm to collect premium, with a rare but severe blowup risk.
- Mean reversion: the tendency of a stretched reading, like a VIX spike, to return toward its average.
FAQ
What is VIX trading, in plain terms?
VIX trading means using the CBOE Volatility Index, the stock market's fear gauge, either as a signal or as something you actually trade. As a signal, you read whether the market is calm or scared to judge risk. As a trade, you use products like VIX futures, the VXX ETF, or VIX options to profit from volatility rising or falling. You cannot buy the index itself, only these vehicles that track it.
What does a high VIX mean?
A high VIX means option traders expect large moves in the S&P 500 soon, usually because they are buying protection against a fall. Readings above 30 signal panic, and above 40 point to a crisis, as in the 2020 crash when the VIX neared 85. A high VIX is a proxy for fear and stress, not a direct instruction to buy or sell.
When does the VIX spike?
The VIX spikes when stocks fall fast and traders rush to buy options for protection all at once. Sharp sell-offs, surprise economic news, geopolitical shocks and crashes all drive it up. It tends to rise quickly and fade slowly, so spikes are events rather than lasting states. Peak fear often lines up with a washout low in stocks rather than the top.
How do you trade the VIX?
Since you cannot buy the index, you trade it through VIX futures or a CFD on the volatility index, ETFs and ETNs like VXX and UVXY, or VIX options. Many retail traders use a broker that offers a volatility-index CFD. Each product tracks volatility differently, and most long ones decay over time, so they suit short holds rather than buy-and-hold.
What are VIX options and how do you use them?
VIX options are calls and puts on the volatility index. The two common plays are buying calls when the VIX is low, as cheap insurance against a crash, and selling puts when the VIX is high, a mean-reversion bet that fear will fade. A call spread ahead of a known event caps both your cost and your payout, which is a defined-risk way to hedge.
Why do VIX ETFs like VXX lose value over time?
VXX holds short-term VIX futures, and those later-dated contracts usually cost more than the front month. To stay invested, the fund keeps selling cheaper expiring futures and buying pricier new ones, a drag called roll decay. Over long calm stretches this grinds the price steadily lower regardless of where the spot VIX sits, which is why VXX is a short-term tool.
Does the VIX affect Bitcoin and forex?
Yes, indirectly. When the VIX spikes above 30, fear spreads across markets, and Bitcoin often sells off in sympathy with tech stocks as traders raise cash. In forex, a fear spike usually bids the dollar and widens ranges. The VIX does not give a direct buy or sell for these markets, but it tells you when a broad risk-off event may override your setup.
What is a normal VIX level?
The VIX spends most of its time between about 15 and 25, which counts as its normal range and reflects everyday market noise. Below 15 signals complacency and unusually calm conditions. Above 25 marks elevated fear, and above 30 is genuine panic. The exact number matters less than whether it is rising or falling and which zone it sits in.
Is volatility trading suitable for beginners?
The reading is, the trading is not. A beginner can safely use the VIX level and its direction to size positions and gauge market mood on their existing charts. Actually trading volatility products is advanced, because decay, leverage and fat-tail risk can lose money quickly even when your view is right. Start by watching the VIX as context before you ever trade a volatility instrument.
🌍 Our recommended brokers


Reader Reviews
Be the first to review this — tell other traders what actually helped, or where it fell short.
Leave a Review

Forex Analyst & Senior Trader
Former FX desk trader with 8 years in institutional forex. Works in multi-timeframe analysis and order flow, turning desk experience into systematic, testable rules across forex and metals.