
How to read a candlestick: start with the anatomy
Every candlestick is a picture of one slice of time. It shows what price did between the moment it opened and the moment it closed.
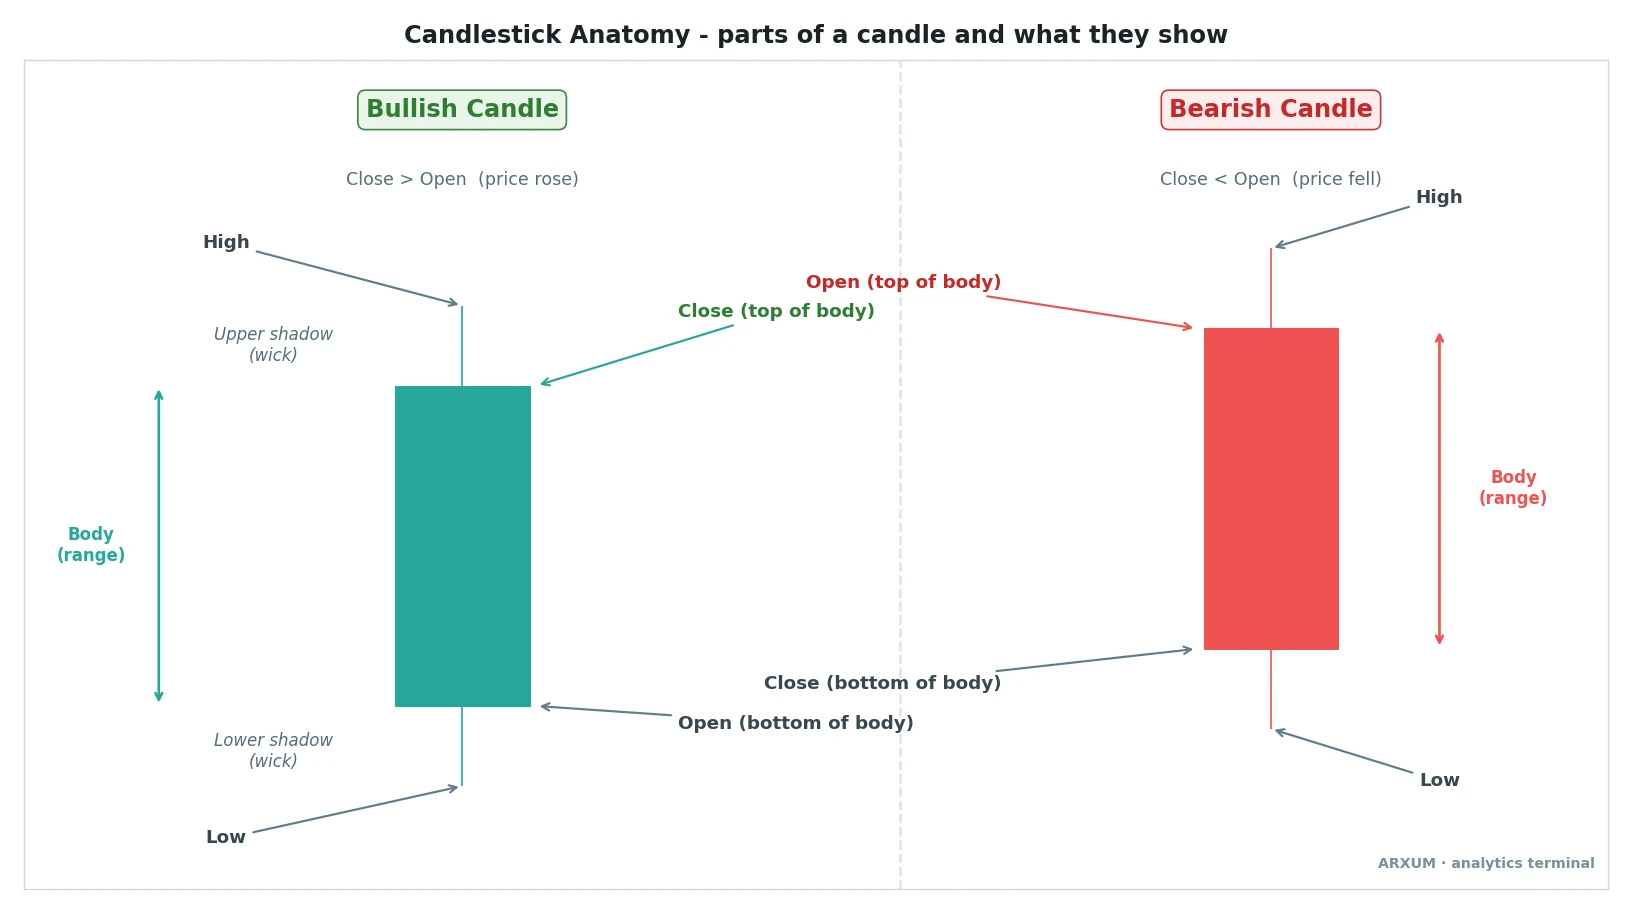
Look at the picture before the words. Each candle holds four prices, and the shape tells you where each one sits.
| Price | What it is | Where to find it |
| Open | Where the candle started | One end of the body |
| Close | Where the candle ended | The other end of the body |
| High | The highest price reached | Tip of the upper wick |
| Low | The lowest price reached | Tip of the lower wick |
Those four prices split the candle into two parts you read separately.
| Part | What it is | What it tells you |
| Body | Open-to-close distance | Who won the session |
| Upper wick | Close/open up to the high | How far price rose, then gave back |
| Lower wick | Close/open down to the low | How far price fell, then recovered |
| Colour | Body fill | Whether it closed up or down |
That is the whole alphabet. Reading candlestick charts is just reading those parts in order, one pass at a time.
A candle is not drawn all at once. It builds live while its period is open, and only settles into its final shape when the period ends.
- The open is fixed the instant the period starts, and it never moves.
- The close is wherever price sits when the period ends, so it keeps changing until then.
- The high and low stretch out as price prints new extremes inside the period.
- Only the closed candle is final, which is why most traders wait for the close before they act on a candle.
Pass one: the colour tells you direction
Colour is the fastest read on the chart. It answers one question: did this candle close higher or lower than it opened?
| Colour | Meaning | Open vs close |
| Green (or hollow) | Bullish, closed up | Close above open |
| Red (or filled) | Bearish, closed down | Close below open |
The same rule, laid out both ways, is all colour ever tells you.
| Feature | Bullish candle | Bearish candle |
| Colour | Green or hollow | Red or filled |
| Close vs open | Close above open | Close below open |
| Open on the body | Bottom of the body | Top of the body |
| Who won the session | Buyers | Sellers |
A few things beginners trip on with colour:
- Green and red are the common defaults, but some platforms use black and white, blue and orange, or draw the up candle hollow (outline only) and the down candle filled (solid). The rule never changes: the up-close style is bullish, the down-close style is bearish.
- Colour alone is thin. A green candle that barely closed up is very different from a green candle that ran all session, and only the body size tells them apart.
- One green candle in a falling market is not a turn. It is one session, read in the context of the trend around it.
The takeaway: colour gives you direction in a glance, but it is the first word of the sentence, not the whole message.
Pass two: the body tells you conviction
The body is the thick block between the open and the close. Its size is the single most useful thing on a candle, because it measures how one-sided the session was.
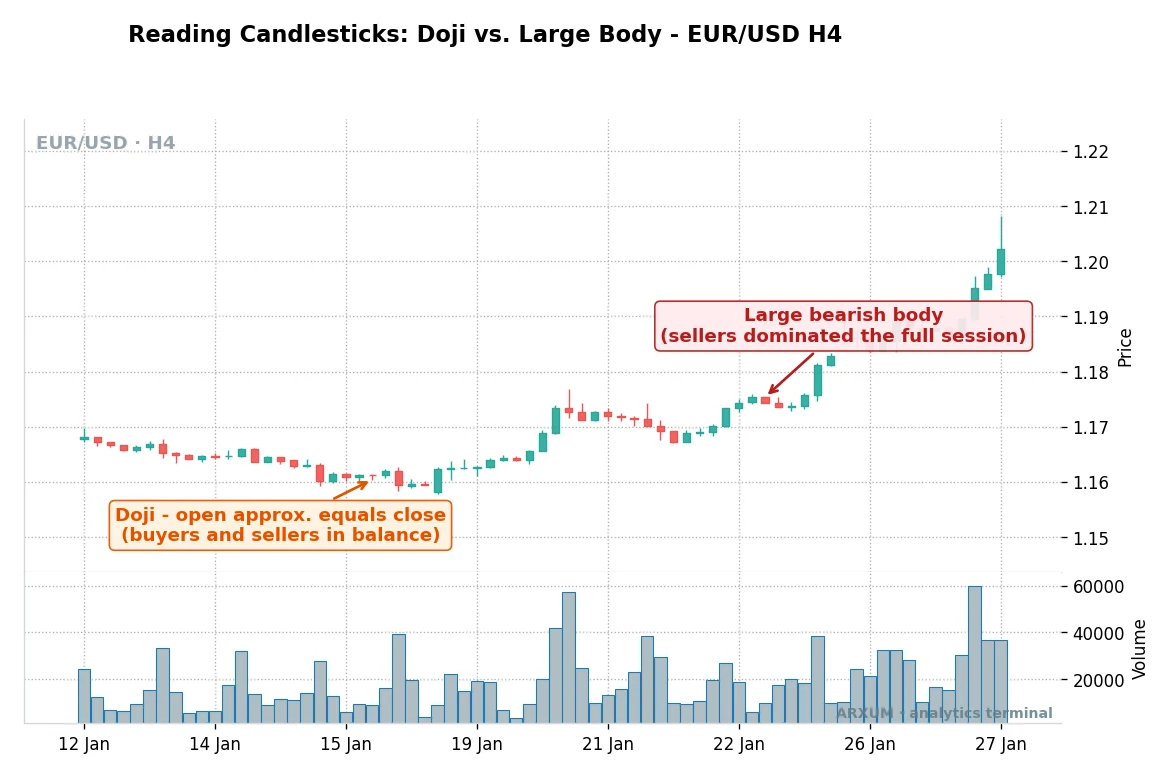
Here is what the body is telling you on that chart. A big body is a decision.
A small body is an argument.
| Body | What it says | How to use it |
| Long body | One side dominated | Momentum, respect the direction |
| Medium body | A clear but calmer session | Normal trend candle |
| Small body | Buyers and sellers even | Caution, wait for a break |
| No body (doji) | Open equals close, deadlock | A pause, sometimes a turn |
The doji is the extreme small body, where price finished almost exactly where it started. It reads as indecision, and after a long run it can warn that momentum is fading.
It is only a warning though, not a signal on its own. There is a full breakdown in the doji candle guide.
Body vs wick in one line: the body is who won the session, the wick is who got rejected. Keep those two questions separate and candles get much easier to read.
Pass three: the wicks tell you rejection
Wicks, also called shadows, are the thin lines poking out of the body. Each wick is a price the market reached and then walked away from.
That rejection is information.
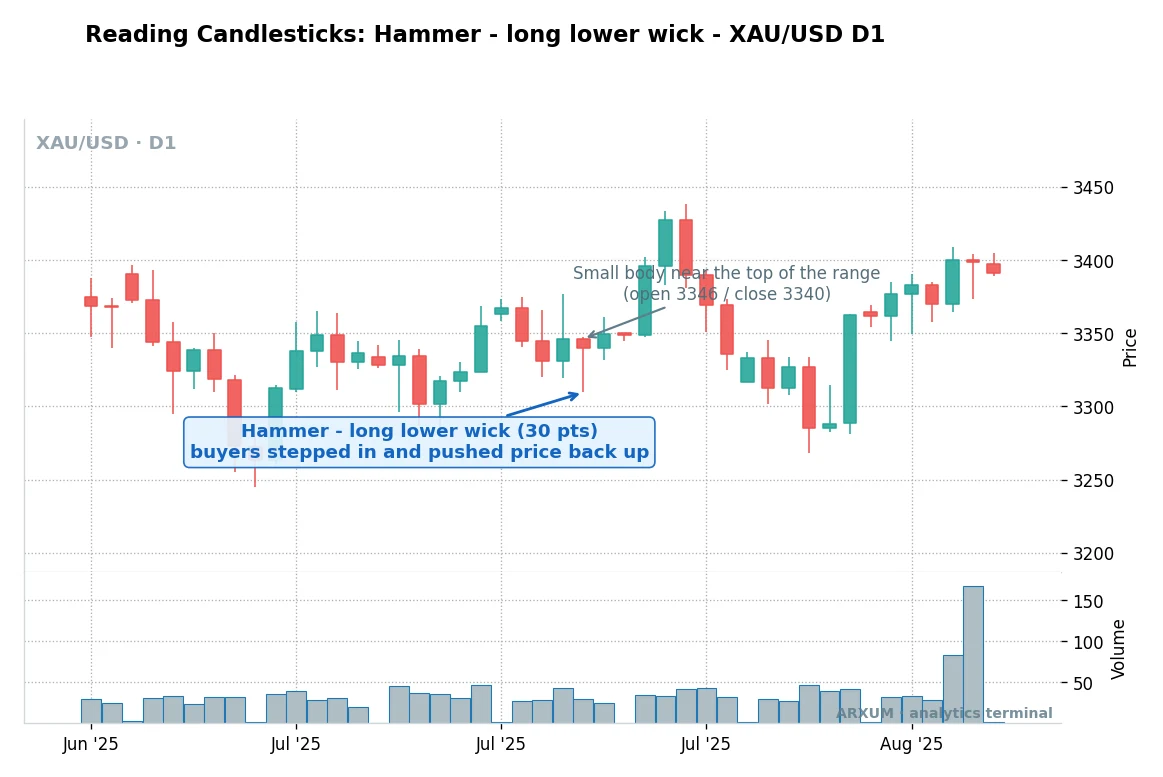
On that gold candle the long lower wick is the whole story. Sellers forced price down by roughly 30 points, which is what the label’s “30 pts” means, then buyers stepped in and the close finished near the top.
That is rejection of lower prices, printed as a shadow. The second, greyed candle is the opposite kind of session: a small body near the top of its range, where the open and close sat close together and neither side really won.
| Wick | What it says | Common name |
| Long lower wick | Buyers rejected lower prices | Hammer |
| Long upper wick | Sellers rejected higher prices | Shooting star |
| Wicks on both ends | Volatile and indecisive | Spinning top |
| Almost no wick | One side controlled start to end | Marubozu |
A long wick matters more when it lands at a level that already means something.
A long lower wick into support, a price floor buyers keep defending, says buyers held that line again. A long upper wick into resistance, a ceiling sellers keep guarding, says sellers turned price away again.
- A hammer is a small body with a long lower wick, and the hammer candle guide covers when it turns a market.
- Flip it and you get the shooting star, a small body with a long upper wick at the top of a run.
- Two candles that swallow each other are a different tell, the engulfing candle, where one body eats the last.
The takeaway: the wick is a rejected price, not a target. It shows where the market tried to go and was pushed back, which is often where the next fight happens.
Body vs wick: the two questions every candle answers
Once you can see the body and the wick separately, a candle stops being a symbol and starts being a sentence. It answers two questions at the same time.
| Question | Read it from | What you learn |
| Who won the session? | Body size and colour | Direction and conviction |
| Who got rejected, and where? | Wick length and side | The price the market refused |
Put the two reads together and the common candles name themselves:
- Strong trend candle: long body, tiny wicks. One side ran the session with almost no pushback.
- Reversal warning: small body, one long wick into a level. The trend reached a price and got rejected.
- Standoff: small body, wicks both sides. Nobody won, so the market is deciding.
Read those two questions together and most of the single candles you will hear named simply fall out of the body-and-wick combination.
| Candle | Body | Wick | What it hints |
| Marubozu | Long | Almost none | Full control, strong trend |
| Hammer | Small, near top | Long lower | Buyers defended a low |
| Shooting star | Small, near bottom | Long upper | Sellers defended a high |
| Spinning top | Small | Both sides | Indecision, a pause |
| Doji | None to tiny | Any | Deadlock, momentum fading |
None of these names matter on their own. They are just quick labels for a body-and-wick reading you can already do, and each one only earns attention at the right trend or level.
Reading candlestick charts across timeframes
The exact same candle rules work on every timeframe. What changes is how much each candle is worth.
A daily candle is one full day of fighting, a five-minute candle is five minutes of it.
| Timeframe | One candle covers | Best for |
| Daily (D1) | One trading day | Trend, the cleanest signals |
| 4-hour (H4) | Four hours | Swing entries, more setups |
| 1-hour (H1) | One hour | Fine-tuning, more noise |
| 5-minute (M5) | Five minutes | Scalping, mostly noise |
Two rules of thumb keep beginners out of trouble here:
- A candle on a higher timeframe carries more weight. A hammer on the daily is a bigger deal than a hammer on the 5-minute, because far more traders acted inside it.
- Zooming in does not add clarity, it adds noise. Most flip-flopping on the 1-hour or 5-minute is chop the daily never even notices.
You can pull up any of these charts free on a platform like TradingView, or inside a broker’s MT4 or MT5 terminal, and switch timeframes with one click to see the same candle change meaning.
The same candle, different market
A green body means the same thing on gold, Bitcoin, and EUR/USD. What differs between markets is the volume underneath and the gaps between sessions, and both change how you read a candle.
| Market | Volume shown | Watch out for |
| Gold (XAU/USD) | Tick volume only | Long wicks, strong trends |
| Forex majors | Tick volume only | Weekend gaps, thin sessions |
| Bitcoin (BTC) | Real traded volume | 24/7, big wicks, no sessions |
The volume difference is the one that catches people out:
- On crypto, exchanges report real traded volume, so a volume surge under a big candle is a genuine tell that money backed the move.
- On gold and Forex, the platform shows tick volume, which counts price updates rather than money traded. It hints at activity, but it is not the real thing, so lean on the body and wick instead.
- Forex and gold pause on the weekend, so Monday can open with a gap. Bitcoin never closes, so it rarely gaps but prints wild wicks instead.
A single candle is one word, not the sentence
This is the honest part, and it is the mistake that costs beginners the most. One candle is a single word.
It only means something inside the sentence around it.
The context that gives a candle meaning:
- Trend. A hammer in a downtrend that is bottoming is a signal. The same hammer in the middle of nowhere is noise.
- Level. A long wick at support or resistance is a defended line. The same wick in open space is just wobble.
- Clusters. Real signals often take two or three candles together, which is exactly what named candlestick patterns capture.
So read candles in this order, always: the trend first, then the level, then the candle. The candle confirms a story the chart is already telling.
It does not invent one on its own. If you want the wider skill of reading what price is doing beyond single candles, price action trading is the next step, and Heikin Ashi candles are a smoothed variant worth knowing.
Common mistakes when reading candles
- Trading a single candle with no trend or level behind it.
- Reading colour only and ignoring how big the body is.
- Treating every doji as a reversal. Most are just pauses.
- Dropping to the 5-minute and drowning in noise.
- Seeing a wick as a target instead of a rejected price.
- Trusting a tick-volume spike on gold like it was real crypto volume.
- Forcing a name onto every candle. Plenty are just ordinary bars.
What to remember: read any candle in three passes
You can read any candlestick on any market with the same short routine:
- Colour for direction. Up-close or down-close.
- Body for conviction. Long is one-sided, small is a standoff.
- Wick for rejection. A long shadow is a price the market refused.
- Context decides if it matters. Trend first, then level, then the candle.
Get those three passes automatic and the patterns come easily, because every pattern is just a few of these candles read together. Start on the daily, on one market you follow, and read one candle a day out loud until it is second nature.
FAQ
What is a candlestick chart, in plain terms?
A candlestick chart shows price as a row of small bars, one per slice of time. Each candle packs in four prices: the open, the close, the high, and the low. The thick body runs from the open to the close, the thin wicks reach out to the high and the low, and the colour tells you whether price finished up or down. Read together, those parts show what buyers and sellers did in that period.
How do you read candlestick charts for beginners?
Read each candle in three passes. First the colour for direction, green closed up and red closed down. Then the body for conviction, a long body means one side dominated and a small body means a standoff. Then the wicks for rejection, a long shadow marks a price the market reached and refused. Finally, check the context, because a candle only matters next to the trend and the levels around it.
What do candlestick colours mean?
Colour shows whether the candle closed above or below where it opened. Green, or a hollow candle, is bullish and means the close was above the open. Red, or a filled candle, is bearish and means the close was below the open. Some platforms swap the colours for black and white or blue and orange, but the rule never changes: the up-close colour is bullish and the down-close colour is bearish.
What is the difference between the body and the wick?
The body is the thick block between the open and the close, and it shows who won the session and how convincingly. The wick, also called the shadow, is the thin line above or below the body, and it shows a price the market reached then rejected. In short, the body answers who won and the wick answers who got pushed back. Reading them as two separate questions makes any candle easier to understand.
What does a long wick mean on a candle?
A long wick is a rejected price. A long lower wick means sellers pushed price down but buyers dragged it back before the close, which is the shape of a hammer. A long upper wick means buyers pushed price up but sellers forced it back, which is the shape of a shooting star. A long wick matters most when it lands at a support or resistance level that already means something.
What is a doji candle telling me?
A doji is a candle with almost no body, where the open and the close finish at nearly the same price. It reads as indecision, a session where buyers and sellers ended in balance. After a long trend a doji can warn that momentum is fading, but on its own it is only a pause, not a reversal signal. Wait for the next candle to confirm which way the deadlock breaks.
Which timeframe is best for reading candlesticks?
The daily chart is the cleanest place to learn, because each candle is a full day of trading and the signals are less noisy. The 4-hour is a good step down for more setups, and the 1-hour is useful only to fine-tune an entry the higher timeframe already set up. The 5-minute is mostly noise for a beginner. Start on the daily, master it, then drop down if you need faster reads.
Do candlestick charts work the same on crypto and Forex?
The candle rules are identical, but two things differ. Crypto exchanges report real traded volume, so a volume surge under a candle is a genuine tell, while Forex and gold platforms show only tick volume, which counts price updates and is far less reliable. Crypto also trades 24/7 and rarely gaps, whereas Forex and gold pause on the weekend and can gap on Monday. Read the candles the same way, but weigh volume differently.
How many candles do I need to make a decision?
Rarely just one. A single candle is one word, and it only means something inside the sentence around it. Most reliable reads come from a candle sitting at a clear trend or level, or from two or three candles together, which is what named patterns capture. Read the trend first, then the level, then the candle, and use the candle to confirm a story the chart is already telling.
What are the key candlestick terms to know?
Open is where the candle started and close is where it ended, and the body is the distance between them. High and low are the extremes, marked by the tips of the wicks, also called shadows. Bullish means the candle closed up and bearish means it closed down. A doji has almost no body, a hammer has a long lower wick, and a marubozu has almost no wick at all. Learn those and you can name most candles you meet.
🌍 Our recommended brokers


Reader Reviews
Be the first to review this — tell other traders what actually helped, or where it fell short.
Leave a Review

Momentum Trader & Technical Analyst
Trades momentum across crypto and forex since 2019, built around RSI, MACD, and volume. Turns discretionary setups into rule-based, systematic entries and validates them on data before they go live.