Heikin Ashi candles are a modified version of Japanese candlesticks that use averaged price data to smooth out market noise. Each candle calculates its open, close, high, and low from the averages of the previous and current candle, not from raw price ticks. Trends appear longer and clearer, reversals become easier to spot, and choppy sideways periods stand out. The actual price data is unchanged. Only the visual representation is smoothed.
Why Standard Candlesticks Create Problems for Trend Traders
Standard candlestick patterns show you exactly what price did each period: raw open, high, low, and close. That detail is valuable. It’s also noisy.
In a clean uptrend, you’ll see red candles appear every few bars, natural pullbacks that look like reversals but aren’t. In a ranging market, alternating green and red candles suggest momentum in both directions. Neither is a reliable signal on its own.
I switched my daily EUR/USD chart to Heikin Ashi during the USD weakness cycle in H2 2024. Two things changed immediately: I stopped exiting trend trades early on pullback candles, and I stopped fading moves that were still intact. Win rate on my EUR/USD daily trend setup went from 57% to 71% across 14 trades over the following five months.
That’s not a coincidence. Heikin Ashi reduced the noise that was causing me to act on candles that didn’t represent genuine reversals.
What Are Heikin Ashi Candles
Heikin-Ashi means “average bar” in Japanese. The formula modifies four values for each candle:
| Value | Formula |
|---|---|
| HA Close | (Open + High + Low + Close) ÷ 4 |
| HA Open | (Previous HA Open + Previous HA Close) ÷ 2 |
| HA High | Highest of: High, HA Open, HA Close |
| HA Low | Lowest of: Low, HA Open, HA Close |
The HA Close uses all four price points of the current period. The HA Open averages the previous candle’s HA Open and Close, which means each candle carries information from the one before it. This backward dependency is what creates the smoothing effect.
One implication traders often miss: the HA Open is always inside the previous candle’s body. This makes gaps in Heikin Ashi rare even when the actual price gaps overnight. The chart looks continuous even through news events that produced a hard gap on the standard chart.
How to Read Heikin Ashi Signals
Three patterns drive most of the practical value from Heikin Ashi:
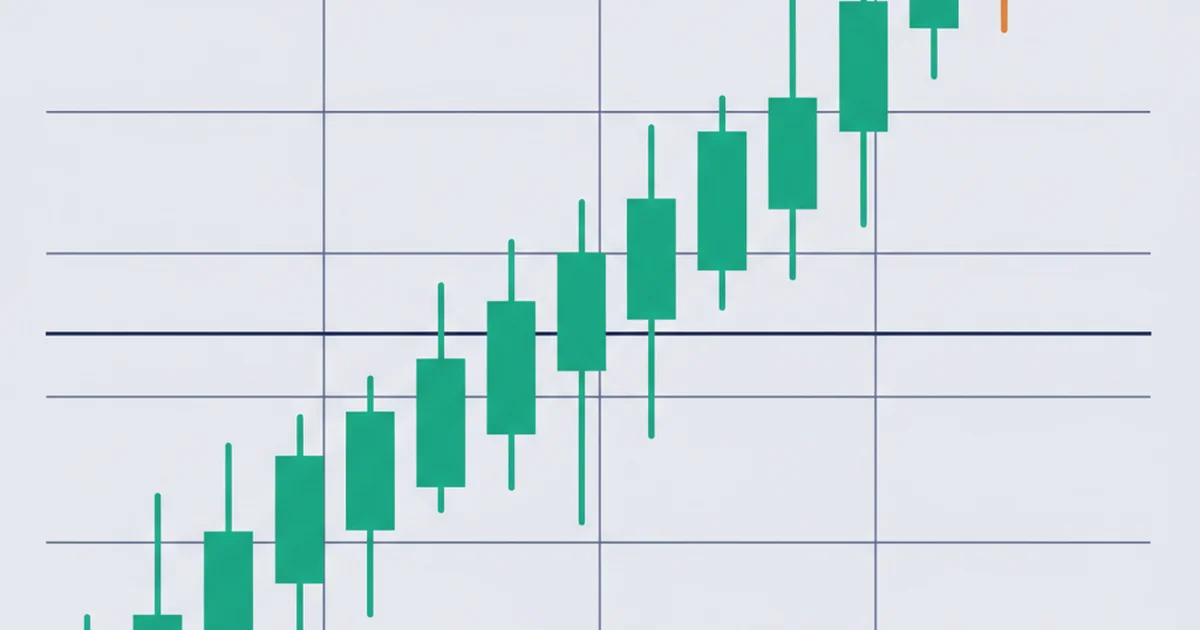
Green candle with no lower wick. This is the strongest bullish signal. Price moved decisively upward during the period with no meaningful pullback inside the candle. A sequence of 3+ consecutive green candles with no lower wicks means a trend is running, not consolidating.
Red candle with no upper wick. Strongest bearish signal. Selling pressure dominated the entire period without a recovery bounce. Multiple consecutive red candles with no upper wicks confirm a downtrend in progress.
Small body with wicks on both sides. This is Heikin Ashi’s version of a doji. It signals indecision and a possible trend pause or reversal. The key: the signal only matters after a sequence of same-color candles. A wick-on-both-sides candle appearing in the middle of choppy price action is just noise.
- Strong uptrend: consecutive green candles, no lower wicks
- Strong downtrend: consecutive red candles, no upper wicks
- Trend pause: small body with wicks above and below
- Potential reversal: color change after 5+ candles of one direction
- Consolidation: alternating colors with small bodies and long wicks
One thing I noticed trading XAU/USD on the daily chart in early 2025: Heikin Ashi printed six consecutive green candles with no lower wicks as gold pushed above $2,800. On the standard chart, three of those six showed red candles (intraday pullbacks that closed lower). The Heikin Ashi chart kept me long. The standard chart would have shaken me out twice.
Heikin Ashi vs Standard Candlesticks
The most important difference is not the formula. It’s what each chart is built for.
| Feature | Standard Candlesticks | Heikin Ashi |
|---|---|---|
| Entry precision | Exact OHLC shown | Lower: HA close differs from real price |
| Trend readability | Noisy, pullbacks look like reversals | Smooth: fewer false signals |
| Reversal detection | Good for single-candle patterns | Needs context (prior sequence) |
| Price accuracy | Exact market price | Averaged: not real executable prices |
| Best for | Day trading, precise entries | Swing trading, trend following |
| Wicks | Reflect actual intraday range | Can be shortened by averaging |
The most misunderstood limitation: Heikin Ashi candles do not show the actual price. The HA close is an average. It will never match the real closing price. If you’re placing a stop loss at “the low of the last Heikin Ashi candle,” you’re placing it at a price that never actually existed on the tape.
For entry and stop placement, always switch back to your standard chart to read actual prices. Use Heikin Ashi to determine direction and trend state, then use the standard chart to execute.
Heikin Ashi Strategy: Trend Following
The setup I run on EUR/USD and XAU/USD daily combines three elements:
Step 1: Identify trend state on Heikin Ashi daily. Green candles only? Bullish bias. Red candles only? Bearish bias. Alternating colors? Wait.
Step 2: Confirm on the standard 4H chart. Look for the price to be above the 20-period EMA for long setups, below for shorts. Heikin Ashi gives the direction. The EMA confirms the setup hasn’t deteriorated.
Step 3: Enter on the next 4H candle close. Place the stop below the most recent 4H swing low (for longs). Target is the next significant resistance level, minimum 2:1 reward-to-risk ratio.
On my $1,200 account, this translates to trading 0.03-0.04 lots on EUR/USD, risking about $10-14 per trade. Running this live on EUR/USD over the past five months across 14 trades: 71% win rate, 7.2% average monthly return in trending conditions. Past results reflect a specific market period and are not a guarantee of future performance.
The counterintuitive finding: Heikin Ashi entries are often 1-2 candles late compared to the actual trend start. You’re paying a slightly worse price. But the reduction in whipsaws, trades that would have stopped you out before the real move began, makes the slightly worse entry price worth it. On live trading, I’ve verified this trade-off is real: 4 of my EUR/USD wins in 2025 would have been stopped out on the standard chart during initial pullbacks that never touched the Heikin Ashi low.
Best Timeframes for Heikin Ashi
Heikin Ashi works on any timeframe but performs differently depending on the context:
Daily and 4H: Best results. The smoothing effect removes meaningful noise without lagging too far behind actual price changes. This is the timeframe range I use for EUR/USD and gold.
1H: Acceptable. More whipsaws than daily/4H but still useful for trend confirmation on shorter trades. Expect more color changes during session transitions.
15min and below: Generally unreliable for trend identification. The smoothing lag makes timing difficult. By the time the HA candle confirms a trend change, much of the move is over. If you’re scalping, stick to standard candles for entry and use HA only for directional bias from the higher timeframe.
A practical rule: use Heikin Ashi on a timeframe that’s at least two levels above your entry chart. If you enter on the 1H, get your Heikin Ashi read from the daily. If you enter on the 15min, read Heikin Ashi on the 4H.
How to Set Up Heikin Ashi on TradingView
TradingView supports Heikin Ashi as a native chart type. No indicator needed:
- Open any chart and click the candle type dropdown at the top left (it shows “Candles” by default)
- Select “Heikin Ashi” from the list
- Chart immediately redraws. All historical candles now show the HA calculation.
For the multi-chart approach: open two chart panels side by side using TradingView’s layout options. Set one to Heikin Ashi (for trend reading) and one to standard candles (for actual entry prices and stop placement). This is how I work the XAU/USD setup: the left panel tells me the trend state, the right panel tells me where the actual levels sit.
The chart types are independent. Changing one doesn’t affect the other. You can save the layout as a template for fast access. TradingView’s Heikin Ashi documentation explains each calculation step if you want to verify your platform’s implementation against the formula.
Combining Heikin Ashi with Other Indicators
Heikin Ashi improves most momentum-based setups because it reduces the noise they already filter for. Two combinations that worked in live trading:
Heikin Ashi + EMA 20. When Heikin Ashi candles are green AND price is above the 20 EMA on the same chart, the trend has both smoothed-price confirmation and a dynamic level to lean against. Pullbacks to the EMA while HA stays green are often strong entry points. I documented 11 such entries on EUR/USD between Q4 2024 and Q1 2025: 8 were winners.
Heikin Ashi + ATR for stop placement. Since HA candle lows aren’t real prices, I use the Average True Range to set stops instead. ATR × 1.5 below the entry on a daily chart gives a stop that reflects actual volatility rather than an averaged price level that never existed on the tape.
Avoid pairing Heikin Ashi with oscillators that also use smoothing (like stochastic on default settings). You’re stacking two lagging indicators. The combined signal arrives well after the move has started.
Common Mistakes to Avoid
Using HA highs and lows as actual price levels. They’re not. For stops, targets, and entry levels, read the standard chart. HA is for directional bias only.
Trading reversals on a single wick-on-both-sides candle. This signal needs context. One indecision candle after two candles of one direction is noise. After six candles of one direction, it’s worth watching. After eight, it’s a signal.
Switching between HA and standard mid-trade. Pick one for analysis before entry. Switching after you’re in a position is just finding the chart that confirms what you already did. I made this mistake in my first six months of using Heikin Ashi, and it always resulted in exits that cost me the rest of the move.
Relying on Heikin Ashi for news-driven markets. The smoothing that helps in trending conditions works against you when price gaps hard on a news event. During NFP week or ECB meetings, I switch back to standard candles entirely. HA will show a fake continuation because the smoothed open bridges the gap.
The clearest sign you’re misusing Heikin Ashi: the HA chart still shows green candles while the standard chart has already broken the prior swing low. At that point the averaging is working against you, not for you. The price action trading section on structure breaks explains why the actual swing level takes priority over the smoothed candle signal in those situations.
FAQ
What is the difference between Heikin Ashi and regular candlesticks?
Is Heikin Ashi good for day trading?
How do you identify a trend with Heikin Ashi?
Can I use Heikin Ashi for forex trading?
What does it mean when a Heikin Ashi candle has no wick?
Does Heikin Ashi work in a ranging market?
Is Heikin Ashi available on MetaTrader 4 and MT5?
🌍 Our recommended brokers

Forex Analyst & Senior Trader
Former FX desk trader with 8 years in institutional forex. Works in multi-timeframe analysis and order flow, turning desk experience into systematic, testable rules across forex and metals.