
What a liquidity pool actually is
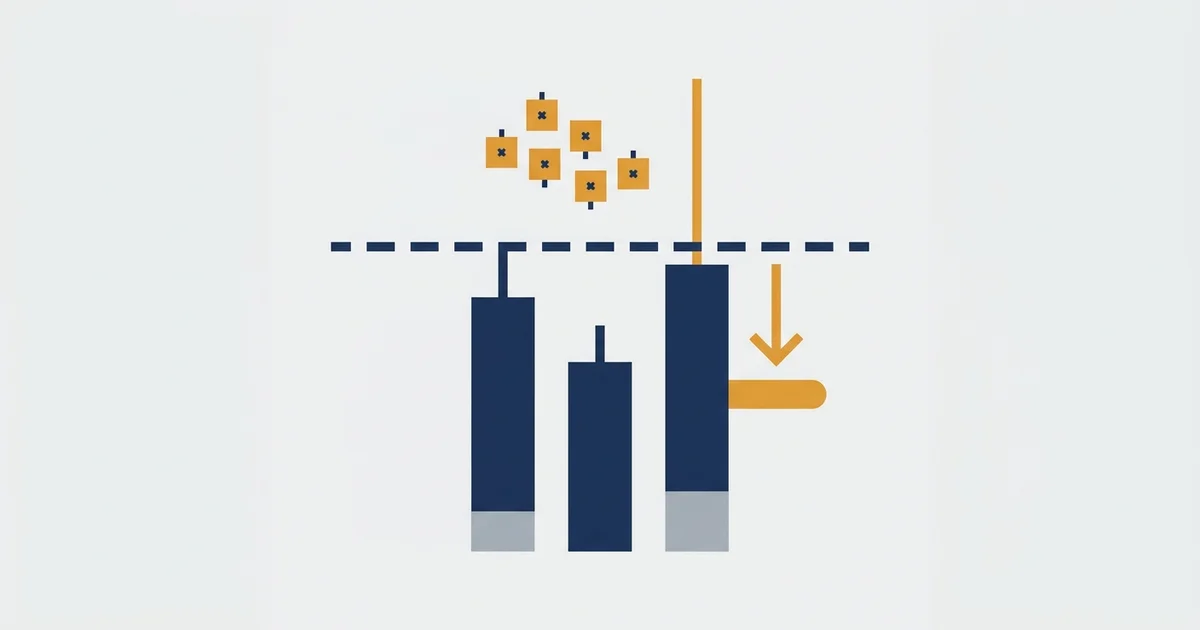
Every stop-loss is a pending market order waiting to fire. When lots of traders park their stops at the same obvious level, those orders pool together into a single deep target.
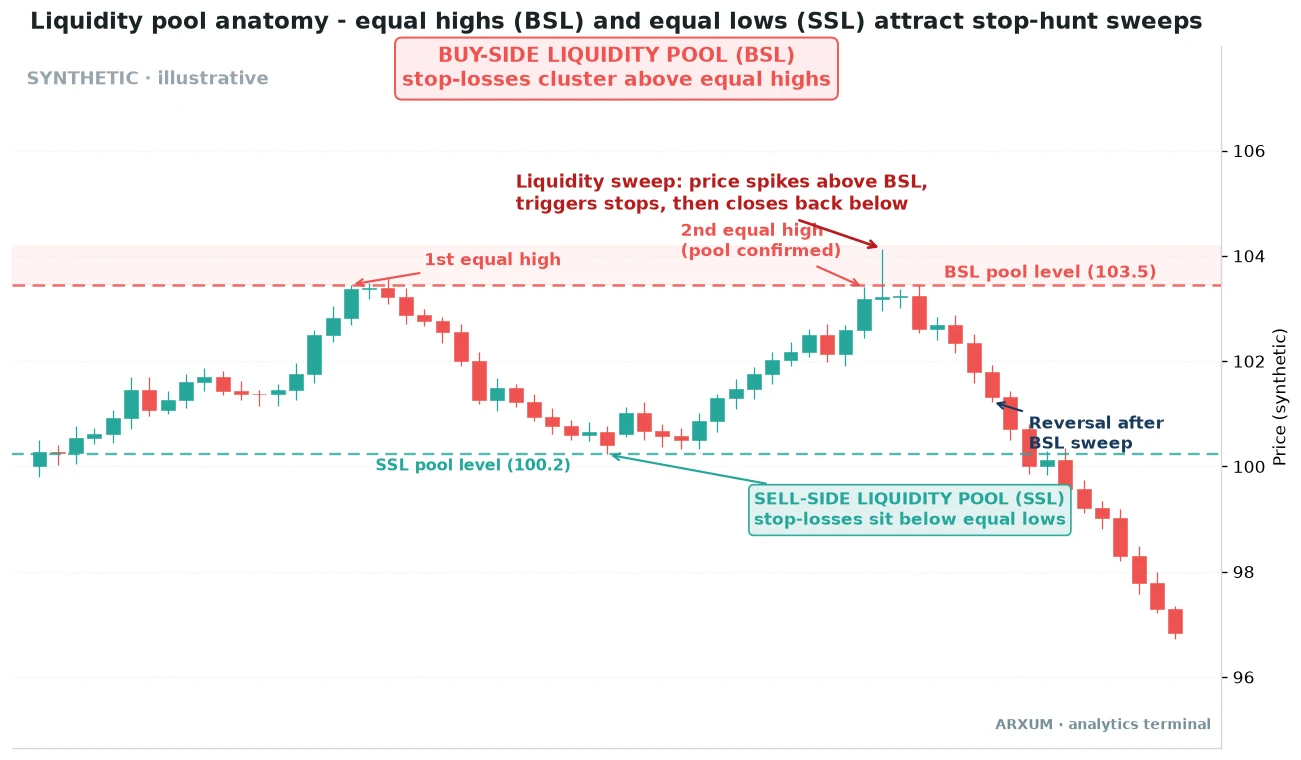
What the diagram is pointing at:
- Buy-side liquidity (BSL): buy stops parked above a swing high. Short-sellers put stops there, and breakout buyers put entry orders there too. Both fire on a move up.
- Sell-side liquidity (SSL): sell stops parked below a swing low. Long holders and breakout sellers sit there. Both fire on a move down.
- Equal highs / equal lows: two or more highs (or lows) at almost the same price. The flat shelf is a magnet, because the stops stack up in one tight band, and it doubles as obvious support or resistance.
- The sweep: price pierces the pool, grabs the orders, then closes back inside the range. It looks like a breakout that immediately failed.
- The reversal: with the pool emptied, the fuel for the fake move is gone, so price often turns and travels the other way.
A pool is not a guarantee. It is a high-probability target, not a signal on its own.
The read only matters once price actually sweeps the level and rejects it. Until then it is just a line on the chart, and lines break as often as they hold.
Where these pools form
| Location | Pool type | Why stops gather |
| Above equal highs | Buy-side | Short stops plus breakout buys |
| Below equal lows | Sell-side | Long stops plus breakout sells |
| Prior day high / low | Either side | Obvious daily reference |
| Session high / low | Either side | Asian range is a classic |
| Round numbers | Either side | 1.1000, gold at 3500 |
| Old swing / range edge | Either side | Everyone sees the same line |
The rule of thumb: the more obvious a level looks, the more stops sit there, and the fatter the pool. Your own stop is part of someone else’s target.
Buy-side liquidity: the pool above the highs
When price makes two highs at nearly the same price, a shelf of buy stops builds above them. That is the buy-side pool.
Here it is on spot gold (XAU/USD) on the daily chart.
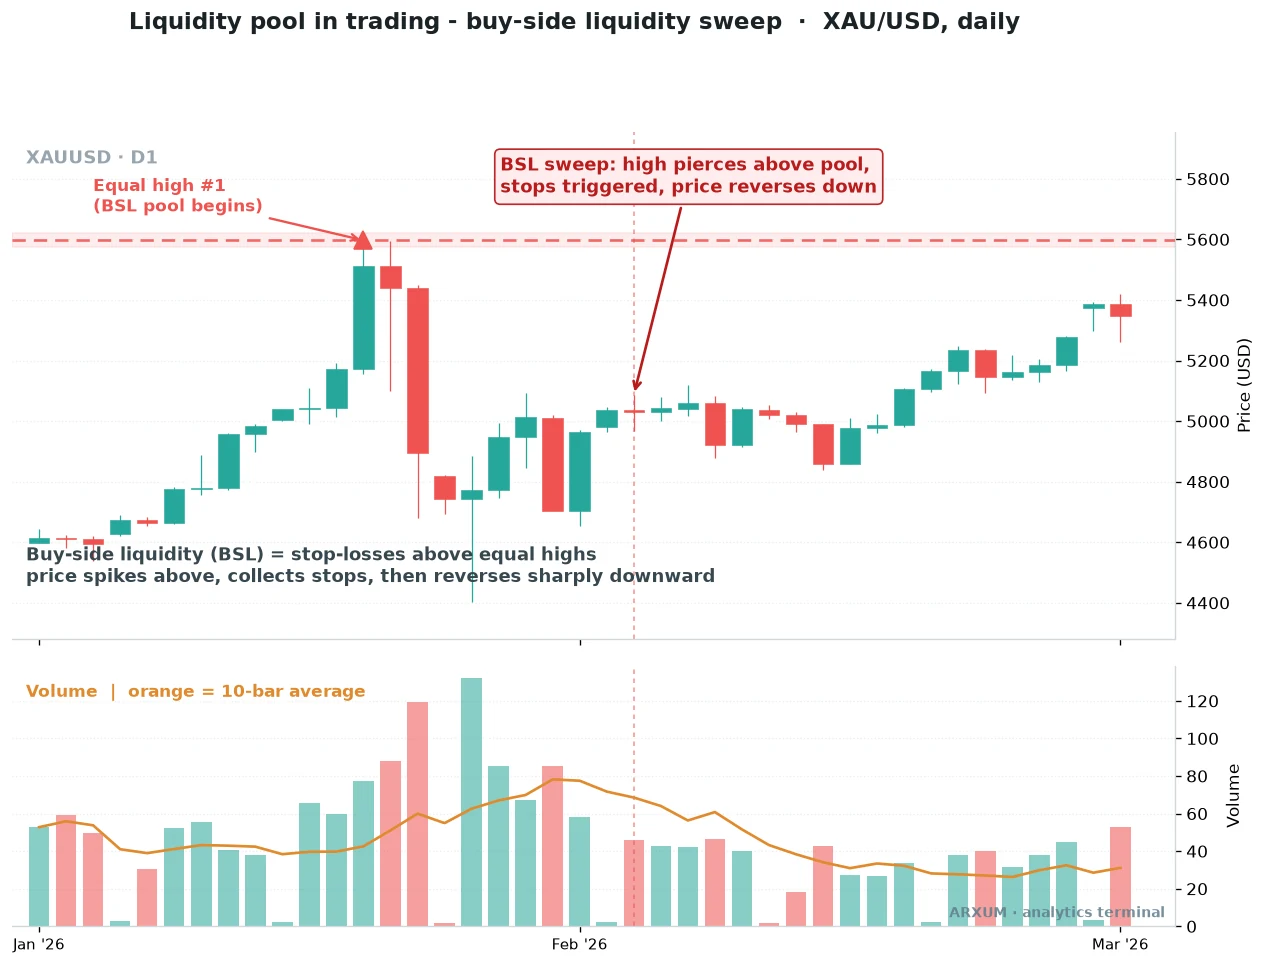
How a buy-side sweep looks on the chart:
- Price rallies into the equal high and pokes a fraction above the pool level.
- The candle that pierces often closes back below the line, leaving an upper wick.
- Volume tends to spike on the sweep bar, because the resting stops all fire at once.
- After the grab, price rolls over instead of continuing up.
The key tell is the close, not the poke. A wick through the pool that closes back inside says the breakout failed and the stops were the whole point of the move.
| Role | How to use it | Best read |
| Target | Expect price to reach for the pool | Above the nearest equal highs |
| Reversal cue | Wait for the close back below | Sweep bar with an upper wick |
| Short context | Look for sells after the grab | Below-the-line close, D1 or H4 |
| Stop placement | Do not park longs right under it | Give room beyond the shelf |
A swept high often pairs with a supply zone or an order block just above it, and that overlap is where the cleanest rejections show up.
Sell-side liquidity: the pool below the lows
The mirror image sits under the market. Build a shelf of sell stops below equal lows and you have the sell-side pool.
This one is on EUR/USD on the 4-hour chart.
| What you see | Buy-side pool | Sell-side pool |
| Sits | Above equal highs | Below equal lows |
| Stops there | Short stops, breakout buys | Long stops, breakout sells |
| Sweep looks like | Spike up, close back down | Dip down, close back up |
| Reversal after | Often turns lower | Often turns higher |
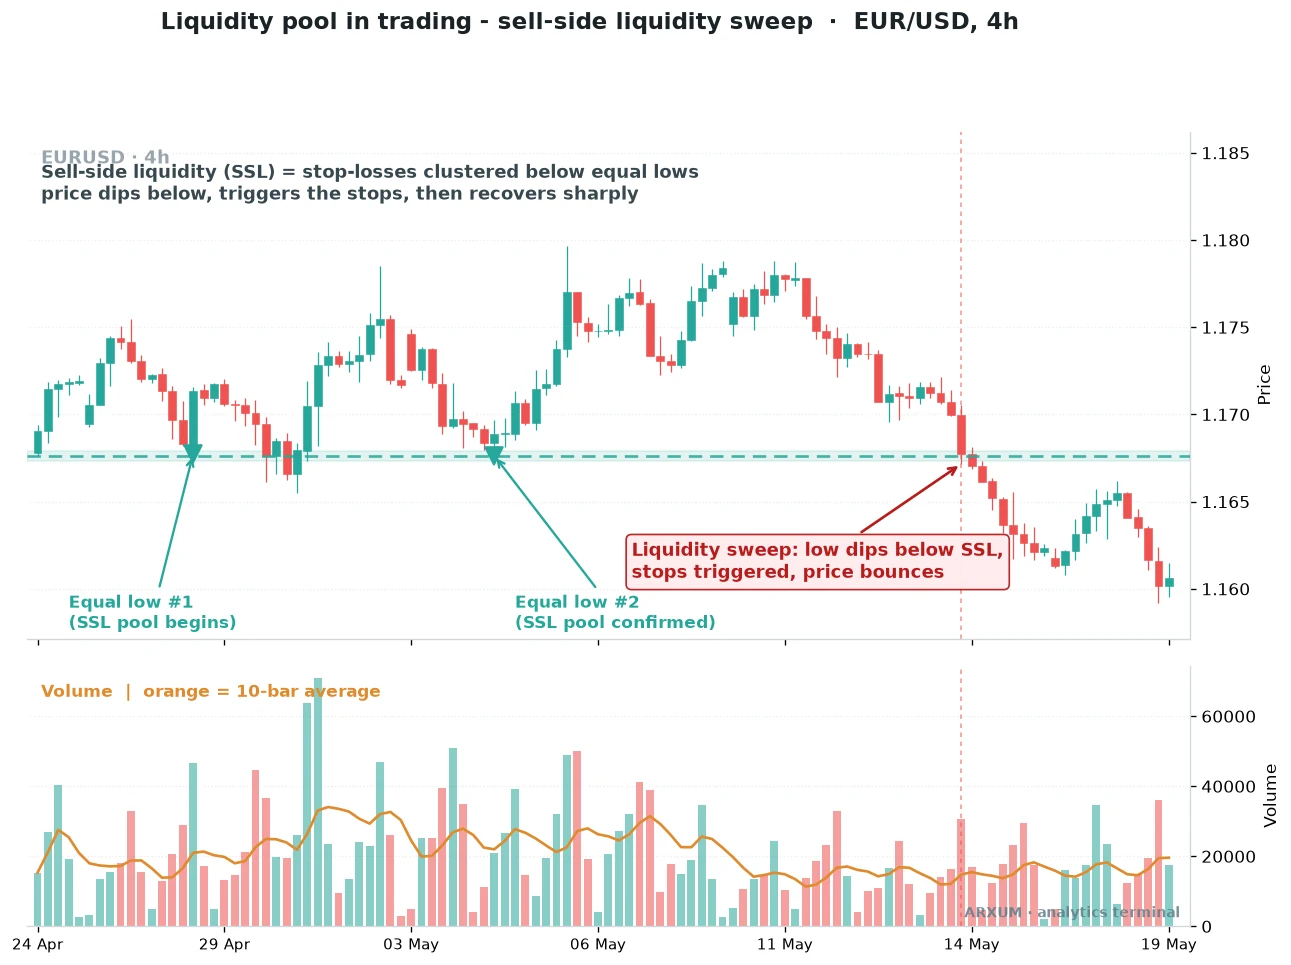
How a sell-side sweep reads:
- Two lows print at almost the same price, drawing the pool as a flat floor.
- A later candle dips below the floor and then closes back above it, leaving a lower wick.
- Long holders get stopped out on the dip, handing their orders to whoever wanted to buy.
- With the sellers flushed, price recovers off the low.
Sweep, not breakdown: a genuine breakdown holds below the pool and keeps going. A sweep pokes under, fails to hold, and reclaims the level within a bar or two.
The reclaim is the difference between a trap and a trend.
| Role | How to use it | Best read |
| Target | Expect a reach for the lows | Below the nearest equal lows |
| Reversal cue | Wait for the close back above | Dip bar with a lower wick |
| Long context | Look for buys after the flush | Reclaim on H4 or H1 |
| Stop placement | Do not stack shorts under it | Keep stops off the obvious floor |
The roles a pool plays, not just entries
A liquidity pool is more than a place to fade a spike. It quietly shapes where a move is headed, where the risk sits, and which breakouts to trust.
Read it across roles rather than as a single entry trigger.
| Role | How you use it | What to watch |
| Directional target | Where price is drawn next | Nearest untapped pool |
| Reversal entry | Fade the sweep after the reclaim | Close back inside the range |
| Trend filter | Trust breaks that clear a pool | Hold beyond the level, not a wick |
| Stop-loss guide | Keep your stop out of the crowd | Beyond the obvious shelf |
| Confluence | Stack it with a zone or gap | Pool plus order block or FVG |
Two of those roles matter most for a beginner:
- Pool as a magnet: expect price to reach for it, so you stop being surprised when a spike runs your stop and turns.
- Stop as bait: place your own stop where the crowd is not, so it does not become the fuel for the next sweep.
A fair value gap or a fresh supply zone next to the swept pool is the confluence that turns a guess into a plan.
Which pool to watch, by timeframe
| Timeframe | Pool that matters | Typical use |
| Daily (D1) | Weekly and prior-day extremes | Swing bias, big targets |
| 4-hour (H4) | Recent equal highs and lows | Swing entries after a sweep |
| 1-hour (H1) | Session and intraday shelves | Day-trade reversals |
| 15-minute (M15) | Asian range, opening highs/lows | Scalps, refined timing |
The higher timeframe sets the target, the lower timeframe times the turn.
A common workflow: mark the daily pool as the destination, then drop to H1 or M15 to catch the sweep and reclaim. It is the same logic a market structure trader uses to read where a leg wants to run.
Reading a sweep, step by step
You do not need to guess. Work the pool as a checklist and let price confirm before you act.
- Mark the pools. Draw a line across the nearest equal highs and equal lows on your trading timeframe.
- Add the daily levels. Add the prior-day high and low, plus any obvious round number close by.
- Pick the likely target. In an uptrend, price usually reaches for the buy-side pool above. In a downtrend, the sell-side pool below.
- Wait for the poke. Let price actually pierce the level. No pierce, no sweep.
- Watch the close. A close back inside the range with a wick beyond the line is your sweep signal.
- Look for the reclaim. Price holding the correct side of the level within a bar or two confirms the trap.
- Check confluence. A supply or demand zone, an order block, or a gap next to the pool raises the odds.
Skip any step and you are trading a hunch. The value is in waiting for the sweep to prove itself, not front-running it.
Session pools: the daily reference points
Intraday traders lean on a handful of levels that reset each day. These are the pools the market raids most often.
| Reference | When it matters | Common behaviour |
| Prior-day high / low | All day | Raided near the cash open |
| Asian range high / low | London open | Swept as London builds direction |
| London high / low | New York open | Reversal or continuation cue |
| Weekly high / low | Swing trades | Big draw for daily moves |
The Asian range on gold and forex is the classic starter pool: it is tight, obvious, and often swept in the first hour of London before the real move.
The same idea across markets
Liquidity pools are not a gold or a forex quirk. Any market with a visible order book of stops behaves the same way, so the concept ports cleanly.
- Gold (XAU/USD): clean equal highs and lows, strong daily sweeps around news and the London or New York open.
- Major FX (EUR/USD, GBP/USD): deep, obvious session highs and lows, with round numbers acting as fat pools.
- Indices (US500, NAS100): prior-day high and low get raided almost daily around the cash open.
- Crypto (BTC, ETH): liquidations pile up at obvious levels, so sweeps can be violent, and weekend thin books exaggerate them.
- Commodities (silver, oil): the same prior-day and session pools drive the moves, with data releases doing most of the sweeping.
The instrument changes the character of the sweep, not the mechanics. Wherever traders cluster their stops, price has a reason to go and take them.
Sweep or real breakout?
The single hardest call is telling a fake sweep from a genuine break. Both start the same way, with price pushing past a pool.
The difference shows up in what happens next.
| Signal | Liquidity sweep | Real breakout |
| The close | Back inside the range | Beyond the level |
| The candle | Long wick past the pool | Body pushes through |
| Follow-through | Reclaims quickly | Holds and extends |
| What to do | Fade back into the range | Trade the continuation |
When you are unsure, do nothing. A sweep that is really a breakout will keep going without you, and a breakout that is really a sweep will reclaim and hand you a cleaner entry.
Patience is the edge here.
Stack the pool with context
A pool on its own is a hint. A pool lined up with other evidence is a plan.
This is where the wider smart money toolkit earns its keep.
| Confluence | Why it helps |
| Order block | Supply or demand right at the pool |
| Fair value gap | An imbalance price wants to fill |
| Higher-timeframe level | D1 or W1 line under the sweep |
| Session timing | Sweep lands at London or NY open |
Two or more of these at the same price is the setup worth waiting for. One alone is a reason to watch, not to act.
Common mistakes to avoid
- Trading the poke, not the close. A wick through a pool means nothing until price closes back inside. Wait for the reclaim.
- Assuming every sweep reverses. Sometimes the pool break is real and the trend runs on. The close and the follow-through decide.
- Parking your stop at the obvious level. The round number and the equal high are exactly where the crowd sits. Give the level room.
- Forcing a pool where there is none. You need a genuine shelf of equal highs or lows. A single random spike is not a pool.
- Ignoring context. A sweep into a fresh supply or demand zone is worth far more than a sweep in the middle of nowhere.
- Chasing the spike. Buying or selling into the sweep itself, before the reclaim, is how you end up as the liquidity someone else took.
What to remember
- What works: map the obvious pools above equal highs and below equal lows, expect price to reach for them, and only act once the sweep closes back inside and reclaims the level.
- What protects you: keep your own stop off the crowded shelf, and treat a sweep as context, not a standalone signal.
- What travels: the same buy-side and sell-side logic reads the same on gold, forex, indices and crypto. Learn it once, use it everywhere.
Key terms
- Liquidity pool: a cluster of resting stop orders at an obvious level, above equal highs or below equal lows.
- Buy-side liquidity (BSL): buy stops sitting above a high, triggered by a move up.
- Sell-side liquidity (SSL): sell stops sitting below a low, triggered by a move down.
- Equal highs / equal lows: two or more highs or lows at nearly the same price, forming the shelf where stops stack.
- Liquidity sweep: price pierces the pool, triggers the stops, then closes back inside the range.
- Stop hunt: the everyday name for a sweep, the move that runs the crowd’s stops before reversing.
- Reclaim: price closing back on the correct side of a swept level, the cue that the breakout failed.
FAQ
What is a liquidity pool in trading, in plain terms?
It is a spot on the chart where lots of traders have placed their stop-losses, usually just above a run of equal highs or just below a run of equal lows. Because every stop is a waiting order, those stops pool together into a deep target. Bigger players like to push price into that pool to trigger the orders, which lets them fill their own size, and price often reverses afterwards.
What is the difference between buy-side and sell-side liquidity?
Buy-side liquidity sits above a high. It is made of buy stops, from short-sellers protecting their trades and breakout buyers, so a move up triggers it. Sell-side liquidity sits below a low. It is made of sell stops, from long holders and breakout sellers, so a move down triggers it. Price often reaches up for buy-side or down for sell-side, then turns.
How do liquidity pools work?
Traders tend to place stops at the same obvious levels, like equal highs, equal lows and round numbers. That stacks a lot of pending orders in a narrow band. Large participants who need to fill big positions get the best fills where that liquidity is deepest, so price is often drawn into the pool, grabs the orders, and then moves the other way once the fuel is gone.
What is a liquidity sweep or stop hunt?
A sweep is when price pierces a pool, triggers the stops resting there, then closes back inside the previous range. It looks like a breakout that failed instantly. Stop hunt is just the popular name for the same move. The important part is the close: a wick through the level that closes back inside signals a sweep, not a real break.
How do I spot a liquidity pool on a chart?
Look for two or more highs at almost the same price, or two or more lows at almost the same price. That flat shelf is where the stops gather. Prior-day highs and lows, session extremes and round numbers are the most reliable spots. The more obvious the level looks to you, the more stops are likely sitting just beyond it.
Does a sweep always reverse the market?
No. Sometimes the break is genuine and the trend keeps running through the level. The way to tell them apart is the close and the follow-through. A sweep pokes past the pool and reclaims the level quickly, while a real breakout holds beyond it and continues. Never assume a reversal before price closes back inside.
Where should I put my stop so it does not get swept?
Keep it away from the obvious shelf. If everyone can see the equal low or the round number, that is exactly where the pool sits, so a stop parked right there is easy to run. Give the level a bit of room, or place your stop beyond a structure point rather than on the crowded line. Pair it with a sensible risk to reward so the extra room still fits your plan.
Do liquidity pools work on forex and crypto or only stocks?
They work anywhere traders cluster their stops, which is every liquid market. Gold and major forex pairs show clean equal highs and lows and strong session sweeps. Indices raid the prior-day high and low around the cash open. Crypto piles up liquidations at obvious levels, so its sweeps can be sharper. The mechanics are the same, only the character of the move changes.
What is the best timeframe to trade liquidity pools?
There is no single best one, because the idea scales. Swing traders mark pools on the daily and 4-hour charts and use them as targets. Day traders work session and prior-day levels on the 1-hour and 15-minute. A common approach is to set the bias from a higher timeframe pool, then drop to a lower one to time the sweep and the reclaim.
Is a trading liquidity pool the same as a DeFi or crypto liquidity pool?
No, they share a name but mean different things. In price action and smart money trading, a liquidity pool is a cluster of stop orders at an obvious chart level, which is what this guide covers. In decentralised finance, a liquidity pool is a smart contract holding two tokens so people can swap them. If you are reading a chart for entries, you want the trading meaning here.
Real-time trade setups with entry, stop loss and take profit. Daily market analysis. No subscription, no complicated theory.
🌍 Our recommended brokers


Reader Reviews
Be the first to review this — tell other traders what actually helped, or where it fell short.
Leave a Review

Forex Analyst & Senior Trader
Former FX desk trader with 8 years in institutional forex. Works in multi-timeframe analysis and order flow, turning desk experience into systematic, testable rules across forex and metals.
