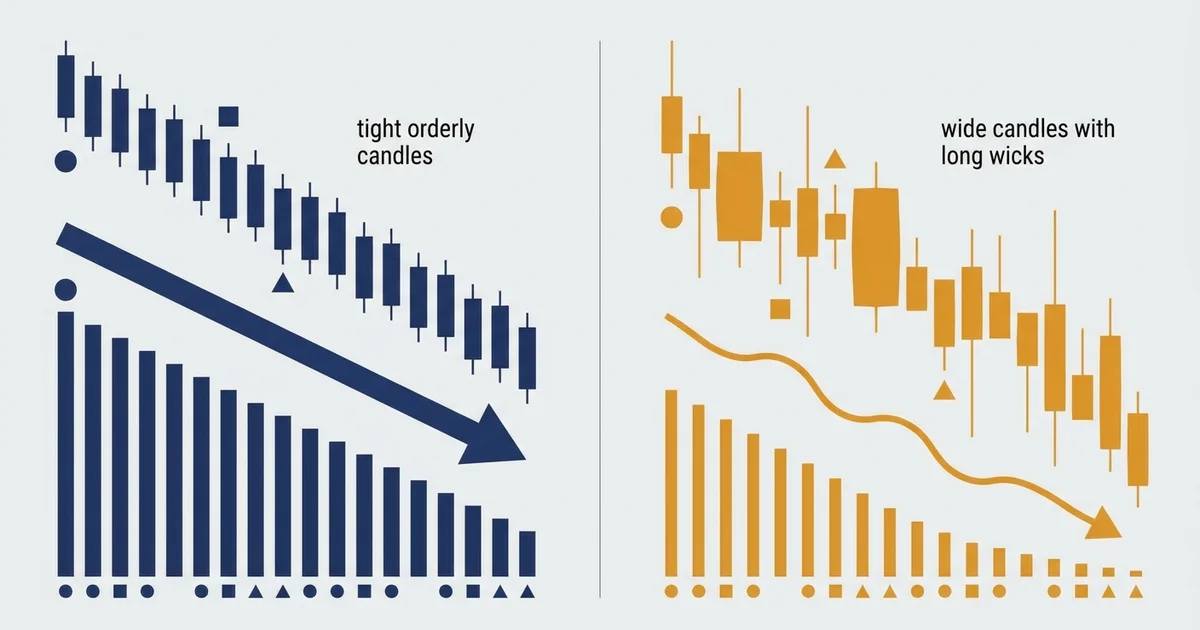

What liquidity in trading actually is
Liquidity is the market’s ability to absorb your order without a fuss. High liquidity means you get in and out at the price you see, low liquidity means you fight for your fill.
The easiest way to grasp it is to put a liquid market and a thin one side by side.
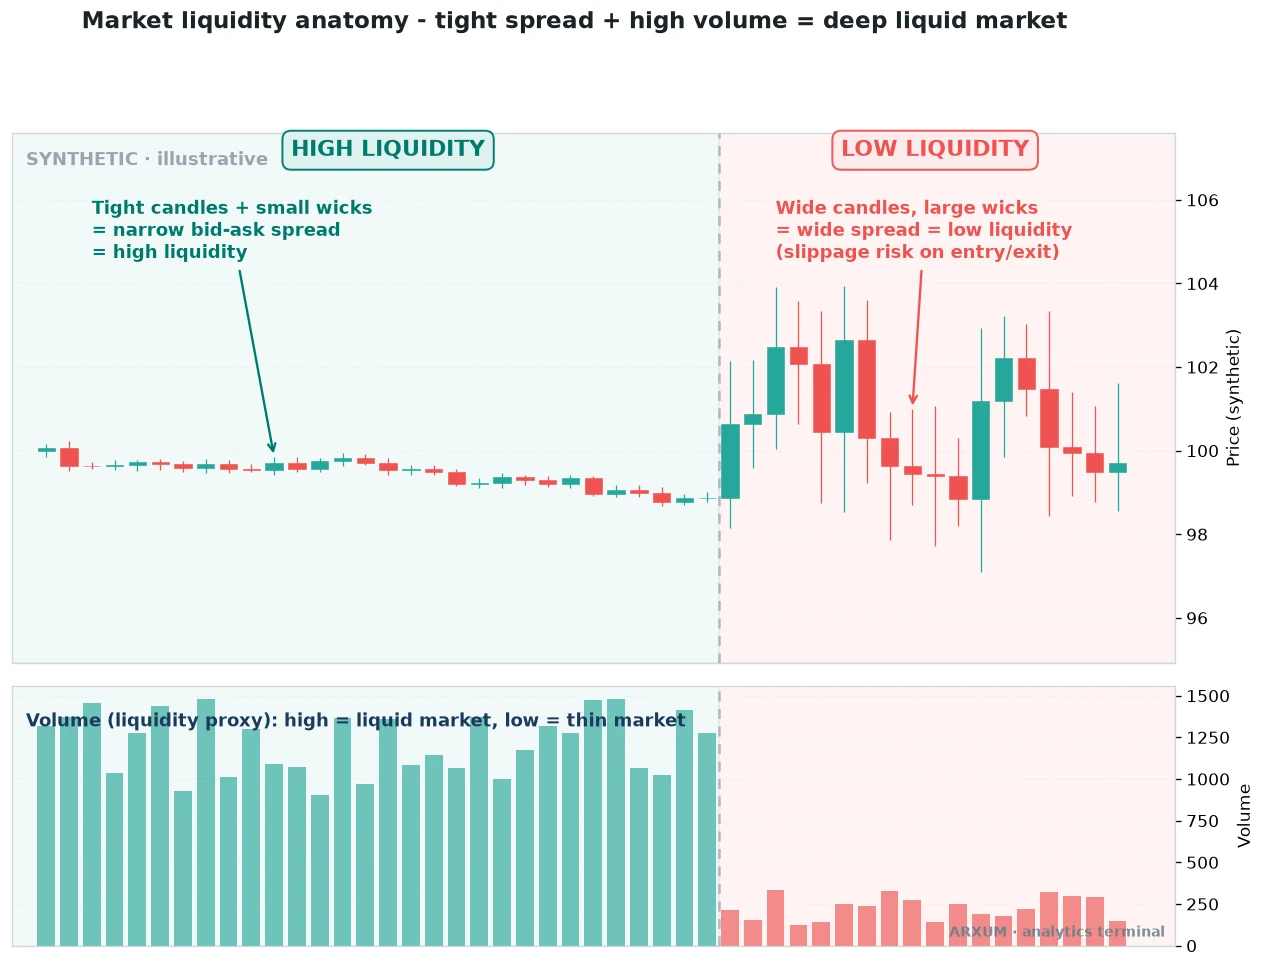
The two halves of that chart are the whole idea in one picture. Read the candles on top and the volume bars underneath together.
- Left side, high liquidity: candles are small and orderly, wicks are short, and the volume bars stay tall. Plenty of buyers and sellers, so price moves in calm steps.
- Right side, low liquidity: candles balloon, wicks stretch, and the volume bars shrink. Few participants, so each order swings price further than it should.
- The bid-ask spread is the gap between the best buy price and the best sell price. It is tight on the left and wide on the right.
- Volume is the proxy for how many hands are in the market. Tall bars mean a deep, liquid market, short bars mean a thin one.
Here is the same split as a plain contrast.
| Feature | Liquid market | Thin market |
|---|---|---|
| Bid-ask spread | Tight | Wide |
| Order fill | Fast, at your price | Slow, worse price |
| Volume | High | Low |
| Price moves | Smooth steps | Jumpy, gappy |
| Slippage | Minimal | Costly |
The one-line read: liquidity is the difference between the price you click and the price you actually get.
How to read liquidity in real time: three gauges
You cannot see the full order book on most retail platforms, but you do not need to. Three readings on a normal chart tell you almost everything.
Volume, the spread, and price jumpiness each read the same depth from a different angle.
Gauge one: volume
Volume is the clearest live gauge of liquidity. A spike means more buyers and sellers are active, a collapse means the market has thinned out.
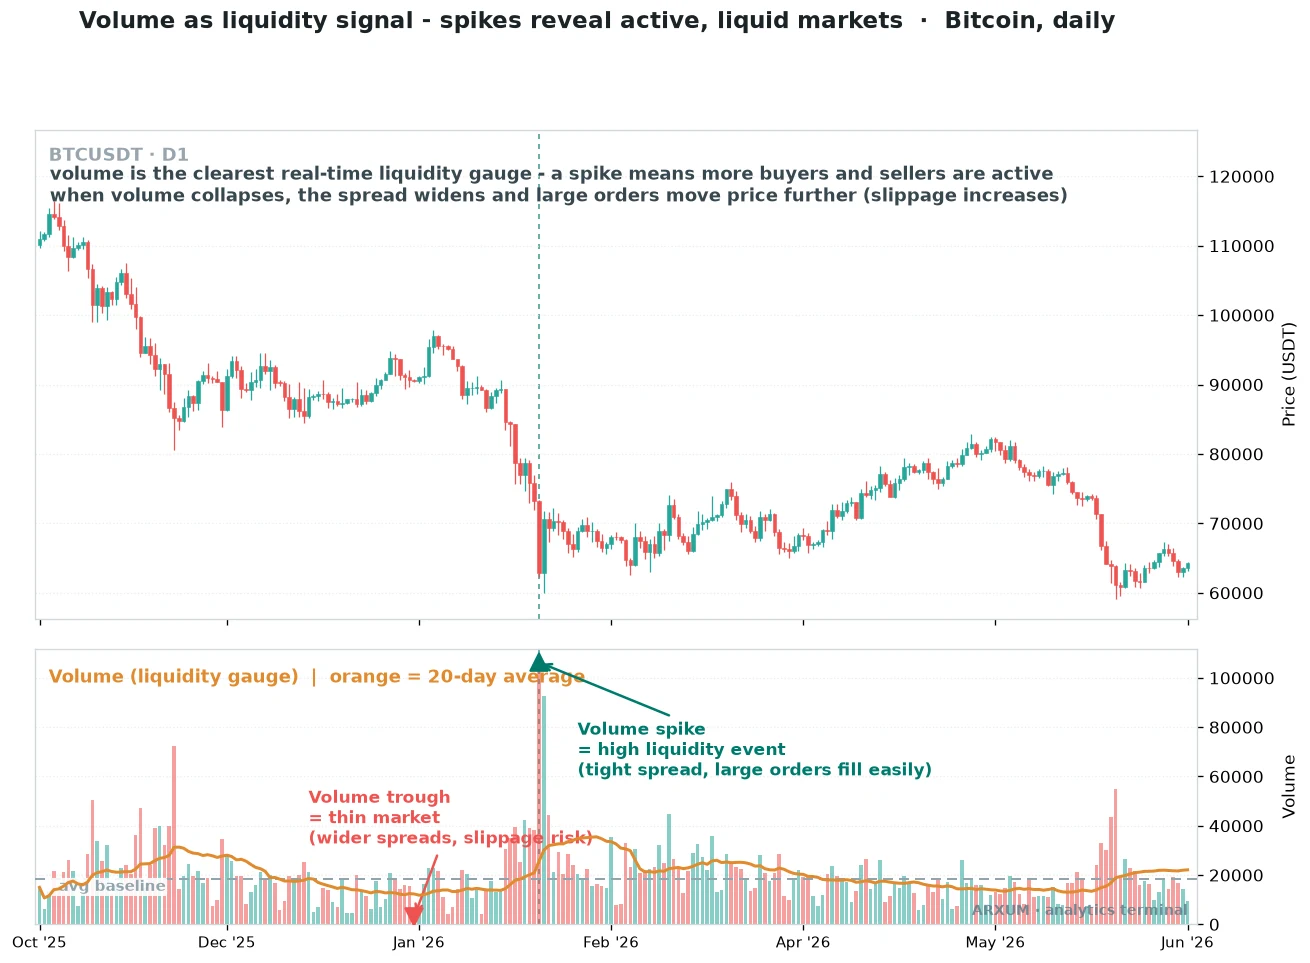
Read the bottom panel against the orange line, which is just the 20-day average volume.
- A volume spike above the average means the market is busy and deep. Big orders fill without much fuss.
- A volume trough below the average means the market has gone quiet. Spreads widen and your stop can get a worse fill.
- The 20-day average is the baseline, so you are comparing today’s activity to a normal month.
- The read: trade the busy hours, treat the dead ones with caution. Thin volume is where nasty fills happen.
Volume also confirms whether a move has real participation behind it, which is why a volume line like on-balance volume sits under so many charts.
| Role | How you use it | Best read |
|---|---|---|
| Depth check | Volume above its 20-day average = deep, liquid market | Any TF, any asset |
| Timing filter | Size up in high volume, size down or wait in a trough | H1 to D1 |
| Warning | Falling volume into a level warns of a thin, gappy move | H4 to D1 |
| Session read | Volume rises into session overlaps, fades in quiet hours | Intraday Forex |
Gauge two: the spread, read through ATR
The bid-ask spread is liquidity you can see directly, but most charts do not plot it. A good stand-in is the Average True Range, or ATR, which measures how far price travels each bar.
Low ATR means small, tight bars, which usually lines up with a tight spread and deep book. Rising ATR means the opposite.
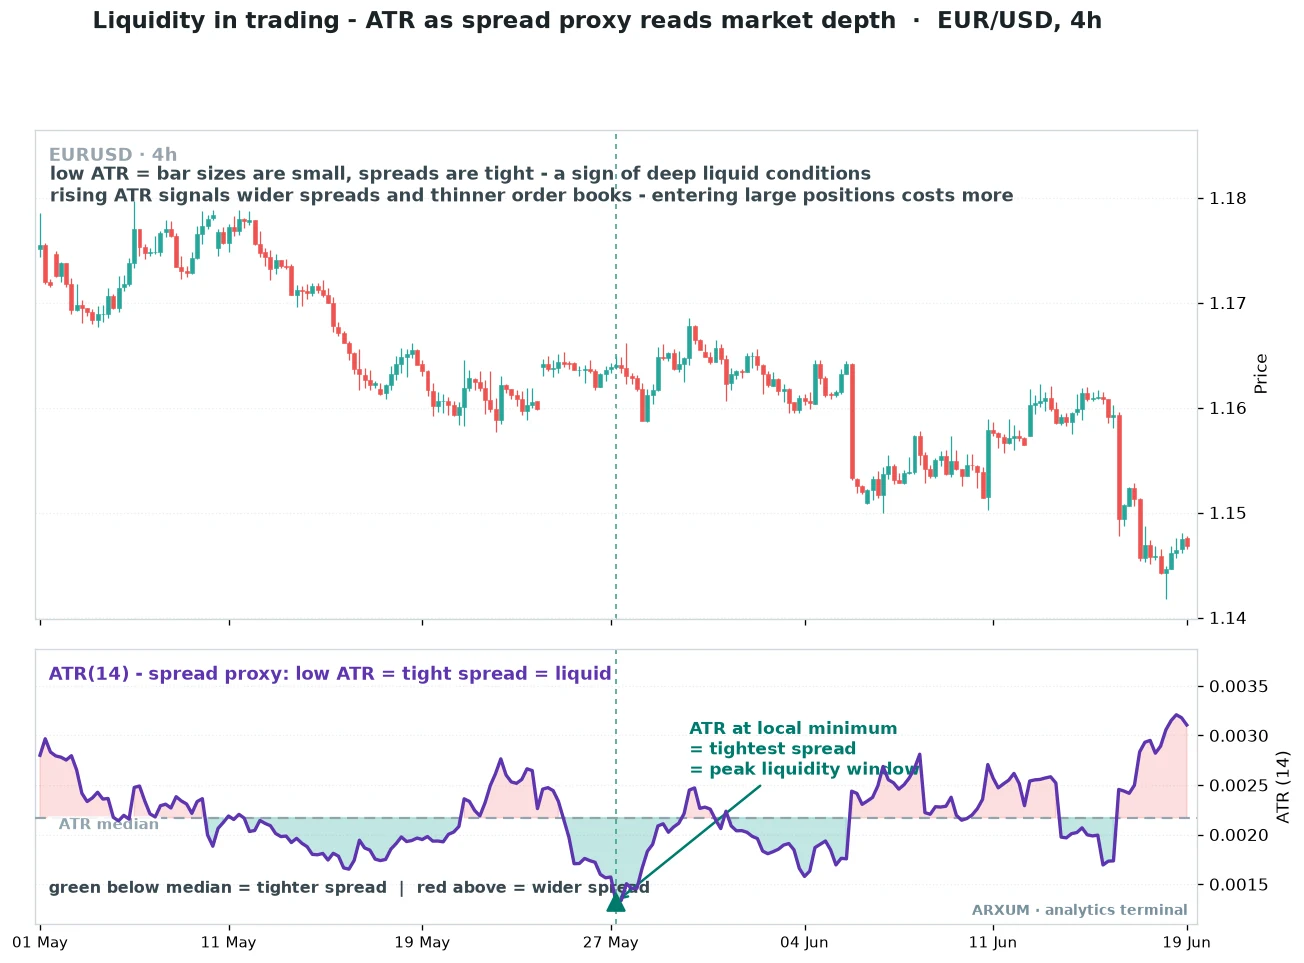
ATR here is a 14-bar reading of typical range, plotted in the lower panel.
- Low ATR, green below the median line: bars are small and the spread is tight. This is the deep, liquid state you want for large orders.
- Rising ATR, red above the median: bars stretch, the spread widens, and the order book thins out. Big positions cost more to enter.
- The ATR local minimum marked on the chart is the calmest, most liquid window in the sample.
- The read: tight range tends to mean cheap execution, expanding range tends to mean you pay up. For the indicator itself, see the ATR guide.
| Role | How you use it | Best read |
|---|---|---|
| Cost check | Falling ATR = tighter spread = cheaper entry and exit | H1 to D1, Forex and gold |
| Direct spread | Watch the live bid-ask on your platform before a big order | Any asset, at order time |
| Avoid | Skip large orders when ATR is spiking into news | Intraday, all markets |
| Filter | Prefer calm, low-ATR windows to add size | H4, Forex majors |
Gauge three: the bid-ask spread and depth, direct
When your platform shows a live quote and a depth-of-market ladder, you are reading liquidity at the source. No proxy needed.
The two numbers that matter are the spread and how much size sits near the top of the book.
- The spread in pips: a pip is the standard small price step in Forex, the fourth decimal on most pairs. EUR/USD might quote a 0.2 pip spread, an exotic pair 15 pips. Wider spread, thinner market.
- Depth near the current price: a lot of resting size close to where price trades now means the book can absorb your order.
- The gap between price levels: big empty gaps in the ladder mean price will jump, not glide, when a large order hits.
- Time of day: the same instrument shows a tight spread mid-session and a wide one in the dead hours.
Rule of thumb: check the live spread before any order that is large for the market you are in. It is the cheapest liquidity check there is, and it takes one glance.
High liquidity vs low liquidity assets
Not all markets are built the same. The single biggest liquidity decision you make is what you choose to trade, before any gauge comes into it.
Assets sort into rough tiers, from the deep end to the shallow.
| Tier | Examples | Liquidity | Spread |
|---|---|---|---|
| Deepest | EUR/USD, USD/JPY, gold | Very high | Tightest |
| Deep | Major indices, GBP/USD, Bitcoin | High | Tight |
| Medium | FX minors, Ethereum, oil | Moderate | Wider |
| Thin | FX exotics, large-cap altcoins | Low | Wide |
| Thinnest | Small-cap altcoins, micro-caps | Very low | Widest |
A few plain notes on that table.
- The Forex majors sit at the top. The whole Forex market turns over around 7.5 trillion dollars a day, and EUR/USD is the deepest corner of it.
- Gold trades like a major. Spot gold (XAU/USD) is deep and tight through the main sessions, and that depth is part of why so many traders use it.
- Bitcoin is liquid, most altcoins are not. BTC and Ethereum absorb size well, but drop down the market-cap list and the book gets thin fast.
- Exotics look tempting and cost you. A pair like USD/TRY can carry a spread of many pips, and that gap is a cost you pay on every single trade.
For how the currency pairs themselves are grouped, the Forex pairs guide breaks down majors, minors and exotics in detail.
Liquidity in Forex vs crypto
Liquidity is not just about the asset, it is about the clock. Forex and crypto run on completely different schedules, and that shapes when each is deep or thin.
Forex trades in sessions, crypto trades non-stop but still has quiet hours.
| Window (UTC) | Forex liquidity | Crypto liquidity |
|---|---|---|
| 07:00 to 08:00, London open | Rising fast | Moderate |
| 13:00 to 16:00, London and New York overlap | Deepest | Highest |
| 17:00 to 22:00, New York afternoon | Fading | Moderate |
| 22:00 to 07:00, Asia and off-hours | Thin | Thin; weekend gaps |
- The London and New York overlap is the deep end. Both major centres are open, so spreads are tightest and orders fill best. Full times are in the Forex market hours guide.
- Forex closes on the weekend, crypto does not. But crypto weekends run on thin liquidity, so moves get exaggerated and spreads widen.
- Liquidity in Forex is session-driven. The euro is deepest in the London and New York hours, the yen picks up in the Asian session.
- Crypto never sleeps, but it naps. The quiet Asian overnight hours in crypto are where thin-book spikes and stop-runs cluster.
How liquidity affects price and what it costs you
Liquidity is not an abstract concept, it is a line item on every trade. Thin markets charge you in three ways, and the bill shows up whether you notice it or not.
Here is what low liquidity does to your fills.
| Liquidity | Spread cost | Slippage risk | Gap risk |
|---|---|---|---|
| High | Low | Low | Low |
| Medium | Moderate | Some | Some |
| Low | High | High | High |
The three costs, spelled out.
- Slippage: your order fills at a worse price than you asked for, because there was not enough size at your level. Thin markets are where it lands hardest.
- A wider spread: you pay the gap between bid and ask twice, once on entry and once on exit. On an exotic pair that is a real drag on results.
- Gaps and whipsaws: when the book is thin, a single large order jumps price instead of nudging it. Stops get run, then price snaps back.
- Cascade risk in crypto: thin books plus heavy leverage feed forced selling. That feedback loop is how a liquidation cascade spirals.
The takeaway: the same setup can be profitable in a liquid market and a loser in a thin one, purely on execution cost. Liquidity is not a side detail, it is part of your edge.
When to care about liquidity most
Every trader should respect liquidity, but it matters more the faster you trade. Your style sets how much attention it deserves.
Match the check to how you trade.
| Style | Priority | What to check | Best window |
|---|---|---|---|
| Scalping | Critical | Live spread, depth | Session overlap |
| Day trading | High | Volume, spread | London and New York |
| Swing trading | Medium | Asset tier, gaps | Any liquid session |
| Position trading | Lower | Asset choice | Any |
- Scalpers live and die on it. A one-pip wider spread wrecks a strategy that aims for a few pips, so the scalping guide leans hard on liquid pairs and prime hours.
- Day traders should trade the overlap. The deep midday window gives the tightest spreads and the cleanest fills.
- Swing traders can relax a little. Holding for days, a slightly wider entry spread matters less, but still avoid the thinnest assets and weekend gaps.
- Position traders care mostly about asset choice. Pick a liquid instrument up front and the day-to-day spread barely registers.
How to see liquidity on your own charts
You do not need a paid data feed to run every gauge above. The tools are built into free platforms.
- Volume: it plots by default under most charts. On TradingView add “Volume” and drop a “Moving Average” on it set to 20 for the baseline line.
- The spread proxy: add “Average True Range (ATR)” with a length of 14 to read range, or turn on your broker’s live spread display for the real number.
- Depth of market: on MetaTrader 4 or 5, right-click a chart and open the Depth of Market window where your broker supports it, to see resting size near price.
- Session shading: add a “Sessions” indicator on TradingView to mark London and New York, so you can watch volume rise into the overlap.
One honest note. Retail Forex is decentralised, so the volume you see is your broker’s flow, not the whole market.
It is still a fair relative gauge, busy is busy. Treat it as a proxy rather than an exact number.
What works: the liquidity checklist
Keep these four points and you have covered most of what liquidity will ever cost you.
- Trade deep markets by default. Forex majors, gold, major indices and Bitcoin fill cleanly. Drop down the tiers only with eyes open.
- Read volume and the spread before you size up. Busy market with a tight spread means go, thin market with a wide spread means wait or trade smaller.
- Respect the clock. The London and New York overlap is the deepest window, the dead hours and crypto weekends are where thin-book damage happens.
- Price your execution. Every trade pays the spread and risks slippage. In a thin market that cost can quietly swallow the edge.
Liquidity will not call a direction for you. But it decides whether the price you see is the price you get, and over a year of trades that gap is the difference between a plan that works on paper and one that works in practice.
Key terms
- Liquidity: how easily you can trade an asset without moving its price.
- Bid-ask spread: the gap between the best buy price and the best sell price. Tight means liquid.
- Pip: the standard small price step in Forex, usually the fourth decimal place on a pair.
- Slippage: the difference between the price you expected and the price you actually got.
- Market depth: how much size is resting near the current price, ready to absorb orders.
- Volume: how much of an asset traded in a period, a live proxy for liquidity.
- ATR: Average True Range, a gauge of how far price moves each bar, used here as a spread stand-in.
- Thin market: a market with few participants, wide spreads and jumpy price.
FAQ
What is liquidity in trading, in plain terms?
Why is liquidity important in trading?
How does liquidity affect price in trading?
What happens when liquidity is low?
How do I check the liquidity of a market?
Which assets have the highest liquidity?
What is liquidity in Forex specifically?
When are the best times to trade for liquidity?
Is high liquidity always better for a trader?
What is the difference between liquidity and volatility?
Real-time trade setups with entry, stop loss and take profit. Daily market analysis. No subscription, no complicated theory.
🌍 Our recommended brokers


Reader Reviews
Be the first to review this — tell other traders what actually helped, or where it fell short.
Leave a Review

Forex Analyst & Senior Trader
Former FX desk trader with 8 years in institutional forex. Works in multi-timeframe analysis and order flow, turning desk experience into systematic, testable rules across forex and metals.
