
What is scalping in trading?
Scalping is the fastest style of active trading. You work the 5-minute or 1-minute chart, aim for small moves, and hold for minutes rather than hours or days.
The pitch is simple. Take many tiny wins, keep each risk small, and let the volume of trades stack up.
That is the theory. The reality, once real spreads and fees come out, is harder, and this guide is built on the data rather than the pitch.
Here is what one fast momentum scalp looks like on spot gold (XAU/USD), start to finish.
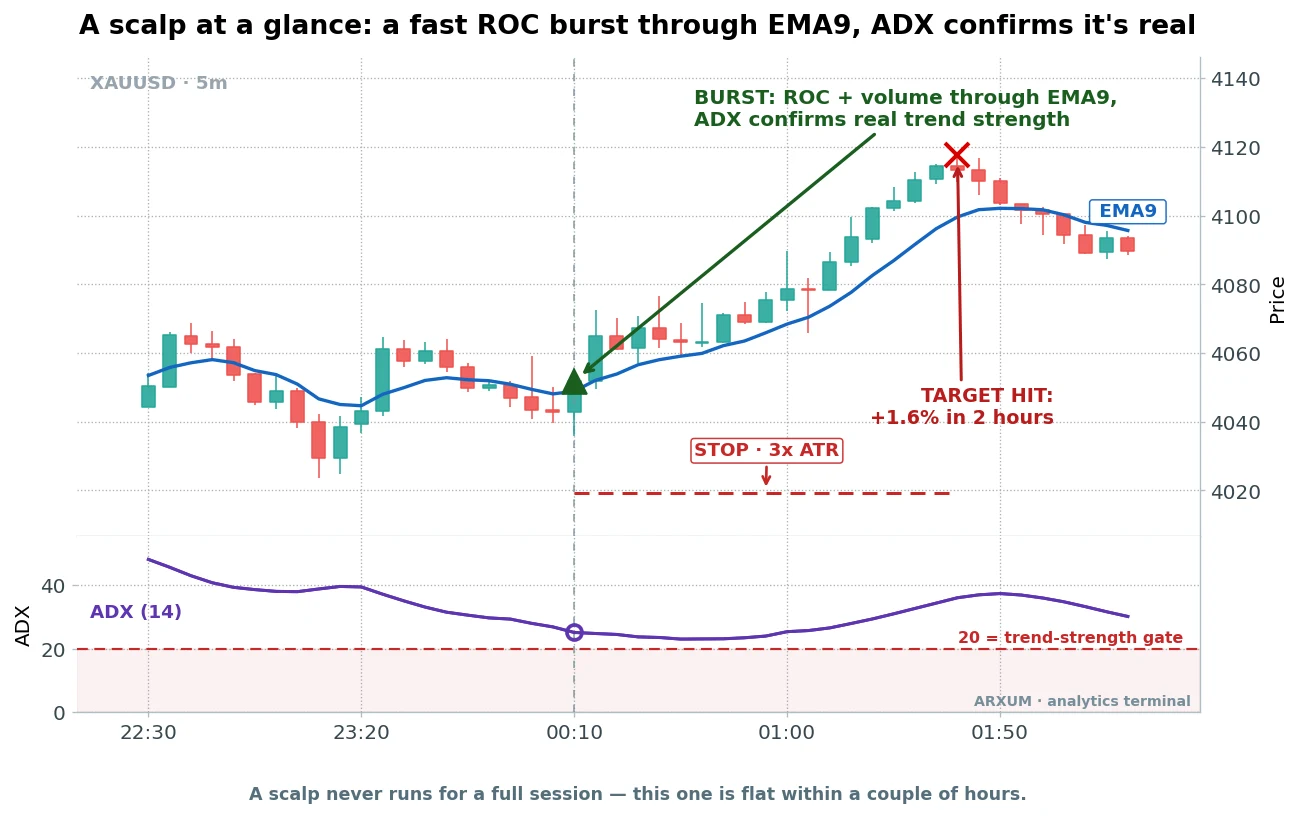
These examples are real trades spanning the full 2024 to 2026 data window, over which gold more than doubled from about $2,400 to $5,500. That is why the price levels differ from one chart to the next.
Price drifts sideways, coiling into a tight range.
Then it bursts. A fast thrust pushes up through the EMA9, the 9-bar exponential moving average, a line that tracks the last handful of candles and reacts quickly to a new move.
You enter on that burst, ride it while it runs, and close out before the momentum dies.
That is the whole shape of the setup you will see below. Fast in, a defined stop, out within a few hours.
Notice one thing already. Even this “scalp” is flat within a couple of hours, not a matter of seconds.
That gap between the marketed image and the data is the honest thread running through this whole guide.
The plan: report what the data actually says
Most scalping guides hand you a 1-minute strategy and a promise. This one hands you two years of real market data.
We built four scalp setups on the 5-minute chart, each with its own logic, and ran them across three markets: spot gold, EUR/USD, and Bitcoin. Fees came out of every trade.
The four setups:
- Bollinger squeeze. The bands pinch tight, then price closes outside them, and you trade the volatility burst.
- Stochastic pullback. In a fast micro-trend, a quick oscillator dip that turns back is your entry with the trend.
- VWAP fade. Price stretches far from the session’s average price in a quiet market, and you fade it back.
- Momentum burst. A fast thrust through the EMA9 on heavy volume, confirmed by trend strength.
Three of those four lost money on every market at every hold time we ran. That is not a failure of the write-up, it is the finding.
The one survivor, the momentum burst, only paid after we changed the exit, and only on one market. The rest of this guide is that story, told straight.
The one thing that turned a loser into a winner
Here is the result that reframed the whole study. It was not the entry, it was the exit.
The momentum burst had the best raw shape of the four setups, but under a tight scalp-style stop it still lost, a profit factor of 0.47 on gold. Then we swept the exit on its own.
Two terms first, because the numbers lean on them.
Profit factor is the whole strategy’s dollars won divided by dollars lost. Above 1.0 you made money.
A profit factor of 1.12 means about $1.12 came back for every dollar the losers cost. It is the right number for comparing whether a setup pays.
Win rate is simpler. It is the share of trades that end in profit, and you read it alongside profit factor, never alone.
Now the exit sweep. We kept the entry identical and only changed the stop and target.
| Stop style | Target | Trend filter | Profit factor |
|---|---|---|---|
| Tight scalp stop | 1.3× risk | none | 0.47 |
| Wide (3× ATR) | 1.0× risk | none | 0.91 |
| Wide (3× ATR) | 2.0× risk | none | 1.00 |
| Wide (3× ATR) | 2.0× risk | ADX ≥ 20 | 1.08 |
| Wide (3× ATR) | 2.0× risk | ADX ≥ 25 | 1.09 |
The tight stop was the bug, not the entry. On the 5-minute chart, ordinary noise kept stopping trades out before the burst could develop.
ATR is the average true range, a plain gauge of how much price typically moves in a bar. A 3× ATR stop just means “give the trade three normal bars of wiggle room” instead of a hair-trigger scalp stop.
Our average true range guide covers how to add it in one click.
Widening the stop to that 3× ATR distance, with a target twice the risk, dragged the setup up to breakeven. One more filter pushed it over the line.
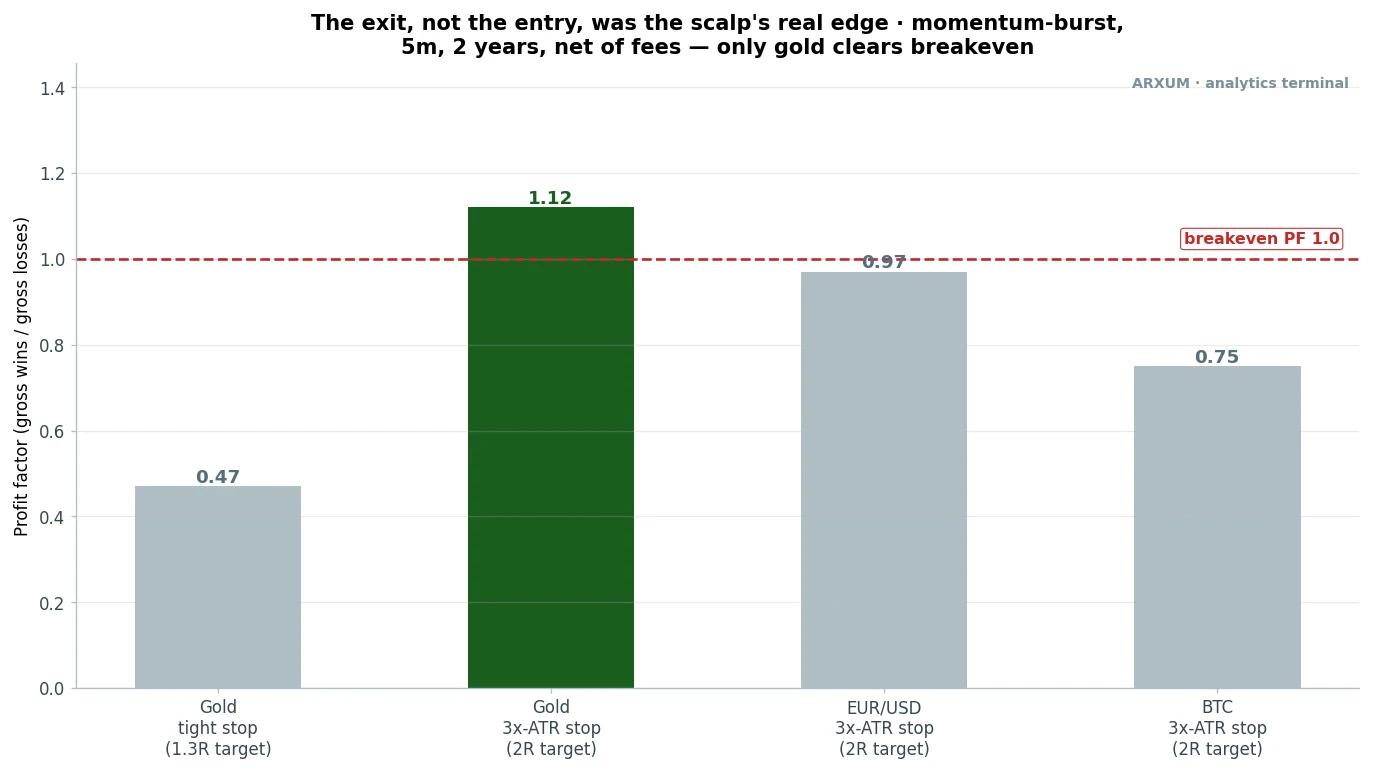
Read the chart, not a wall of numbers. The left bar is the tight-stop version on gold, an outright loser at 0.47.
The next bar is the same entry with the wide stop and one filter, up at 1.12, over the breakeven line. The last two bars are the same fixed setup on EUR/USD and Bitcoin, and both sit below the line.
That is the honest scope in one image. The fix works, and it works on gold.
The filter that separates the winners
The filter that pushed gold over the line is ADX, the average directional index. It is a trend-strength gauge, a single line that reads how strong the current move is, regardless of direction.
Low ADX means the market is drifting with no real trend. A reading above 20 says a genuine trend is underway, and the common thresholds traders use are 20 and 25.
We use ADX ≥ 20 because that is where the edge showed up in the data, not because a textbook says so. You will see the ADX(14) line drawn in its own panel under every trade chart below, with the 20 gate marked.
Reading it on a live chart is easy. Add ADX from your platform’s indicator menu, watch the single line, and only take the burst when it sits above 20.
Below 20, the “burst” is usually just noise inside a range, and those are the trades that bleed you.
One honest note on the trade-off. ADX ≥ 25 or ≥ 30 showed a higher headline profit factor, but the edge stopped holding up equally across both halves of the data window.
A real edge should survive on data it was never fit to, and ADX ≥ 20 did that most cleanly. So we lock it at 20 and treat the flashier higher numbers as a curve-fit warning, not an upgrade.
Gold, the long side
Gold carried the study, and both directions paid. Start with the long.
The setup fires when a fast thrust pushes up through the EMA9 on volume at least 1.4 times the recent average, with ADX above 20.
The rules:
- Trigger: a fast ROC burst closes above the EMA9, ROC being rate of change, a simple momentum reading of how fast price is moving.
- Confirmation: volume at least 1.4 times its recent average, and ADX above 20.
- Stop: 3× ATR below entry, room to breathe past the noise.
- Target: twice the risk, with a hard time-stop closing the trade after about three hours.
Here is one of those long bursts, from entry to exit.
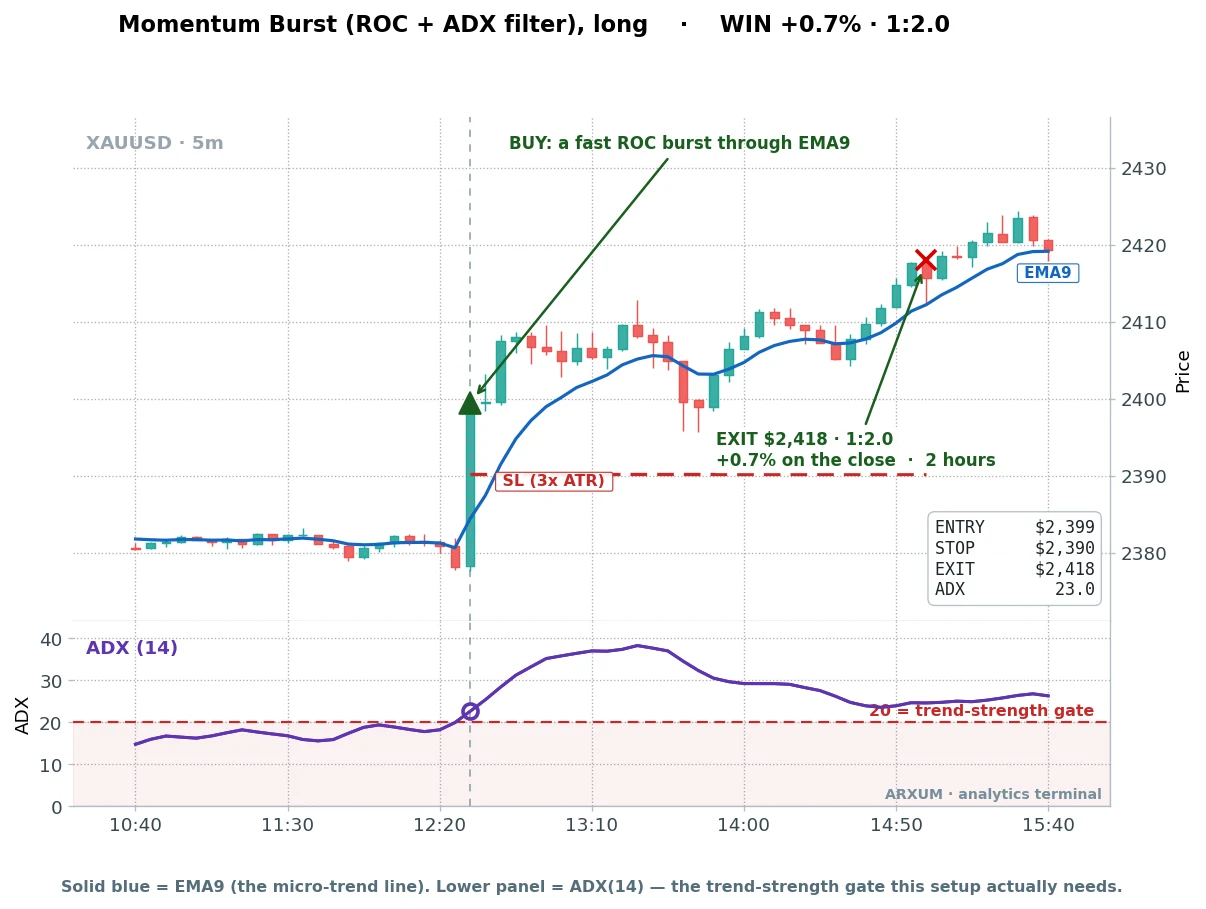
That phrase risk/reward 1:2.0 is worth a slow read. The 1 is your risk, the distance from entry to stop.
The X is the reward, how many times that risk the trade made back. So 1:2.0 means this winner returned about twice what it would have lost if stopped.
You will also see it called reward-to-risk, same idea, same number. Our risk/reward ratio explainer walks through it in full.
Price coiled flat, then a heavy bar burst up through the EMA9 with ADX ticking above 20. That was the entry, the green marker.
The stop sat 3× ATR below, and the trade rode up for two hours before hitting its target for +0.7%.
Now the same setup losing, because honesty beats a clean story.
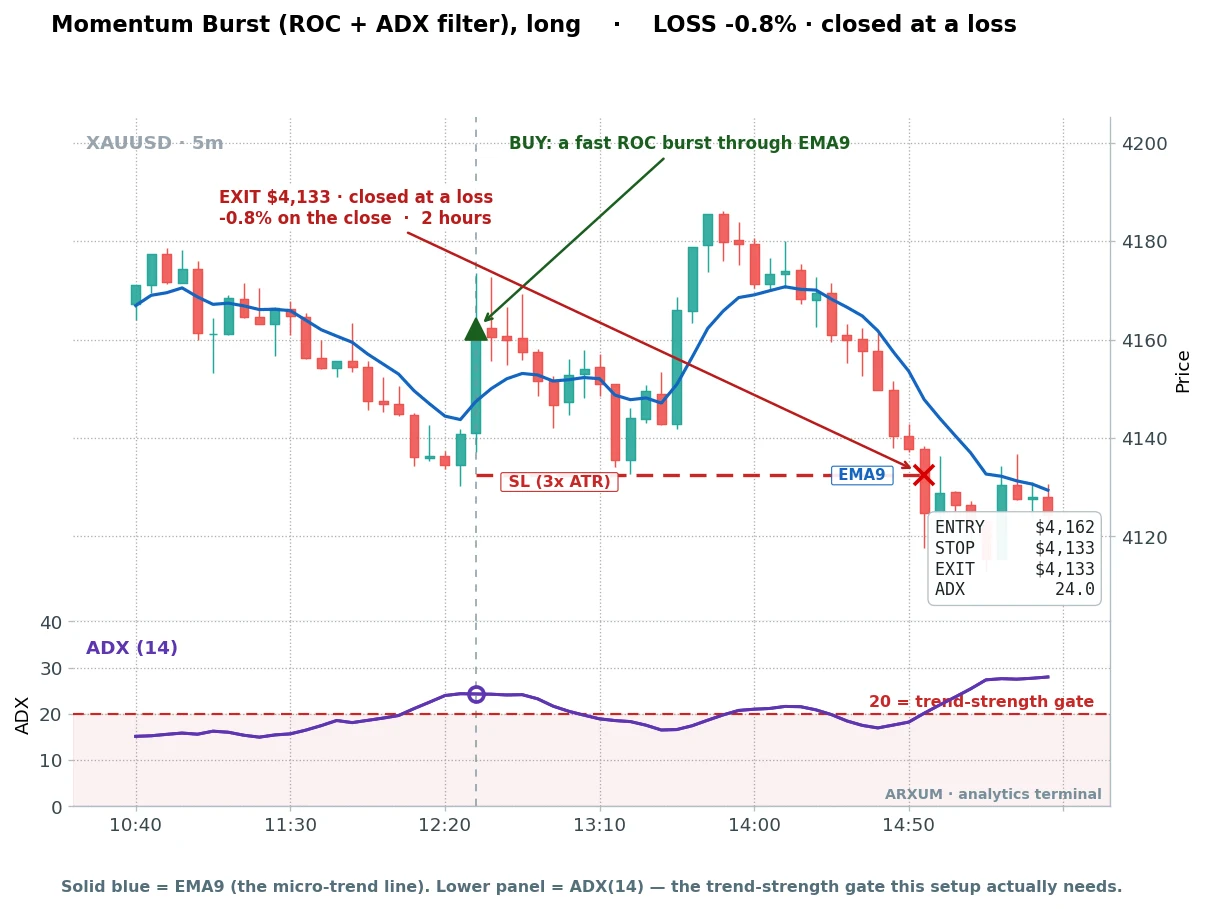
Everything read right. A clean burst through the EMA9, ADX at 24, volume there.
Then price rolled straight back over and hit the wide stop. This is the shape of the losers in this style, and there are more of them than winners.
The full trade history on gold, long side:
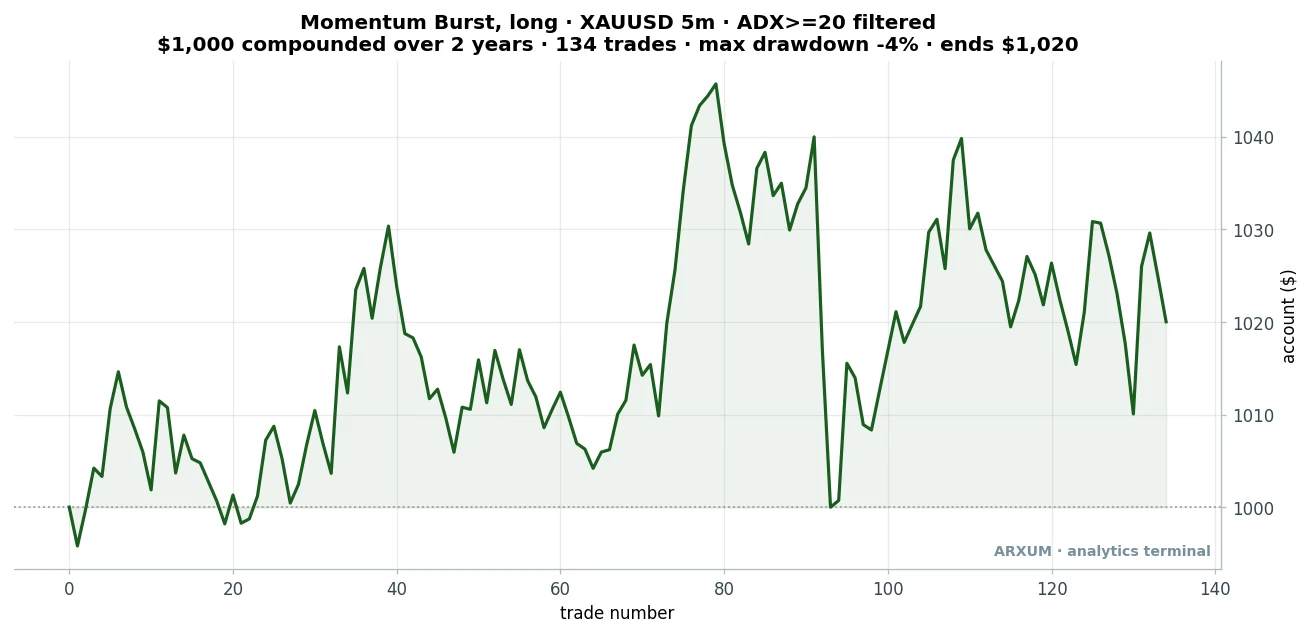
| Trades | 134 |
| Win rate | 48% |
| Reward-to-risk | 1:1.2 |
| Profit factor | 1.08 |
| Net return on $1,000 | +2.2% |
One note on the reward-to-risk figure. The target on every trade is 2.0R, but the table reports the realized average across all 134 trades, including winners, losers, and the ones the 180-minute time-stop closed early, which is why it lands below 2.
Read that curve honestly. It grinds, it chops, and the whole run only added about 2% over two years.
The edge here is thin per trade and shows up over many of them, never on any single one. That jaggedness is normal for a low win-rate scalp, and it is what the value actually looks like.
Gold, the short side
The short side was the stronger of the two on gold, mostly because its winners paid a touch more relative to its losers.
Same logic, mirrored. A fast thrust pushes down through the EMA9 on heavy volume, ADX above 20.
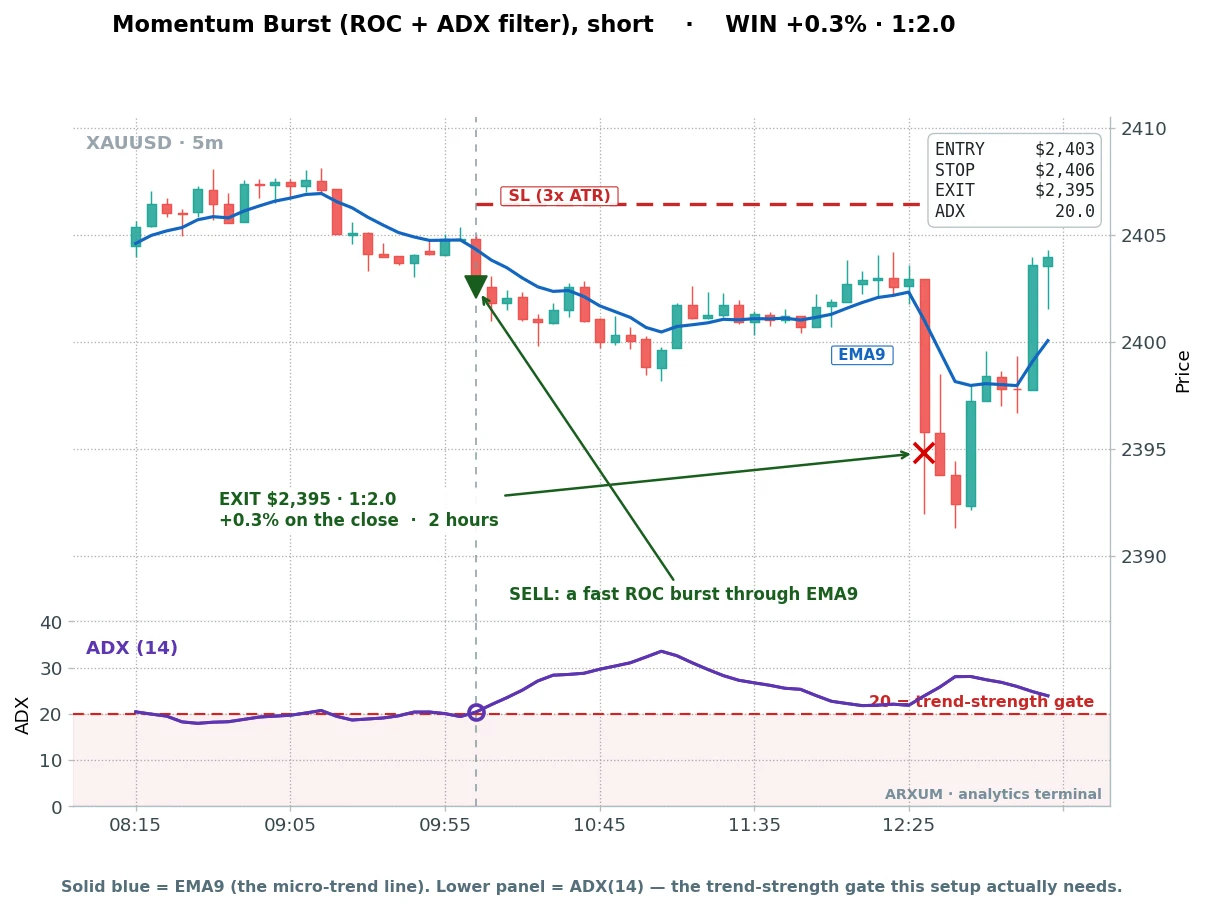
The burst broke the EMA9 to the downside with ADX right at the 20 gate. The entry fired, the drop extended, and the target came in for a small +0.3%.
A small dollar move, but the stop was tighter still, so the 1:2.0 held. Now the loss, and it carries a useful lesson.
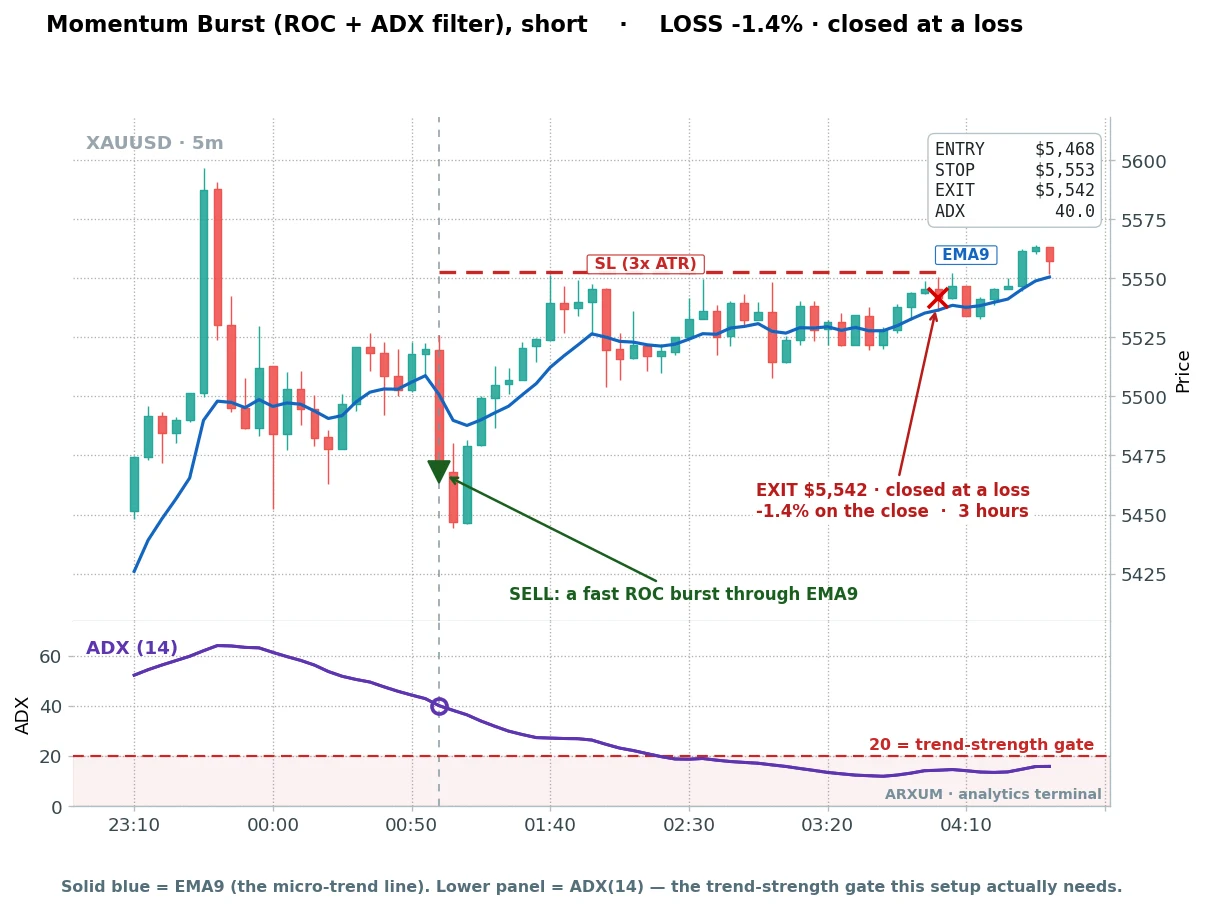
This one is worth sitting with. ADX was up at 40, a very strong trend reading, and the trade still lost.
The filter reduces false signals over many trades. It does not guarantee any single one, and a beginner who expects a high ADX to mean a sure win will be disappointed.
The full trade history on the short side:
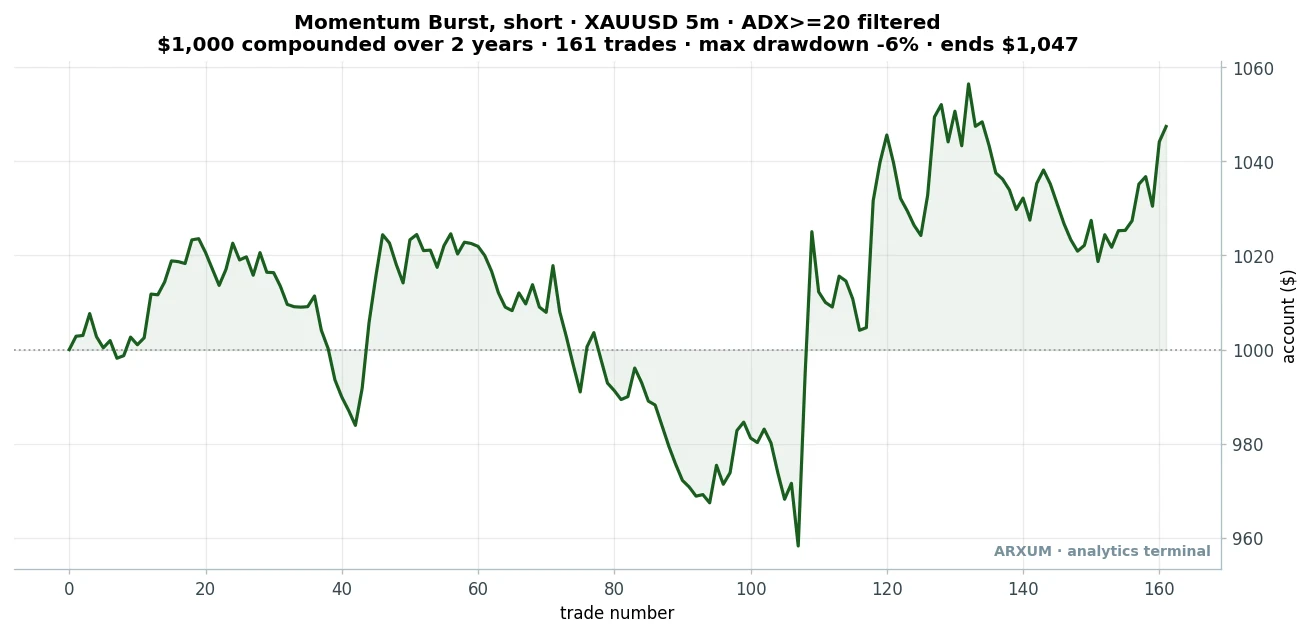
| Trades | 161 |
| Win rate | 42% |
| Reward-to-risk | 1:1.6 |
| Profit factor | 1.14 |
| Net return on $1,000 | +5.0% |
The short side ran $1,000 to about $1,047 over 161 trades, a bit better than the long. Both sides held up when we checked them the honest way.
We split the two years in half and ran the rules on the second half, data they were never fit to. That is the out-of-sample check, the one that separates a real edge from a curve fit.
Both sides stayed above a 1.0 profit factor in that second half. Weaker than the first, as always, but still on the right side of breakeven.
One more piece of context, and it matters. Over the same two years, simply holding gold returned far more than either scalp, but it also sat through a 28% drawdown along the way.
These scalps kept their worst drops to 4% and 6%. So think of this as a low-drawdown supplement, not a replacement for a trend you could have just held.
Does the scalp survive beyond gold?
The honest answer is mostly no, and this is where a lot of scalping content quietly looks away.
We ran the exact locked setup, unchanged, on EUR/USD and Bitcoin. Neither cleared the bar.
- EUR/USD finished at a 0.97 profit factor, just under breakeven, on a thin sample of 64 trades. Out-of-sample it dropped further. Call it a statistical wash, not something to trust.
- Bitcoin failed outright at 0.75, with a drawdown near 56%, no better than just holding it through a brutal window.
So the working scalp is a gold finding, not a universal edge. That fits how the market has behaved.
Gold has been trending hard, and a momentum burst needs a market that actually follows through on a thrust. The euro chopped sideways for much of the window, and Bitcoin’s round-the-clock noise chewed the setup up.
If you trade the euro or crypto, the useful takeaway is not “force this setup.” It is that this specific scalp did not survive there, and a range-bound market wants a fade, not a burst.
Timeframes: 5-minute, and an honest word on the 1-minute
Every result above runs on the 5-minute chart. That is the primary timeframe here: fast enough to be a scalp, slow enough that a single tick of noise does not decide the trade.
We also ran the whole setup on the 15-minute chart as a cross-check. It came out comparable, not better, so the 5-minute stays the primary.
The 1-minute chart is a different story, and it is worth being blunt. We did not rank a 1-minute version, because the math is against you before price even moves.
On a typical spread, a 3-pip scalp pays away a large slice of the target in cost on the way in. Run that over dozens of trades a day and the spread, not the market, is your main opponent.
That is the quiet reason most 1-minute scalping fails. It is not that the entries are bad, it is that the cost per trade is too big a share of too small a target.
The honest catch: this “scalp” holds for hours
Here is the mismatch the data forces me to state plainly. The winning setup holds for about three hours on average, not seconds.
That is because the fix that made it work, the wide 3× ATR stop and the 2× target, needs room and time to play out. A true seconds-long scalp uses a hair-trigger stop, and that hair-trigger stop is exactly what turned this setup into a loser.
So call this what it is. It is a fast intraday momentum trade, closer to the quick end of day trading than to the seconds-in-and-out image scalping is usually sold on.
If your goal is literal seconds-scale scalping, the honest finding is that the fee and noise math on 5-minute data did not reward it. The data rewarded patience inside a fast setup, and I would rather tell you that than dress it up.
Position sizing: the part that keeps you in the game
Your entry matters less than your size. This is where the small-account math gets real, and it changes which market you should trade.
The rule everyone should keep is 2% risk per trade. On a $1,000 account, that is $20 at risk on any single position, no more.
Try to size the gold long from earlier on that account. Entry was near $2,399, and the 3× ATR stop sat about $9 per ounce away. The position is one division:
- Risk budget: $20
- Risk per ounce: $9
- Position size: $20 ÷ $9 = about 2.2 ounces
Here is the catch that division exposes. For gold, the smallest position most brokers offer is one micro lot, which is one ounce.
Your math says 2.2 ounces, so on this specific trade a $1,000 account can just about place two micro lots. But that only works because this stop was unusually tight for gold.
On a wider gold stop, the correct size drops below one micro lot, and then a small account simply cannot take the trade honestly. What you must never do is widen the stop or oversize to “make it fit,” because that is how a 2% plan quietly becomes a 10% plan and blows up.
So here is the same math on a market a small account can always place, EUR/USD. Scalping forex is sized in lots and measured in pips, the fourth decimal of the price, and on one micro lot each pip is worth about $0.10.
Say a euro trade with a 40-pip stop, the same $1,000 account, the same 2% rule, so $20 of risk:
- Risk budget: $20
- Risk per micro lot on a 40-pip stop: 40 × $0.10 = $4.00
- Position size: $20 ÷ $4.00 = 5 micro lots (0.05 lots)
That fills cleanly on any standard account and risks close to the same 2%. The point is not “avoid gold.” It is that a small account belongs on an instrument where the dollar stop is small enough to size honestly, and for gold itself you would want a broker offering fractional or cent-lot sizing.
Spread matters more than usual on a fast setup, so it pays to compare raw-spread accounts before you commit. If you want the detail on regulation, raw spreads and withdrawal reliability, a full broker rundown is worth reading first.
How to scalp trade this setup, step by step
Once your size is set, placing the order is three fields on the ticket:
- Entry: a market order on the bar that confirms the burst through the EMA9, with ADX above 20.
- Stop-loss: in the stop field, 3× ATR from entry (below for a long, above for a short).
- Target: in the take-profit field, twice the stop distance, and close the trade after about three hours if neither level is hit.
You can chart and practice all of this free on TradingView before risking a cent. Add the EMA9, ADX and ATR from the Indicators menu by name, or on MT4 and MT5 through Insert then Indicators then Trend or Oscillators.
Start on a free demo account, not real money, until the burst is obvious to you at a glance. Two proven configurations you can lift straight from the study:
- Gold, momentum burst, long. 5-minute chart. Buy a fast burst that closes above the EMA9 on volume 1.4 times average with ADX above 20. Stop 3× ATR below, target twice the risk, out within about three hours.
- Gold, momentum burst, short. 5-minute chart. Sell a fast burst that breaks below the EMA9 on heavy volume with ADX above 20. Stop 3× ATR above, target twice the risk, same time-stop.
Both are gold-only for a reason the data made clear. Do not paste them onto the euro or Bitcoin expecting the same result.
The discipline this style demands
The risk talk here is not boilerplate, because this setup has a shape you have to make peace with.
You will lose more than half your trades. Win rates of 42% to 48% mean the losers outnumber the winners, and the whole edge rides on the winners being bigger.
If you cannot sit through a string of five or six small stops without abandoning the plan, this style breaks you. Not because it stopped working, but because you stopped following it.
A few concrete habits keep you in the game:
- Risk the same 2% every time. Do not size up after a loss to win it back, and do not size up after a win out of euphoria. The math only holds if every trade is the same fraction of the account.
- Cap the day. If you lose 6% of the account in one session, close everything and stop. That kills the revenge-trading spiral before it kills the account.
- Use the circuit-breaker. If you take three to six losses in a row, the regime may have changed. Gold may have stopped trending. Pause and check conditions before the next trade.
- Run a calm live-versus-data check. If your live results drift far below this study over a real number of trades, do not panic-quit on one bad week, that is just variance. A sustained, large gap is a real signal, so step back and look at whether gold still suits the tool.
No mechanical setup is permanent. This one works while gold trends, and noticing when that changes is the actual job.
Only risk money you can afford to lose.
What does not work
The one working setup is the good news. The honest counterweight is everything that lost.
The Bollinger squeeze scalp. The bands pinch, price breaks out, and on 5-minute data it lost on every market we ran it on, a profit factor between 0.25 and 0.30 on gold. Most squeezes on this timeframe are false breaks that fade straight back.
The stochastic pullback scalp. A fast oscillator dip in a micro-trend sounds clean, but it fired far too often and paid far too little, landing near 0.17 to 0.22 on gold. It generated thousands of trades and bled fees on nearly all of them.
The VWAP fade scalp. Fading price back to the session average in a quiet market was the worst of the four, down at 0.10 to 0.13. On the 5-minute chart, “quiet” and “about to trend” look identical until the fade is already underway against you.
The tight scalp stop itself. This is the one that surprised me most. The famous scalping habit, a hair-trigger stop close to entry, was the single biggest reason the one good entry logic lost money before we widened it.
Scalping crypto on the 1-minute. Bitcoin failed even on the 5-minute with the working setup, and the 1-minute only makes the spread problem worse. There is no session structure to lean on and the cost per trade is punishing.
Common mistakes
- Using a scalp-tight stop on a 5-minute setup. Noise stops you out before the move develops. The whole study turned on giving the trade room with a wider stop.
- Trading the burst with ADX below 20. Without the trend-strength filter, most bursts are just noise inside a range, and those are the trades that lose.
- Forcing a gold setup onto the euro or crypto. The setup is gold-specific in this study. The euro was a wash and Bitcoin failed outright.
- Judging the setup by win rate. A 42% win rate is fine when the winners run 1:2. Cutting winners early to raise your win rate quietly destroys the edge.
- Expecting a high ADX to guarantee a win. The -1.4% short loss happened with ADX at 40. The filter cuts false signals over many trades; it never promises a single one.
Where to go from here
If you are weighing whether this fast style even fits your schedule, the honest comparison is in swing trading versus day trading, which trades screen time against overnight risk. And since the whole edge here rested on the ADX trend filter, the forex market hours guide shows when gold actually trends hard enough for a burst to follow through.
The bottom line is the one the data kept repeating. The entry was never the hard part.
The exit and the trend filter were what turned a losing scalp into a thin, real edge, and only on gold. Trade the market that suits the tool, size for the account you actually have, and make peace with a lot of small losses to be there for the winners.
FAQ
What is scalping in trading, in plain terms?
Is scalping trading profitable?
What is the best timeframe for scalping?
How much money do you need to start scalping?
How do you scalp trade step by step?
What indicators do scalpers use?
Is scalping better than day trading?
Can you scalp crypto like Bitcoin?
Why do most scalpers lose money?
What are the key terms in this guide?
Real-time trade setups with entry, stop loss and take profit. Daily market analysis. No subscription, no complicated theory.
🌍 Our recommended brokers



Quant Researcher & Systems Builder
Quantitative researcher who builds the automated systems behind Arxum strategy testing. Works in Python and Pine Script, using AI alongside classic backtesting to validate strategies on years of real data.
