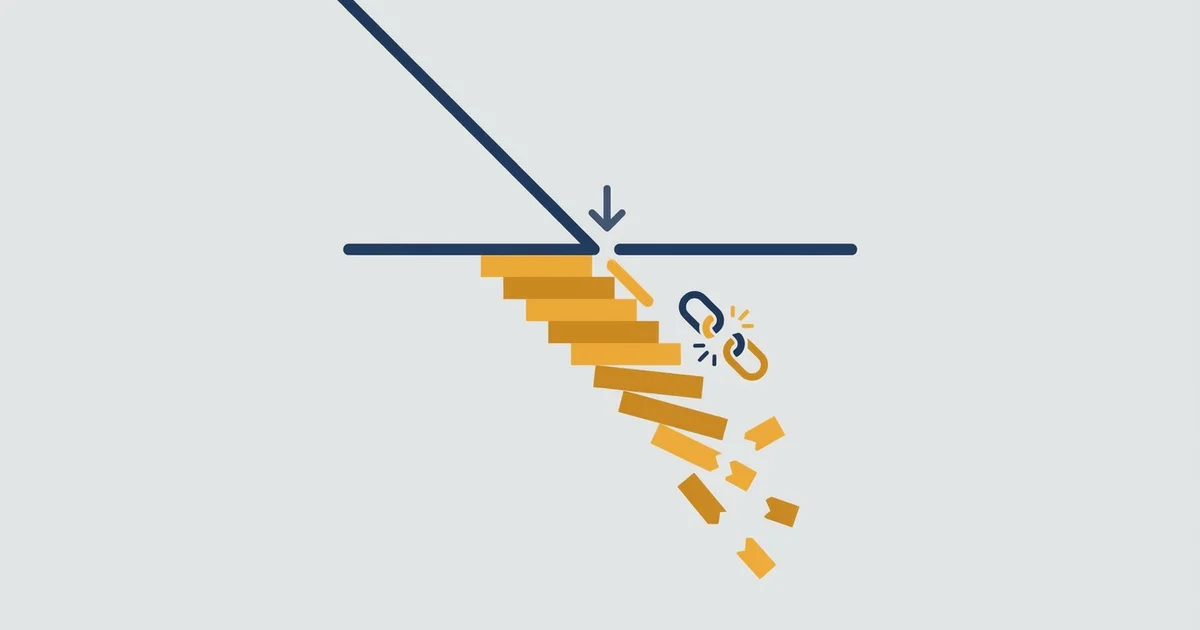

What crypto liquidation actually is
A liquidation is the exchange closing your leveraged position because your collateral can no longer cover the loss. You do not choose it and you cannot cancel it.
Here is the mechanic on a single 10x long.
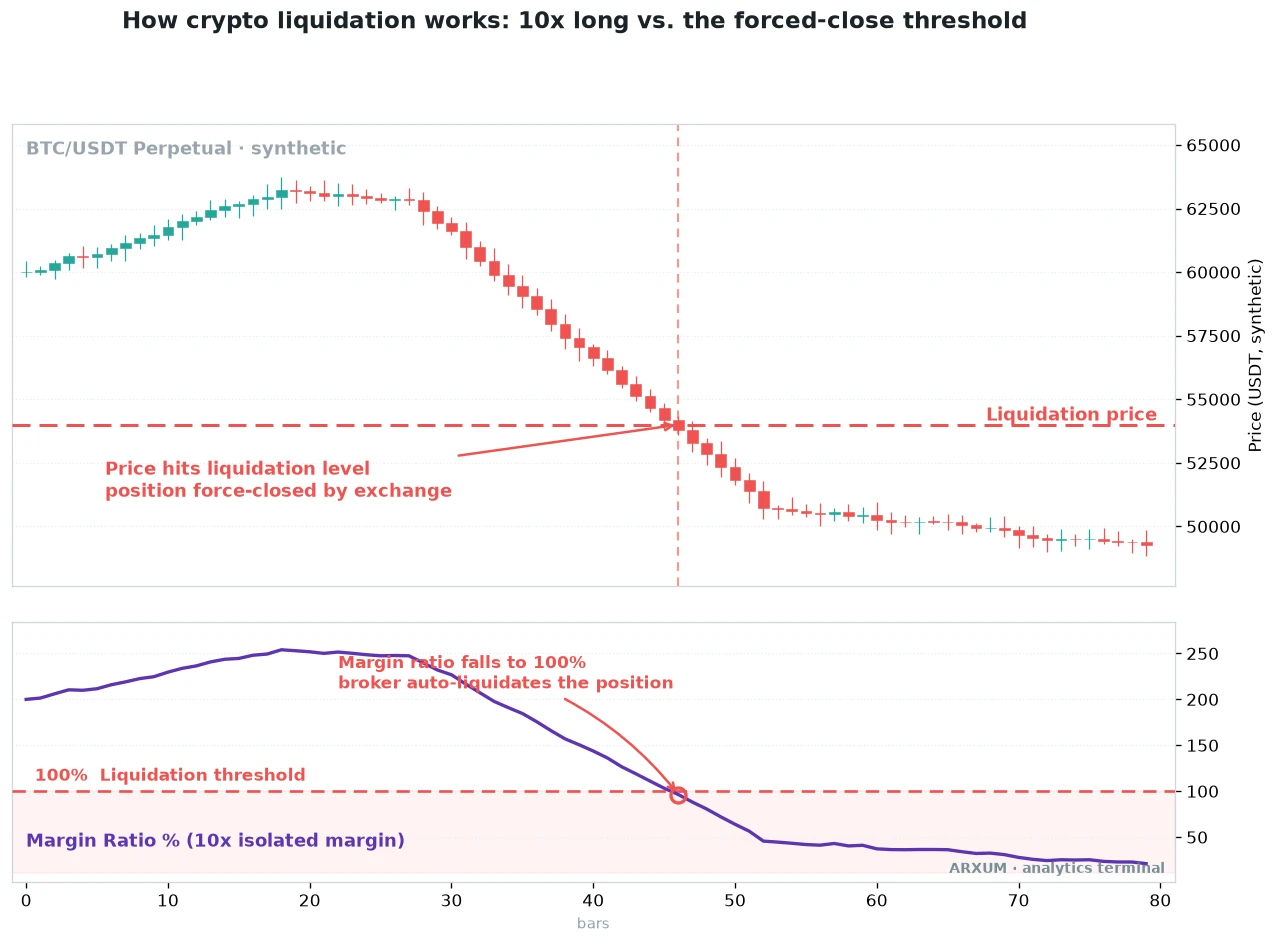
Read the two panels together. The top panel is price.
The bottom panel is your margin ratio, which is your remaining collateral measured against what the exchange needs you to keep.
- Price falls, and your open loss grows.
- The margin ratio slides toward the liquidation threshold as the loss eats collateral.
- When the ratio hits the floor, the position is force-closed at the liquidation price.
- The collateral you posted for that trade is gone, and the trade is over whether you were watching or not.
The one-line version: a liquidation is a margin call that closes itself. It is the crypto cousin of a forex margin call, except perpetual exchanges skip the warning shot and go straight to the force-close.
What triggers a liquidation
Three things decide when the trigger fires. None of them is a mystery once you name them.
| Input | What it is | Effect on liquidation |
|---|---|---|
| Leverage | Position size divided by your posted margin | Higher leverage, closer trigger |
| Maintenance margin | Minimum collateral the exchange makes you keep | Hit it and the force-close fires |
| Adverse move | How far price runs against you | The move that drains the collateral |
- Leverage is the accelerator. At 10x you control ten dollars of position per dollar of collateral, so a 1% move is a 10% swing on your money.
- Maintenance margin is the floor, usually a small fraction of the position (often around 0.5% on major coins, higher on small caps). Fall through it and you are liquidated.
- Funding and fees quietly nudge the trigger closer over time on a perpetual, because they are deducted from the same collateral. A position held for days can be liquidated slightly sooner than the clean math suggests.
Liquidation price by leverage
The liquidation price is the level where your loss equals your usable collateral. The rough distance to it is simple: divide 1 by your leverage.
| Leverage | Margin you post | Adverse move to liquidation |
|---|---|---|
| 5x | 20% | around a 20% move |
| 10x | 10% | around a 10% move |
| 20x | 5% | around a 5% move |
| 25x | 4% | around a 4% move |
| 50x | 2% | around a 2% move |
| 100x | 1% | around a 1% move |
Those figures are before fees, funding, and maintenance margin, all of which pull the level slightly closer to you. Bitcoin moves 2% to 4% on a quiet day, so read the 50x row again.
Worked example, isolated 10x long on Bitcoin:
- Entry at $60,000, 10x long, isolated margin.
- Distance to liquidation ≈ 1 ÷ 10 = 0.10, so about a 10% drop.
- Keep a 0.5% maintenance margin, so the real distance ≈ 10% − 0.5% = 9.5%.
- Move in dollars: $60,000 × 0.095 = $5,700.
- Liquidation price ≈ $60,000 − $5,700 = $54,300.
Flip it for a short and the level sits above entry: $60,000 × 1.095 ≈ $65,700.
Now the same trade at 50x: 1 ÷ 50 = 2%, trimmed to about 1.5%, which is $60,000 × 0.015 = $900. Your liquidation sits at $59,100, a level Bitcoin can print inside an hour.
The takeaway: your liquidation price is not luck. It is arithmetic you can run before you click buy, and higher leverage moves it right onto your entry.
Partial versus full liquidation
Exchanges do not always close the whole position at once. Which one you get depends on the venue and your margin mode.
- Partial liquidation: the engine closes part of the position to lift your margin ratio back above the floor. You survive with a smaller trade and a real loss on the part that was closed.
- Full liquidation: the whole position is closed. On isolated margin the assigned collateral is wiped; on cross margin the engine can keep pulling from your balance.
- Liquidation fee: most exchanges charge a penalty on top of the loss, so a liquidation costs more than closing at the same price yourself.
- Bottom line: partial buys you a second chance, full does not. Neither is a plan. Both mean you sized too big.
Isolated versus cross margin
Your margin mode decides how much of your account is on the line for one trade. This choice changes the liquidation price and the blast radius.
| Feature | Isolated margin | Cross margin |
|---|---|---|
| Collateral at risk | Only the margin you assign | Your whole balance |
| If the trade fails | You lose that position only | The account can be drained |
| Liquidation timing | Sooner, less to draw on | Later, more to draw on |
| Best for | Beginners, one defined risk | Hedged books, close watchers |
- Isolated margin contains the damage. One bad trade cannot take the account, which is why it is the sane default while you learn.
- Cross margin delays liquidation by lending the trade your whole balance, then risks that whole balance if the move keeps going.
- Cross feels safer because the trigger is further away. That is the trap: it moves the liquidation of one position into a liquidation of everything.
Liquidation cascades
A cascade is why a normal dip turns into a 15% candle in minutes. Forced selling begets forced selling.
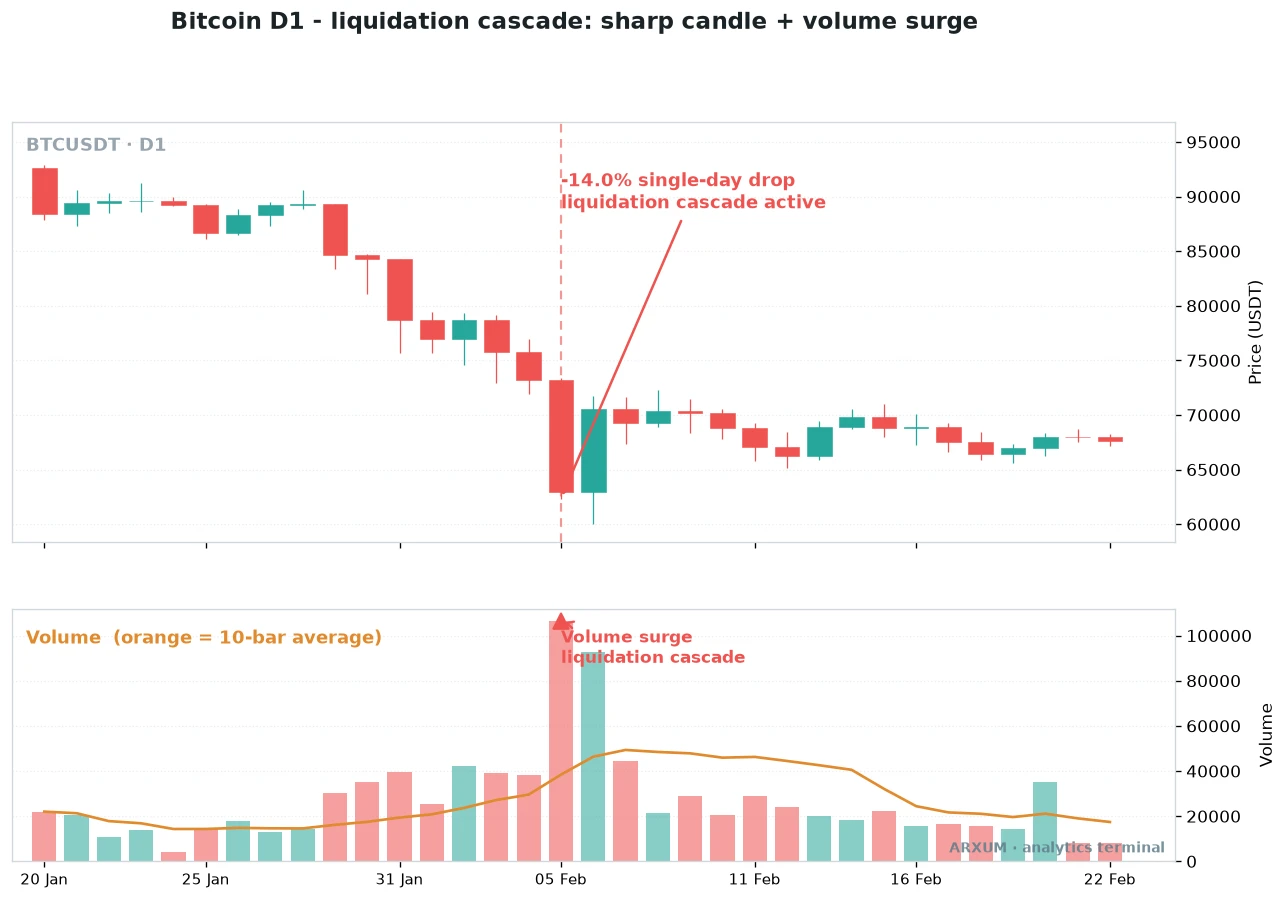
The chart marks the moment. One decisive red candle, a volume bar towering over the orange average line, then a lower shelf where price settles.
That volume is not normal selling, it is stops and liquidations firing together.
The loop runs like this:
- Price drops enough to liquidate the most stretched longs.
- Those forced sells become market orders, pushing price lower.
- The lower price hits the next tier of liquidation prices, and they fire too.
- Thin weekend or off-hours order books make each step bigger.
- The move overshoots, then snaps back once the leverage is flushed.
- Long cascades flush over-leveraged buyers and print a sharp wick down. Short cascades do the reverse and can feed a short squeeze as trapped shorts buy back.
- The overshoot is why the candle often has a long wick. Price ran past fair value because the selling was mechanical, not informed.
- What it means for you: a cluster of leverage near your level is a magnet. Price tends to reach for it, so a stop parked just beyond an obvious liquidation zone gets tagged on the wick.
Reading when a cascade is loading
You cannot predict the spark, but you can read the fuel. These are the crypto-native gauges, not indicators borrowed from stocks.
Crowding on one side is what a cascade flushes.
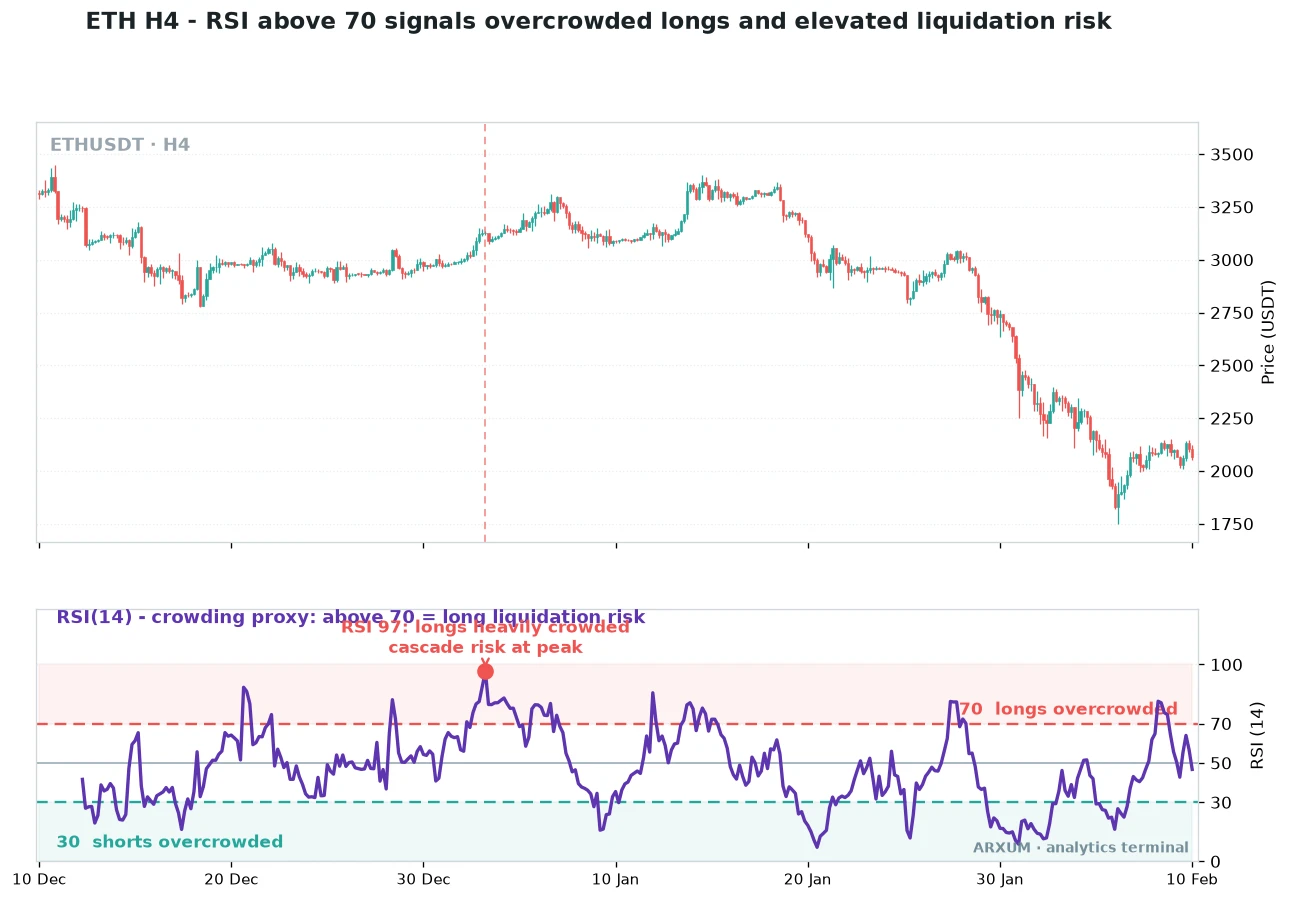
RSI is a momentum gauge that runs from 0 to 100. Above 70 it reads overbought, and on leverage that often means longs are chasing and crowded.
It is a proxy, not a liquidation feed, so treat it as one clue among several. The direct gauges live on the derivatives data, not the price chart.
| Gauge | How to read it | What it warns |
|---|---|---|
| Funding rate | Strongly positive, longs paying shorts | Longs crowded, downside flush likely |
| Open interest | Climbing fast alongside price | Fresh leverage stacked, cascade fuel |
| Long/short ratio | Skewed heavily to one side | The crowded side gets flushed first |
| Liquidation heatmap | Thick band of stops just off price | A price magnet and likely liq zone |
| RSI(14) crowding | Pinned near extremes on H4 or D1 | Momentum over-extended, entries chasing |
- Funding rate is a periodic payment between longs and shorts on a perpetual, explained in the crypto futures guide. When it runs hot and positive, longs are paying to stay in, which means the long side is crowded and vulnerable.
- Open interest is the total value of open contracts. Rising open interest into a rising price means the move is built on new leverage, not spot buying, and leverage is what liquidates.
- Long/short ratio tells you which side is stacked. The lopsided side is the one the market tends to punish.
- Liquidation heatmaps plot where clusters of leverage will be force-closed. A thick band just below price is a target, not a floor.
- RSI rounds it out as a fast read on the price chart itself. Pair it with the RSI indicator guide if the reading is new to you.
Liquidation heatmap tools
A heatmap turns raw derivatives data into a picture of where the pain sits. You do not need to build one.
- What they show: estimated clusters of liquidation prices above and below the current price, colored by size.
- How to use them: treat dense clusters as magnets and likely wick targets, and keep your stop away from the obvious band.
- What they are not: a crystal ball. The data is estimated from public positions, so read them as pressure, not certainty.
- Free and paid options exist across the popular derivatives-analytics sites. Any one of them beats trading blind to where the leverage is stacked.
How to avoid getting liquidated
Liquidation is a sizing problem wearing a leverage costume. Fix the size and the trigger moves out of reach.
| Move | How to do it | Why it protects you |
|---|---|---|
| Cut the leverage | Trade 3x to 5x, not 20x plus | Widens the gap to your liq price |
| Size by risk | Risk about 2% per trade, set size from the stop | Loss is capped before liquidation |
| Stop above the liq price | Place a stop inside the liquidation level | You exit on your terms, cheaper |
| Add collateral or trim | Post more margin or reduce size | Pushes the liq price further away |
| Prefer isolated margin | Assign per-trade collateral while learning | One trade can't drain the account |
| Skip crowded conditions | Avoid max size when funding and OI are extreme | Sidesteps the cascade fuel |
The single most useful habit is to size from the stop, not from the leverage slider. Decide the dollar risk first, then let it set the position.
- Risk a fixed slice, around 2%, on a $1,000 account that is $20 of risk per trade. Set your stop where the idea is wrong, then size the position so hitting that stop costs $20. This is the core of position sizing, and it makes the liquidation price irrelevant because your stop fires first.
- A trailing stop locks in profit on a winner without you widening the risk. Never widen a stop to dodge a liquidation, because that is how a small loss becomes a full one.
- Effective leverage is the number that matters, not the exchange maximum. Holding $2,000 of position on a $1,000 account is 2x effective leverage even if the platform allows 100x. The broker’s 100x is margin headroom, not a target.
Insurance funds and auto-deleveraging
When a liquidation closes worse than the bankruptcy price, someone covers the gap. Knowing the order protects you from a nasty surprise.
- Insurance fund: most exchanges keep a pool that absorbs the shortfall when a liquidation closes below the level where your collateral runs out. It is why you usually cannot go negative.
- Auto-deleveraging (ADL): if the insurance fund is drained during a violent cascade, the exchange closes profitable traders on the opposite side to settle the books. A winning trade can be cut short through no fault of yours.
- Negative-balance behavior: on most major venues the loss is capped at your collateral, but confirm it, because not every offshore platform offers it.
Which settings when
Match the leverage and margin mode to what you are actually doing. There is no prize for using the maximum.
| If you are | Sensible leverage | Margin mode |
|---|---|---|
| New to perpetuals | 2x to 3x | Isolated |
| Swing trading a trend | 3x to 5x | Isolated |
| Scalping with tight stops | up to ~10x, small size | Isolated |
| Hedging a spot book | low | Cross, watched |
| Chasing max leverage | not advised | n/a |
What to remember
The whole guide in three lines, if you keep nothing else.
- The liquidation price is arithmetic. Divide 1 by your leverage for the rough distance, then run the dollars before you enter. At 50x it sits on your doorstep.
- Cascades chase crowded leverage. Watch funding, open interest, and the heatmap, and keep your stop away from the obvious cluster.
- Survival is sizing, not prediction. Risk about 2%, run low effective leverage, use a stop inside the liquidation level, and start on isolated margin.
If you are still getting comfortable with leverage itself, the margin trading guide covers the mechanics underneath all of this, and it pairs naturally with everything here.
Glossary
- Liquidation: the exchange force-closing your leveraged position when its collateral can no longer cover the loss.
- Liquidation price: the price level where your loss reaches your usable collateral and the force-close fires.
- Leverage: position size divided by the margin you post, written like 10x.
- Margin: the collateral you post to open a leveraged trade.
- Maintenance margin: the minimum collateral you must keep, below which you are liquidated.
- Isolated margin: collateral assigned to one position, so only that position is at risk.
- Cross margin: your whole balance shared as collateral for open positions.
- Perpetual futures: a leveraged contract with no expiry that uses funding to track spot.
- Funding rate: the periodic payment between longs and shorts on a perpetual.
- Open interest: the total value of open contracts, a read on how much leverage is in play.
- Cascade: a chain of liquidations where forced selling triggers more forced selling.
- Auto-deleveraging (ADL): closing profitable opposite-side traders when the insurance fund cannot cover a shortfall.
FAQ
How does crypto liquidation work?
Crypto liquidation works by the exchange force-closing your leveraged position when your collateral can no longer cover the loss. You post margin to open a trade at, say, 10x leverage. As price moves against you, your loss eats into that margin. When your margin ratio falls to the maintenance level, the exchange automatically closes the position at the liquidation price. You do not get to choose the timing and you cannot cancel it. On perpetual futures there is often no warning like a forex margin call, the position simply closes, and any collateral assigned to it is gone.
What happens when you get liquidated in crypto?
When you get liquidated, the exchange closes your position at market and takes the collateral that backed it. On isolated margin you lose only the margin assigned to that trade; on cross margin the engine can draw from your whole balance. Most venues also charge a liquidation fee, so it costs more than closing yourself at the same price. On major exchanges an insurance fund covers any shortfall so you usually cannot go negative, but during a violent cascade the exchange may use auto-deleveraging to close profitable traders on the other side. In short, the trade ends, the loss is locked in, and you often pay a penalty on top.
How do you calculate liquidation price?
The rough distance to liquidation is 1 divided by your leverage. At 10x that is 0.10, or about a 10% adverse move; at 50x it is 0.02, or about 2%. Subtract the maintenance margin, often around 0.5%, to get a slightly closer real level. For a 10x long on Bitcoin entered at 60,000: 1 divided by 10 is 10%, minus 0.5% is 9.5%, so 60,000 times 0.095 is 5,700, and the liquidation price sits near 54,300. For a short it sits above entry, near 65,700. Fees and funding pull the level a little closer over time.
What is a liquidation price in crypto?
The liquidation price is the level where your open loss equals your usable collateral, so the exchange force-closes the position. It is set by your entry price, your leverage, and the maintenance margin. Higher leverage puts the liquidation price closer to your entry, which is why a 50x position can be liquidated on an ordinary daily move while a 5x position has far more room. You can calculate it before you enter, and every serious exchange displays it on the order ticket once you set your size and leverage.
How do you avoid liquidation in crypto?
Avoid liquidation by treating it as a sizing problem, not a prediction problem. Use low leverage, such as 3x to 5x, so the liquidation price sits far from your entry. Size each trade from your stop, risking a small fixed slice like 2% of the account, so the stop closes you long before the liquidation level. Always set a stop-loss inside the liquidation price and never widen it. Prefer isolated margin while learning so one trade cannot drain the account, add collateral or trim size if a position is stretched, and skip maximum size when funding rates and open interest are extreme.
What is a liquidation cascade?
A liquidation cascade is a self-reinforcing chain of forced closes. Price drops enough to liquidate the most over-leveraged longs, those forced sells hit the market as sell orders and push price lower, which reaches the next tier of liquidation prices and fires them too. Thin order books make each step larger, so a routine dip can become a sharp double-digit candle in minutes before snapping back once the leverage is flushed. Short cascades work in reverse and can feed a short squeeze. Cascades are why leverage clusters act like magnets that price reaches for.
Can you lose more than your deposit when liquidated?
On most major exchanges, no. An insurance fund absorbs the gap when a liquidation closes worse than the point where your collateral runs out, so your loss is capped at the collateral backing the trade. On isolated margin that is the margin you assigned; on cross margin it can be your whole balance. That said, not every offshore venue offers negative-balance protection, and in extreme cascades an exchange may use auto-deleveraging, so confirm your platform's policy before trading size.
What leverage is safest to avoid getting liquidated?
Lower is safer because it moves your liquidation price further from your entry. For beginners on perpetuals, 2x to 3x is sensible; 3x to 5x suits swing trades on a trend. What matters more than the slider is your effective leverage, which is total position size divided by account size. Holding 2,000 of position on a 1,000 account is 2x effective leverage even if the exchange allows 100x. The high maximum is margin headroom, not a target, and pairing low effective leverage with a proper stop is what actually keeps you out of the liquidation queue.
What do the key liquidation terms mean?
Liquidation: the exchange force-closing a leveraged position when collateral cannot cover the loss. Liquidation price: the level where the loss equals your usable collateral. Leverage: position size divided by posted margin. Margin: the collateral you post. Maintenance margin: the minimum collateral you must keep before being liquidated. Isolated margin: collateral assigned to one position. Cross margin: the whole balance shared as collateral. Funding rate: the periodic payment between longs and shorts on a perpetual. Open interest: the total value of open contracts. Cascade: a chain of liquidations feeding on itself. ADL: auto-deleveraging, closing profitable opposite-side traders when the insurance fund falls short.
🌍 Our recommended brokers


Reader Reviews
Be the first to review this — tell other traders what actually helped, or where it fell short.
Leave a Review

Forex Analyst & Senior Trader
Former FX desk trader with 8 years in institutional forex. Works in multi-timeframe analysis and order flow, turning desk experience into systematic, testable rules across forex and metals.