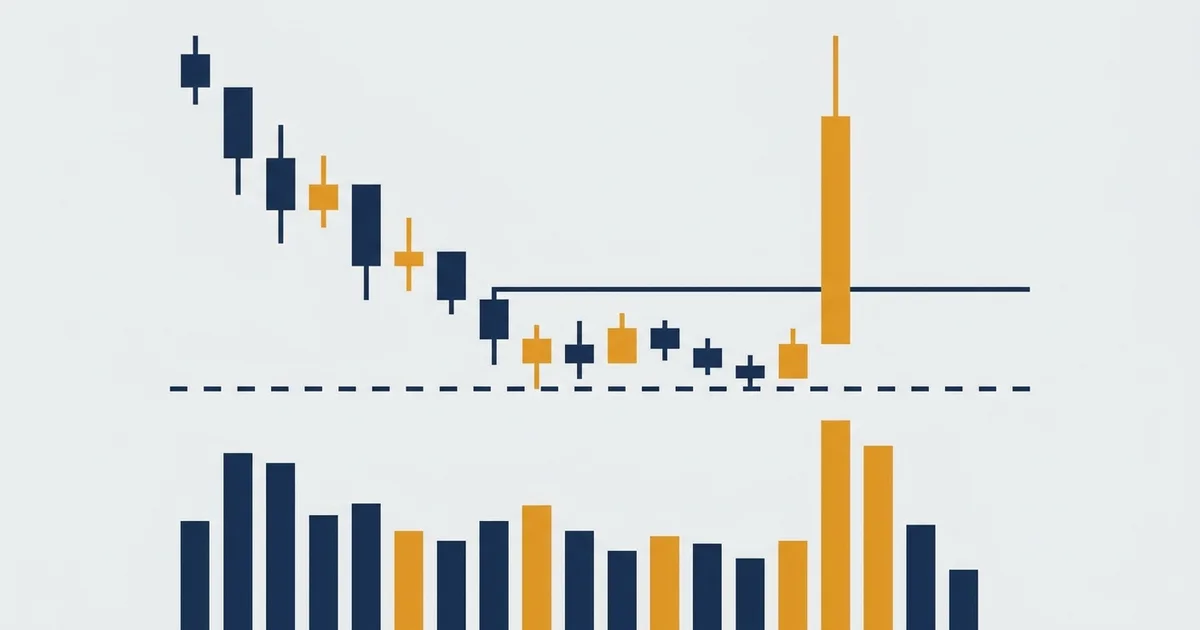

What a short squeeze actually is
A short squeeze is not a chart pattern, it is a scramble. Bearish traders who sold short get trapped by a rising price and are forced to buy back in a hurry, and that forced buying is what spikes the market.
The clearest way to see it is the four-phase shape below.
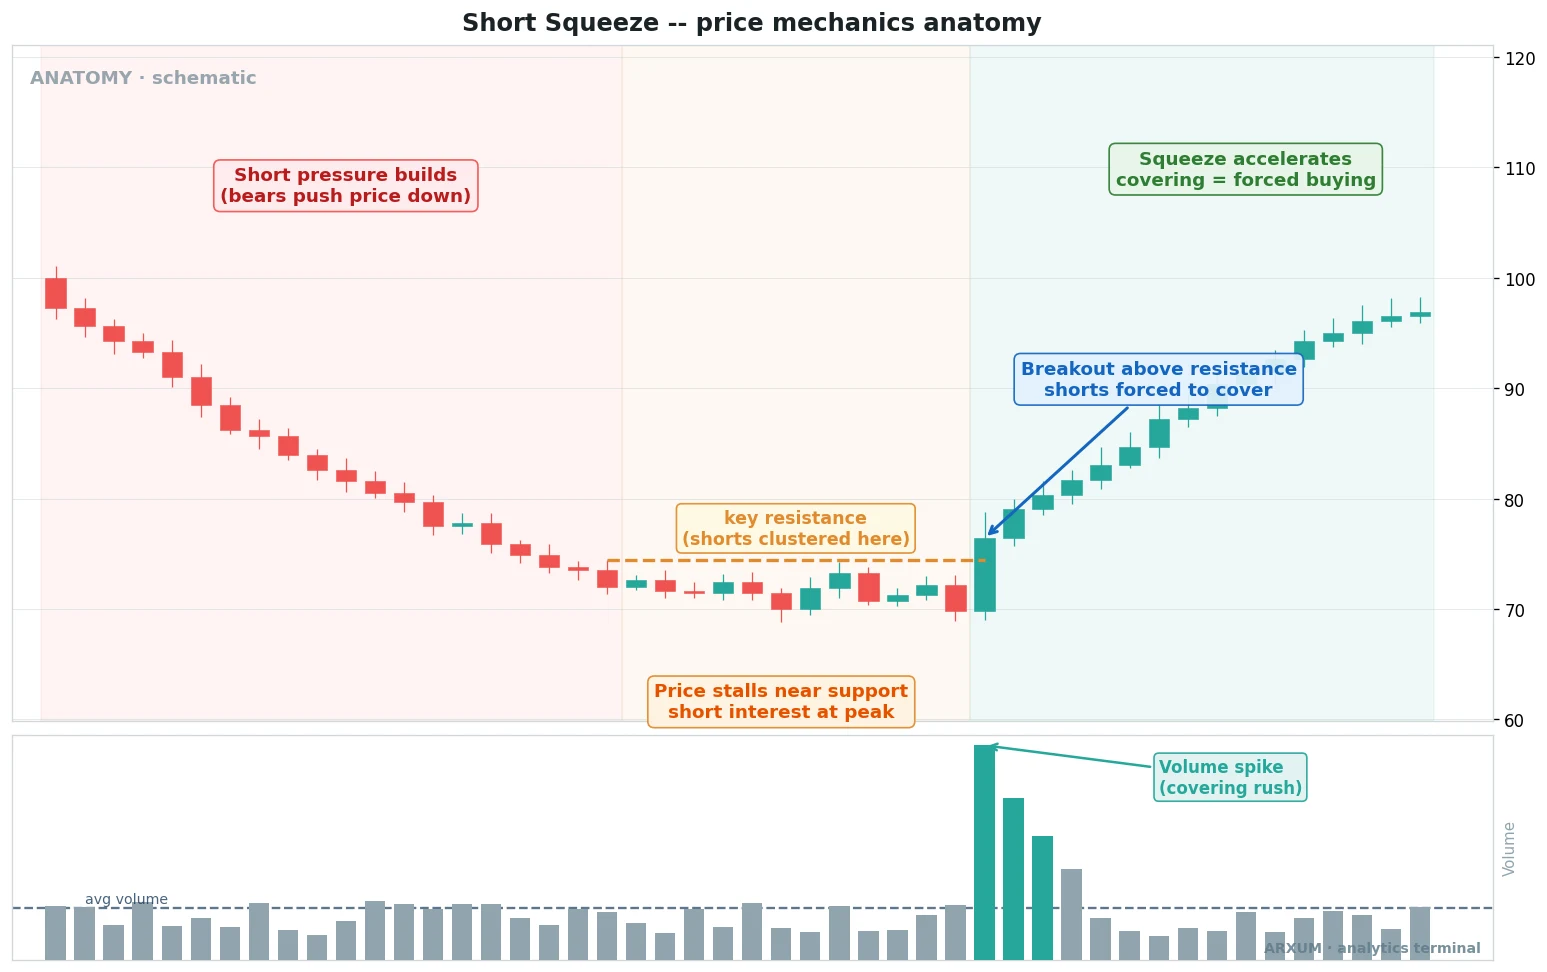
Reading the chart left to right:
- Short pressure builds: bears keep selling and price grinds lower. This is the red zone, where the crowd is convinced the drop continues.
- Price stalls near support: the fall runs out of steam and price flattens. Short interest, the total amount bet against the market, is now at its peak. Everyone who wanted to be short already is.
- The breakout: price pops above the key resistance line where the shorts were clustered. Their trades are now underwater, and the first ones start buying to close.
- The squeeze accelerates: covering is forced buying, and forced buying lifts price, which traps the next batch of shorts. The green zone is the self-feeding loop, and the volume spike underneath is the covering rush hitting the tape.
The core idea: a normal rally is buyers who want in. A short squeeze is sellers who are desperate to get out.
That desperation is why the candles go near vertical.
The forced-buying loop, in plain terms
Short squeeze explained as a chain reaction, one step at a time:
| Step | What happens | Why it matters |
|---|---|---|
| Shorts pile in | Many traders sell borrowed units expecting a drop | A crowd of buy-backs is now waiting overhead |
| Price turns up | A catalyst or a breakout stops the fall | Every short is now losing money on paper |
| First shorts cover | Losing traders buy to close their positions | Their buying is fresh upward pressure |
| Price rises more | The covering itself lifts the market | The next tier of shorts is now underwater too |
| Cascade | Covering forces covering forces covering | The near-vertical spike, until shorts run out |
The move ends when there are no trapped shorts left to force out. After that the fuel is gone, and squeezes often give back a big chunk of the spike fast.
That reversal is the part that hurts late buyers.
The ingredients that set one up
You cannot squeeze a market that nobody is short. A real short squeeze needs a specific setup, and knowing how to identify a short squeeze starts with checking for these ingredients.
| Ingredient | What to look for | Where to check it |
|---|---|---|
| High short interest | A large share of the float sold short, or heavy negative funding in crypto | Short-interest data, crypto funding rates |
| A crowded price level | Clear resistance where stops and shorts cluster | The chart, prior swing highs |
| A catalyst | News, earnings, a data print, a whale bid | Calendar, headlines, order flow |
| Thin liquidity | Few resting sellers above resistance | Low-volume zones, off-session hours |
| A trigger break | Price closes above the crowded level | The breakout candle itself |
- Short interest is the fuel: no trapped shorts, no squeeze. In stocks this is the short-float percentage, in crypto it is persistently negative funding, which means shorts are paying to stay short.
- The crowded level is the trigger point: shorts and their stop orders sit just above an obvious resistance, so a break there sets off a chain of forced buys.
- The catalyst is the match: something has to turn price up in the first place. Without it, high short interest just sits there.
- Thin liquidity is the accelerant: when there are few natural sellers above resistance, each buy-back moves price further, so the squeeze runs hotter.
Rule of thumb: treat the ingredients as a checklist. One alone means little.
Stacked together, they mean a market is primed.
Read one: momentum flips from bearish to bullish
The ingredients tell you a squeeze is possible. Momentum tells you it has started.
The simplest read is the RSI crossing back up through its midline as sellers give up.
RSI is a momentum gauge that runs from 0 to 100, and the 50 line is the divider between bearish and bullish momentum.
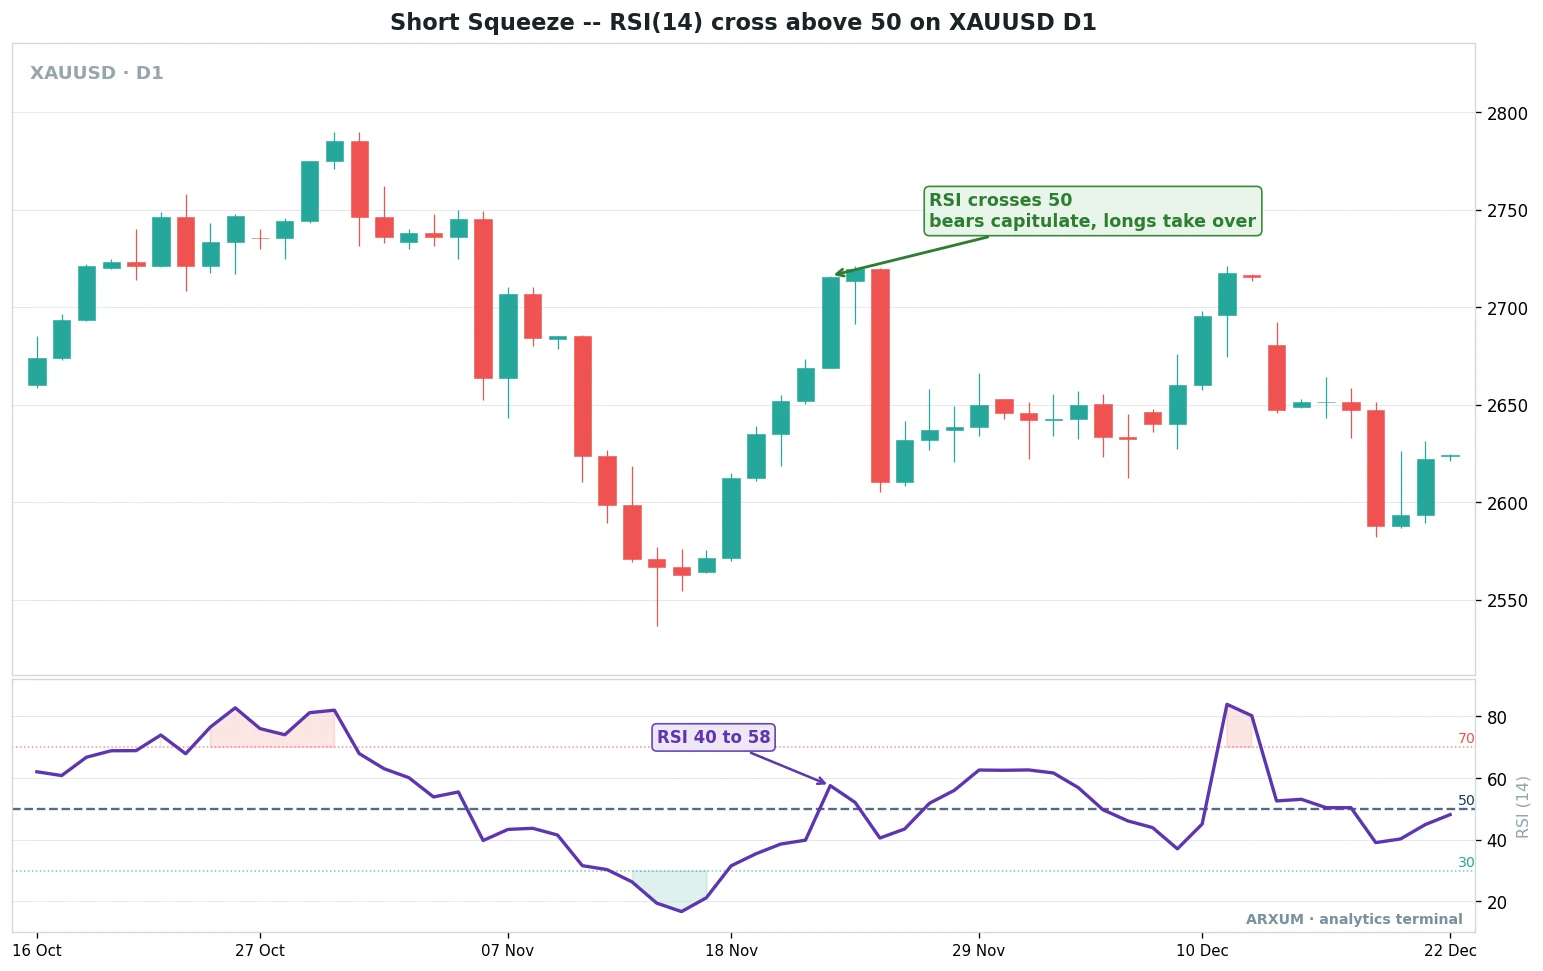
What the labels mean:
- The lower panel is RSI with a length of 14, the standard. The purple line is momentum on spot gold.
- The 50 line is the midpoint. Below it, sellers own the move. A cross back above it means buyers have taken control, which is exactly what forced covering does.
- The 70 and 30 lines mark overbought and oversold. A squeeze often runs momentum from oversold up through 50 in a straight line.
- The green arrow marks RSI pushing from 40 to 58 and clearing 50. That flip, not the price high, is the tell that bears are capitulating.
A momentum flip like this suits slower charts, where the daily read filters out intraday noise.
| Role | How you use it | Best read |
|---|---|---|
| Entry trigger | RSI(14) crossing up through 50 after a downtrend | Daily / 4-hour, gold and FX |
| Trend read | Momentum flipping from below 50 to above it | Daily, any instrument |
| Confirming gauge | The cross backs up a price break over resistance | Daily, at the breakout level |
| Filter | Skip the long while RSI is still pinned under 50 and falling | Daily, before the flip |
| Exit cue | RSI rolling back down through 50 after a spike | Daily / 4-hour, after the run |
Rule of thumb: the midline cross confirms the story the price is telling. It does not predict the squeeze, it verifies the shorts are actually losing the fight.
Read two: a volume spike as shorts rush the exit
Forced covering is a stampede, and a stampede leaves a footprint on volume. The second read is relative volume, or RVOL, spiking far above its own average as the shorts bail at once.
This is the classic crypto short squeeze tell, where funding flips and leveraged shorts get flushed.
RVOL compares current volume to the recent average, so 1.0x is a normal bar and 2.5x is two and a half times the usual activity.
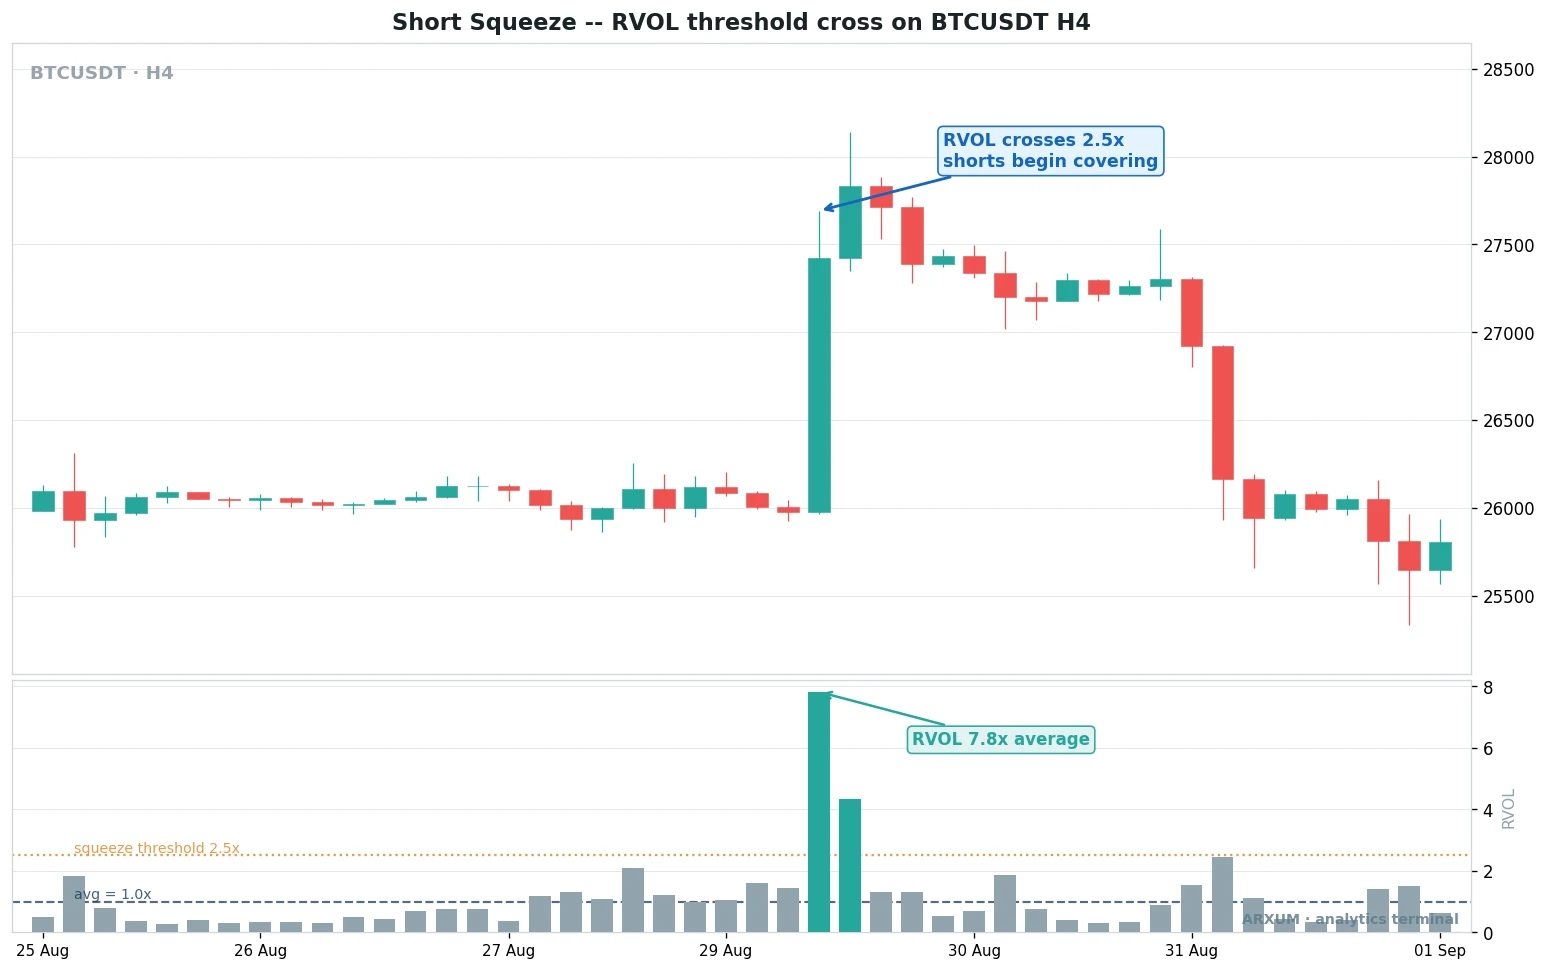
What the labels mean:
- The lower panel is RVOL, current volume divided by its recent average. The dashed line at 1.0x is a normal, average bar.
- The dotted line at 2.5x is the squeeze threshold. Volume crossing it means something violent is happening, not routine trading.
- The tall green bar at 7.8x is the covering rush, nearly eight times the usual volume packed into one bar as shorts pile out together.
- The price panel shows the matching candle, a wide green body where the buy-backs land. The spike and the candle are the same event seen two ways.
Volume reads shine on faster charts, where a squeeze bar stands out sharply against the quiet ones around it.
| Role | How you use it | Best read |
|---|---|---|
| Entry trigger | RVOL crossing 2.5x on a break above resistance | 4-hour / 1-hour, crypto |
| Conviction read | The higher the spike, the more forced the buying | Any timeframe, any market |
| Confirming gauge | A volume surge backs up a momentum flip | 1-hour, at the breakout |
| Filter | Ignore breakouts that happen on flat, sub-1x volume | All timeframes |
| Warning | Volume drying up after the spike means the fuel is spent | 4-hour, after the run |
Rule of thumb: price can lie, a fake break drifts up on thin volume. A squeeze cannot hide, forced covering always shows up as a volume bar that dwarfs its neighbours.
Pair it with the volume read for a fuller picture.
Where short squeezes happen, market by market
The same mechanic ports across every market that lets people go short, but the fuel gauge and the character differ. Go wide on the ingredient that matters for each.
| Market | Fuel gauge | Character |
|---|---|---|
| Meme and small-cap stocks | Short-float percentage | The wildest, days-long, headline-driven |
| Crypto (BTC, alts) | Negative funding, liquidation heatmaps | Fast, leverage-fuelled, 24/7 |
| Gold (XAU/USD) | Positioning, momentum extremes | Slower, cleaner, driven by macro news |
| Forex majors | Commitment of Traders, funding | Rare and shallow, deep liquidity absorbs it |
- Meme stocks are the textbook: a tiny float with a huge short position is the perfect setup, which is why these squeezes go parabolic and make the news.
- Crypto squeezes are the fastest: leverage is everywhere and it never closes, so negative funding plus a catalyst can flush shorts in hours, not days.
- Gold squeezes are the tamest: no single float to corner, but crowded short positioning into a macro surprise can still spark a sharp momentum run, like the RSI flip above.
- Forex is the hardest to squeeze: the market is so deep that forced covering gets absorbed. You see pressure, rarely a clean vertical spike.
Rule of thumb: match your read to the market. Short-float for stocks, funding for crypto, momentum and positioning for gold and forex.
Reading it across timeframes
A squeeze looks different depending on the chart you watch it on. Slow charts frame it, fast charts time it.
| Timeframe | What it shows | Best use |
|---|---|---|
| Daily / weekly | The short-interest build and the resistance ceiling | Decide if a squeeze is even possible |
| 4-hour | The momentum flip and the first volume surge | Position for the break |
| 1-hour / 15-min | The exact covering candle and the reversal | Time the entry and the exit |
- Set the context on the daily: this is where you spot the crowded level and the falling market that traps shorts in the first place.
- Position on the 4-hour: the RSI cross and the first big RVOL bar tend to print here, giving you a workable heads-up.
- Time on the fast chart: the 1-hour or 15-minute shows the vertical candle and, just as important, the moment it stalls and rolls over.
Which read tells you what
The two reads answer different questions, and they are strongest together. One is the story, the other is the proof.
| Question | Read | Yes looks like |
|---|---|---|
| Has momentum flipped? | RSI(14) cross | RSI pushing up through 50 |
| Is the buying forced? | Relative volume | RVOL crossing 2.5x its average |
| Is it a real squeeze? | Both together | The cross and the spike on the same break |
How to weigh them:
- Both aligned: the strongest signal. Momentum has flipped and the volume proves the covering is forced, not casual. This is a real squeeze, not a drift.
- Momentum only: price is turning up but on quiet volume. It could be a slow reversal, not a squeeze. Smaller, and be ready to be wrong.
- Volume only: a huge bar with no clean momentum flip can be a news blip that fades. Wait for RSI to confirm.
- Neither: there is no squeeze. Whatever is moving, it is not trapped shorts. Leave it alone.
What actually works
The short version you can carry:
- Check the fuel first. No high short interest or negative funding means no squeeze, whatever the chart looks like. Confirm the shorts are actually there.
- Mark the crowded level. Find the resistance where shorts and stops cluster. The squeeze starts the moment price closes above it, not before.
- Wait for both reads. An RSI(14) cross up through 50 plus RVOL crossing 2.5x on the same break is the real thing. One without the other is a maybe.
- Respect the reversal. Squeezes end when the trapped shorts run out, and then they give back fast. The spike is not a new uptrend, it is a flush.
- Do not chase the vertical candle. The easy money is already gone by the time it goes near-vertical. Late buyers become the next batch of trapped traders.
How to trade it without getting trapped
A short squeeze is a knife with two edges, and the wrong side of it is brutal. The discipline here is not optional.
- Enter on the break, not the spike. The lower-risk entry is the close above the crowded resistance, with a stop back below the base. Chasing the third vertical candle puts your stop miles away.
- Size for a violent reverse. Squeezes can round-trip the whole move in a session. Risk a small, fixed slice of the account per trade so one snap-back does not hurt, and let the reward-to-risk be worth it before you click.
- Plan the exit before the entry. Decide where you take profit up front. Trailing a stop under the fast chart is often better than a fixed target, since you never know how far a squeeze runs.
- Never short into one. Trying to pick the top of a live squeeze is how accounts blow up. If you are already short and it fires, cover, do not add.
- Only commit money you can afford to lose. This is one of the most violent moves in trading. Treat every squeeze as odds, not a sure thing.
The reads shift the odds in your favour when they stack up. They do not remove the risk, and a squeeze punishes anyone who confuses a spike for a trend.
Pull the reads up yourself
You can rebuild both reads for free in a couple of minutes. The exact indicator names matter, since charting tools carry look-alike variants.
- On TradingView: load your market, hit the Indicators button, and add Relative Strength Index, length 14, for the momentum cross. For the volume read, add Relative Volume at Time or the simpler Volume with its moving average turned on, then watch for bars far above the average.
- On MT4 or MT5: use Insert -> Indicators -> Oscillators for RSI, period 14. Volume sits under Insert -> Indicators -> Volumes, though relative-volume readings are cleaner on TradingView.
- The 2.5x squeeze threshold is not a one-click line. Eyeball it against the average, or search a community RVOL script that draws the threshold for you.
- Short interest and funding live off the chart. Stock short-float sits on data sites, crypto funding rates on the exchange or an aggregator. Check them before you trust any breakout.
Rule of thumb: match the settings exactly. A different RSI length or the wrong volume average will draw a different line and give you a different call.
Common mistakes
- Buying the story, not the setup. A stock trending on social media is not a squeeze until the short interest and the chart agree. Check the fuel gauge.
- Chasing the vertical candle. The move most people notice is the move that is almost over. Entering there means your stop is enormous and the reverse is due.
- Ignoring volume. A breakout on thin volume is a fake, not a squeeze. Forced covering always brings a volume surge, so no surge means no squeeze.
- Confusing a squeeze with a trend. A squeeze is a flush, not the start of a bull run. Holding for a new uptrend usually means giving the spike back.
- Shorting the top. Trying to fade a live squeeze is the single fastest way to a margin call. Wait for it to exhaust, do not stand in front of it.
- Forgetting it ends. The same forced buying that lifts price disappears the instant the shorts are gone. Plan your exit before that happens.
Glossary
- Short squeeze: a fast rally caused by short sellers being forced to buy back their positions as price rises against them.
- Short selling: borrowing a unit, selling it, and aiming to buy it back cheaper. A short profits when price falls.
- Short interest: the total amount currently sold short. High short interest is the fuel a squeeze needs.
- Short covering: a short seller buying back to close the position. In a squeeze this buying is forced and self-feeding.
- Funding rate: in crypto, a periodic payment between longs and shorts. Persistently negative funding means shorts are crowded.
- RSI: a momentum gauge from 0 to 100. The 50 line separates bearish from bullish momentum.
- RVOL: relative volume, current volume divided by its recent average. 1.0x is normal, above 2.5x is a spike.
FAQ
What is a short squeeze, in plain terms?
It is a sharp, fast rally that happens when traders who bet on a market falling are forced to buy back in a hurry. Their buying pushes price up, which forces even more of them to buy, so the move feeds on itself until the shorts are flushed out.
How does a short squeeze happen?
It needs a market with heavy short interest sitting under a crowded resistance level, then a catalyst that turns price up. The first shorts start covering, their buying lifts price, the next tier of shorts is now losing too, and the covering cascades into a near-vertical spike.
How do you identify a short squeeze forming?
Check the ingredients first: high short interest or negative crypto funding, a clear resistance level where shorts cluster, and thin liquidity above it. Then watch two reads on the chart, RSI crossing up through 50 and relative volume spiking past 2.5x on the break. When the ingredients and both reads line up, a squeeze is likely underway.
How do you trade a short squeeze?
Enter on the close above the crowded resistance, not on the vertical candle, with a stop back below the base. Size small because squeezes reverse violently, and plan your exit up front, often a trailing stop rather than a fixed target since you cannot know how far it runs. Never try to short a live squeeze.
How do you spot a short squeeze before it happens?
You cannot call the exact moment, but you can find the setup early. Markets with very high short interest or deeply negative funding, pressed up against a tested resistance, are primed. Mark that level and wait. The break above it with a volume surge is your trigger, the earliest reliable sign the squeeze has started.
What is a crypto short squeeze?
It is the same mechanic driven by leverage instead of borrowed shares. When funding rates are deeply negative, shorts are crowded and paying to stay short. A move up liquidates them, and those forced buy-backs spike the price. Crypto squeezes are the fastest because leverage is everywhere and the market never closes.
How long does a short squeeze last?
There is no fixed length. Crypto squeezes can burn out in hours, meme-stock ones can run for days. The one constant is that they end when the trapped shorts run out of positions to cover, and the reversal after that is usually fast.
Do short squeezes happen in forex and gold?
They do, but they are milder. Forex majors are so deep that forced covering gets absorbed rather than spiking. Gold can run sharply when short positioning is crowded into a macro surprise, which shows up as a clean momentum flip rather than a meme-stock style parabola.
What is the difference between a short squeeze and a normal rally?
A normal rally is buyers who want to be in. A short squeeze is sellers who are desperate to get out. That desperation, the forced covering, is why squeeze candles go near vertical and why they reverse so hard once the shorts are gone.
Can I use just one signal to spot a squeeze?
It is risky. A momentum cross alone can be a slow reversal, and a volume spike alone can be a news blip that fades. The value is in the agreement, RSI crossing 50 and RVOL crossing 2.5x on the same break, which is what separates a real squeeze from a false move.
🌍 Our recommended brokers


Reader Reviews
Be the first to review this — tell other traders what actually helped, or where it fell short.
Leave a Review

Momentum Trader & Technical Analyst
Trades momentum across crypto and forex since 2019, built around RSI, MACD, and volume. Turns discretionary setups into rule-based, systematic entries and validates them on data before they go live.