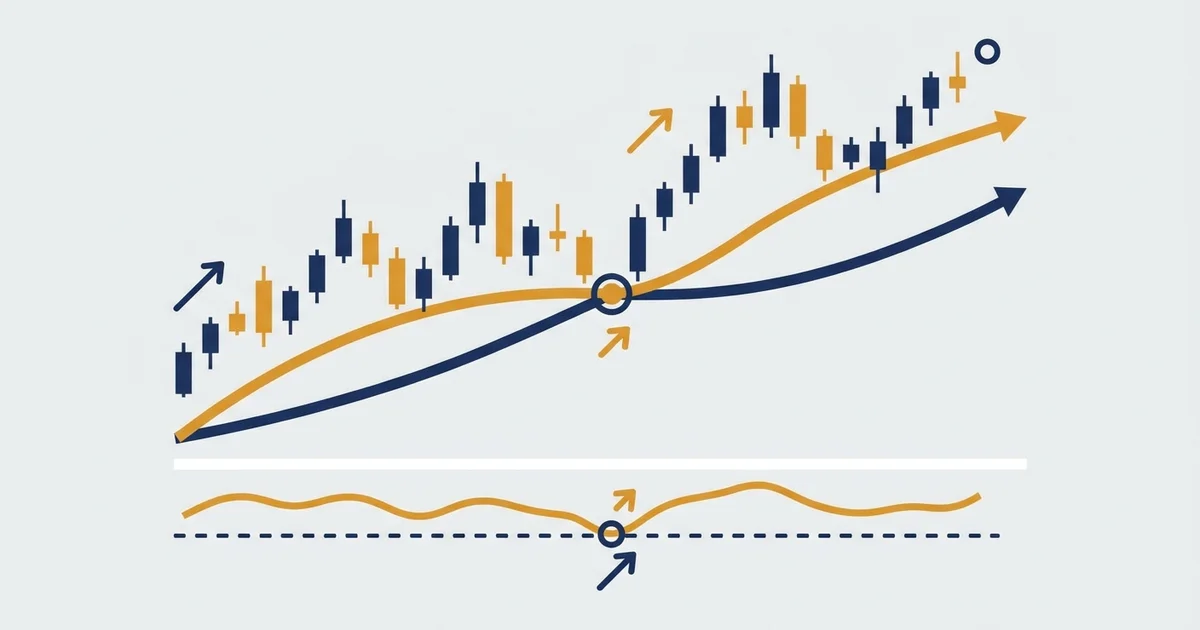

What a bull market actually is
A bull market is a market in a lasting climb, not a good week or a quick bounce. The clean, widely quoted line is a rise of 20% or more from a recent low that sticks.
The plainest way to see it is the distance between price and its own peak, drawn under the chart, and watching that gap heal.
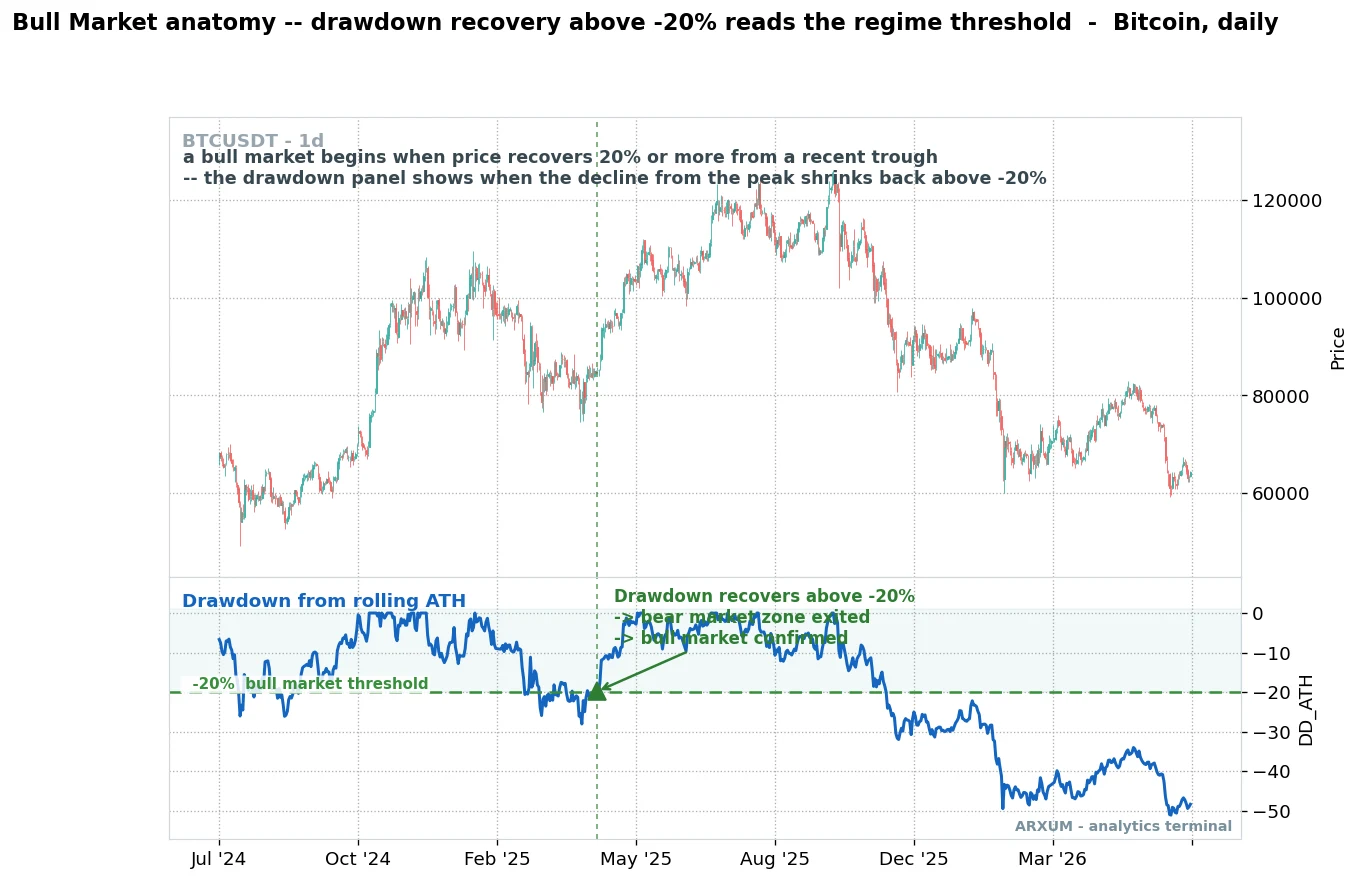
What the chart is showing:
- The top panel is price. The bottom panel is the drawdown, how far price sits below its highest point so far, in percent.
- The dashed line at minus 20% is the regime threshold. Below it and holding is a bear market, back above it is bull territory.
- The dashed vertical line marks the moment the drawdown recovers above minus 20%. That reclaim is the point the market flips from fear to trend.
- The read: a bull market is easiest to define off a low. Price climbing 20% off its trough and refusing to give it back is a change of regime, not a relief rally.
Notice the right side of that same panel rolls back under minus 20% later. That is the honest lesson up front: no regime is permanent, and a bull market runs until it does not.
The bands most desks watch are simple and worth keeping in your head:
| Move off the low | Name | What it usually means |
|---|---|---|
| Under 10% | Bounce | Noise inside the bigger picture |
| 10% to 20% | Rally | Hopeful, can still fail |
| 20% or more, holding | Bull market | Regime change, trend is up |
| 100%+ (common in crypto) | Full bull run | Parabolic, cycle in force |
The 20% figure is a convention, not a law. It matters because it is the number the whole market agrees to watch, so behaviour shifts once price clears it.
Bull market vs bear market
The two regimes are opposites in structure, not just direction. Knowing which one you are in decides whether you buy the dips or sell the rallies, and it is the first question worth answering before any trade.
| Feature | Bull market | Bear market |
|---|---|---|
| Trend | Higher highs, higher lows | Lower highs, lower lows |
| Price vs 200-day | Above and rising | Below and falling |
| Dips | Get bought | Get sold |
| Momentum (RSI) | Holds above 50 | Stalls under 50 |
| Crowd mood | Greed, FOMO | Fear, denial |
| What works | Buy dips, breakouts, hold | Short rallies, cash, defence |
The one line worth carrying:
- In a bull market you buy weakness. Dips are discounts because the trend keeps rescuing them.
- In a bear market you sell strength. Rallies are exits because the trend keeps swallowing them. The full mirror image lives in the bear market guide.
- The regime, not the setup, decides. The same breakout that pays in a bull fails in a bear. Read the regime first, then pick the trade.
The phases a bull market moves through
A bull market is a sequence, not one straight line. It tends to move through the same four stages, and knowing the stage tells you what to expect and how greedy to be.
| Phase | What happens | The tell |
|---|---|---|
| Accumulation | Smart money buys the lows while the crowd is scared | Price bases, higher lows form |
| Markup | The trend gets going and the crowd starts to notice | Golden cross, RSI holds 50 |
| Euphoria | Everyone piles in, FOMO peaks, price goes vertical | Parabolic move, overbought, hype |
| Distribution | Smart money sells the top to late buyers | New highs fail, breadth thins |
How to think about each stage:
- Accumulation is dull and scary at once. The Wyckoff idea of quiet buying while the news is still bad lives here.
- Markup is where the easy money is. The trend is confirmed, dips get bought, and this is the stage the three reads below are built to catch.
- Euphoria feels like genius and is usually late. Parabolic price and everyone bullish is when risk is highest, not lowest.
- Distribution is the top forming in slow motion. The bull does not ring a bell, it just stops making new highs.
Three reads that confirm a bull market
You do not need a magazine cover to tell you the trend turned up. Three chart reads, stacked from slow to fast, do the job: the drawdown recovery you already saw, the golden cross, and momentum holding above its midline.
One alone can fool you, so the value is in agreement.
The golden cross: the long averages turn up
The most watched structural signal is the golden cross, when the 50-day moving average rises above the 200-day. A moving average is just the average price over a window, so the 50-day tracks the medium trend and the 200-day tracks the long one.
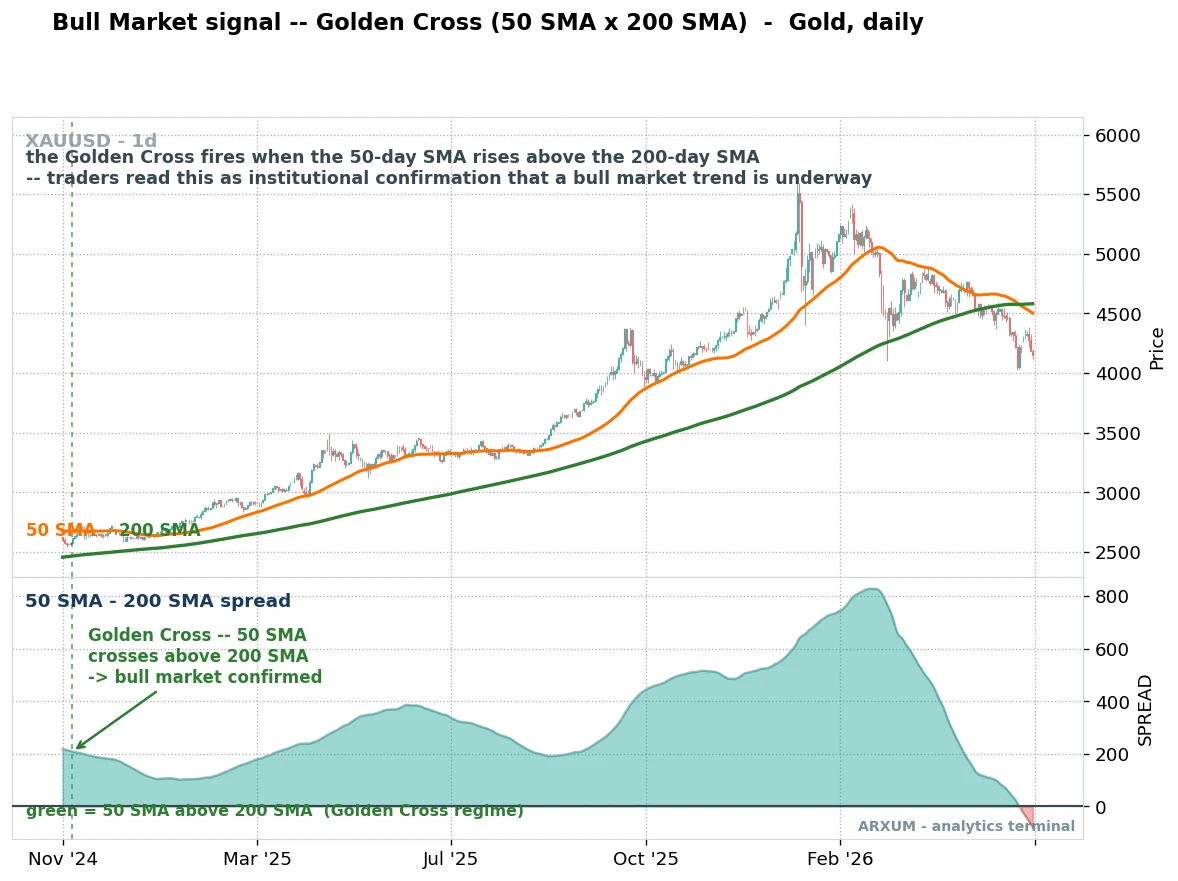
What the labels mean:
- The orange line is the 50-day average, the medium trend. The green line is the 200-day, the long trend.
- The lower panel is the gap between them. Filled and above zero means the 50-day is on top and the trend is up. That is the golden cross regime.
- The dashed vertical line marks the cross itself. Once the spread turns positive and stays positive, the long trend has flipped up.
- The read: the golden cross is slow and lags the low, so it will not call the exact bottom. What it does well is confirm an uptrend is real rather than a bounce, which is exactly what you want before you commit to the long side. Full mechanics live in the golden cross guide.
| Role | How you use it | Best read |
|---|---|---|
| Regime read | 50-day above 200-day = bull structure | Daily, any market |
| Trend filter | Only take longs while the spread is positive | Daily, all instruments |
| Confirmation | Backs up a drawdown already healed above 20% | Daily, stocks and gold |
| Weakness | Lags the low, whipsaws in a range | Avoid in choppy markets |
Rule of thumb: the golden cross confirms a bull, it does not predict one. Treat it as proof the trend is up, not as your entry timer.
RSI holding above 50: momentum stays bullish
The fast read is momentum. RSI is a gauge that runs from 0 to 100 and measures how strong recent moves are.
Above 50 is bullish momentum, below 50 is bearish. In a bull market RSI keeps defending that midline on pullbacks.
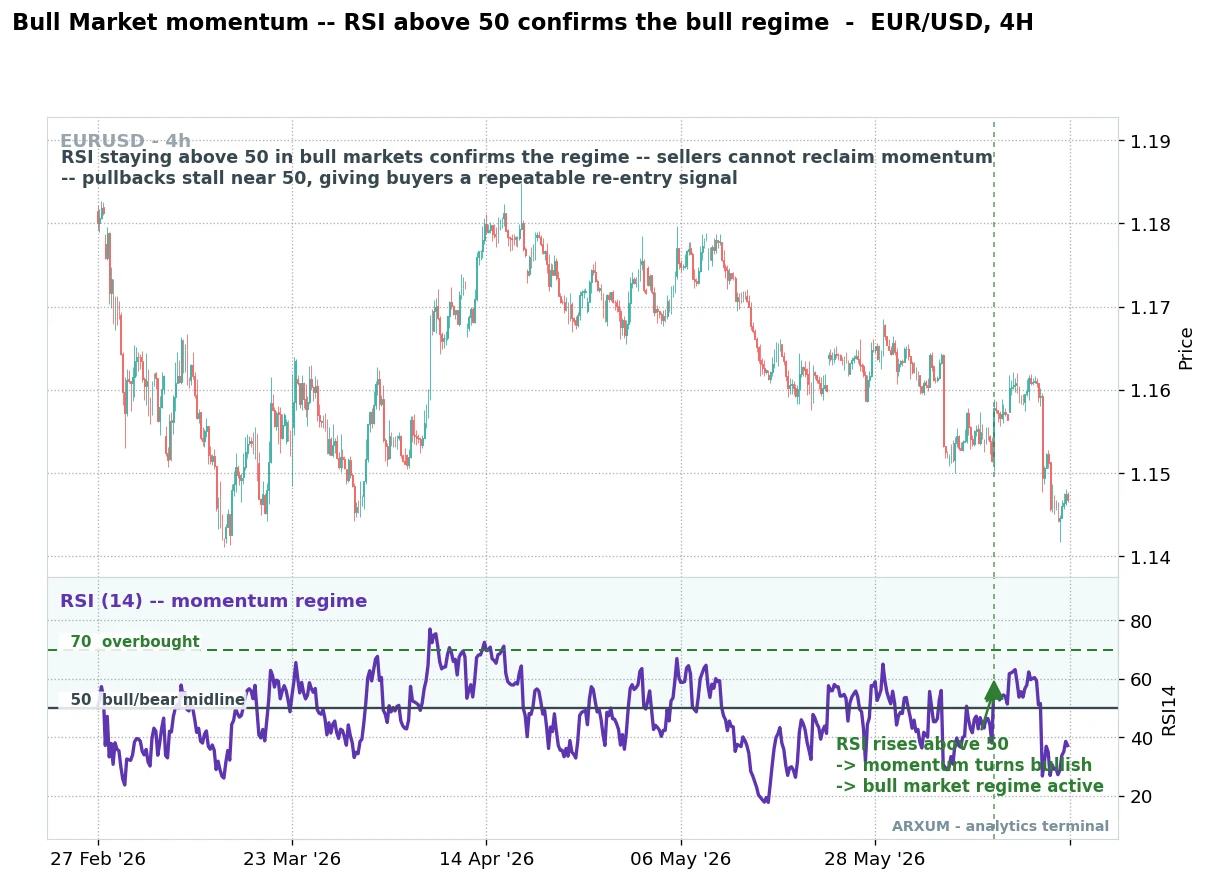
What the labels mean:
- The purple line in the lower panel is RSI. It rises when buyers are strong and falls when sellers take over.
- The 50 line is the neutral middle. In a bull market, pullbacks push RSI down toward 50 and then bounce, instead of breaking through it.
- The 70 line is the overbought mark. In an uptrend price can sit overbought for a long time, so 70 is not a sell button.
- The read: the tell is not one push above 50, it is the refusal to lose it. Each dip that holds 50 is a place buyers step back in. See the RSI guide for the full picture.
| Role | How you use it | Best read |
|---|---|---|
| Momentum read | RSI floored above 50 = bulls in control | Daily, any market |
| Re-entry cue | A dip that holds 50 = buy the pullback | Daily and 4-hour |
| Trap warning | Overbought over 70 can stay there for weeks | Do not short on 70 alone |
| Turn hint | RSI finally losing 50 = momentum shifting | Early distribution signal |
Rule of thumb: in a bull market the 50 line is the floor, not the ceiling. Dips that hold it are the trade, not the top.
The three reads, stacked
| Question | Read | Bull looks like |
|---|---|---|
| How far off the low? | Drawdown recovery | Up 20% or more, holding |
| Is the long trend up? | 50/200 golden cross | 50-day above 200-day, spread positive |
| Is momentum bullish? | RSI midline | RSI holding above 50 |
How to weigh them:
- All three agree: the cleanest bull signal. Price recovered off the low, golden cross confirmed, RSI holding above 50. Trade the long side and treat dips as entries.
- Recovery only: a fast 20% climb with no golden cross yet. Could be a bear-market rally that rolls over. Stay interested, not all-in.
- Golden cross without momentum: the structure is up but RSI keeps failing at 50. Often a slow, grinding trend rather than a clean one.
- RSI losing 50: the first crack in the bull case. One read turning is not the exit, but it is where you start watching for distribution.
How a bull market looks across the markets
A bull market is not only a stock or crypto event, but it wears a different face in each market. The 20% rule fits assets with a clear price history and a defined low.
Forex and gold are read more through trend and risk appetite than a fixed percentage.
| Market | Bull trigger | How it behaves | Where the money goes |
|---|---|---|---|
| Stocks, indices | Up 20% from the low | Steady grind, higher highs | Growth, leaders, breadth |
| Crypto | 20% is just the start | Explosive, measured in multiples | Bitcoin first, then alts |
| Gold (XAU/USD) | Trend, real yields, demand | Long, steady uptrend | The metal itself |
| Forex majors | Risk-on flow, not a 20% rule | Higher-beta currencies firm | Risk currencies, carry |
The differences that matter:
- Crypto bulls are bigger and faster. A stock bull of 20 to 40% is a strong year, while Bitcoin can run several times over, and the alt cycle stretches it further. More on that rotation in the altcoin cycle guide.
- Gold trends on its own drivers. It climbs on falling real yields and steady demand, and it can run a long bull even while stocks wobble. If you trade the metal, the gold trading guide covers the setups.
- Forex has no all-time high to rise from. You read a Forex bull as risk-on flow, where higher-yielding and higher-beta currencies firm up because traders are willing to reach for return.
- Leaders confirm the bull. A healthy uptrend has broad participation, not one name doing all the work. When only a handful of leaders hold up, the bull is getting tired.
What past bull markets looked like
Every bull market has its own fuel, but they rhyme. Naming them by what happened rather than by date makes the shared pattern clear.
| Bull market | What fuelled it | How it felt |
|---|---|---|
| The long tech bull | Cheap money and tech growth | Slow, steady, years long |
| The post-crisis recovery | Rate cuts and stimulus | Grinding climb off the lows |
| The pandemic rebound | A flood of liquidity | Fast, vertical, everything up |
| The crypto bull run | Halving and adoption cycles | Parabolic, up several multiples |
The lessons that repeat across all of them:
- The best gains come early and quietly. Most of the return was made in accumulation and early markup, before the crowd believed it.
- The scariest dips came inside the bull. Even strong uptrends threw 20 to 30% pullbacks that felt like the end, then resumed. They shook out more traders than the top did.
- Liquidity is the fuel. The strongest bulls ran while money was cheap and easy, and they cooled when that tightened.
- The top is a process, not a day. Almost none of them ended on a single candle. Price churned at highs while distribution did its work.
What actually works in an uptrend
You do not have to overthink a bull market, but you do have to respect it. The whole game shifts from dodging danger to riding a trend without giving it all back.
| Approach | How it works | Main risk |
|---|---|---|
| Buy the dips | Add on pullbacks to support or the 50-day | The one dip that keeps going |
| Trend and breakouts | Ride higher highs, buy the breakout | Whipsaw in a range |
| Buy and hold | Sit in the trend and let it compound | Round-tripping gains at the top |
| Momentum rotation | Rotate into the strongest leaders | Chasing extended moves |
| Dollar-cost averaging | Investors add fixed amounts over time | Slow, needs a long horizon |
How to run each one:
- Buy dips, do not chase green candles. The cleanest bull trade is buying a pullback that holds support or the 50 line, with a stop below the swing low. A trailing stop lets the winner ride as the trend continues.
- Trade the breakout with the trend. In a bull, a break to new highs tends to follow through, so a breakout in the direction of the trend has the odds behind it.
- Let winners compound, but plan the exit. Buy and hold works in a bull, right up until distribution. Decide in advance what would tell you the regime changed.
- Rotate toward strength, carefully. Momentum works while the trend is intact, but chasing a name that already went vertical is how late buyers get trapped.
- Average in if your horizon is long. Dollar-cost averaging suits investors, not traders. It buys the trend over time without needing to time the low.
Rule of thumb: in a bull you can be a little early and the trend bails you out. What you cannot do is overstay the euphoria, because the give-back at the top is fast.
Common mistakes
- Selling winners too early. Taking a quick 10% and watching the trend run without you. In a bull, cutting winners is the expensive mistake.
- Fighting the trend. Shorting strength because price “has to” pull back. A bull can stay overbought far longer than a short can stay solvent.
- Chasing the parabola. Buying the vertical part in euphoria, right when risk is highest. Late FOMO buys the top.
- Mistaking a bounce for a bull. Treating a sharp dead cat bounce inside a downtrend as a new uptrend. Wait for the reads to agree before you trust it.
- No plan for the top. Riding all the way up and all the way back down. A bull without an exit plan becomes a round trip.
- Over-leveraging because “it only goes up.” Leverage turns a normal pullback into a stop-out, even when the long call was right.
Trading a bull market without giving it all back
An uptrend feels easy, which is exactly why traders get sloppy and hand the gains back. Discipline is what turns a good bull into kept profit.
- Trail the stop, do not marry the trade. Let the winner run, but move the stop up under each higher low so the trend takes you out, not your hope.
- Take partial profits into strength. Selling a slice into a vertical move locks in the bull without calling the exact top. You stay long and less exposed.
- Do not confuse a bull with skill. Everyone looks smart in an uptrend. Keep sizing sane so the first real pullback does not undo a year of gains.
- Plan the exit before the entry. Know your stop and target up front, and check the reward-to-risk ratio is worth it before you click.
- Mind the psychology. Greed, FOMO and holding too long past the top are what bull markets feed on. The trading psychology side is half the battle.
- Only risk what you can lose. No read is a guarantee, and the loudest euphoria usually comes right before the regime flips.
A bull market is not free money to grab, it is a trend to trade on its own terms. The reads tell you which regime you are in, and the discipline keeps the gains you make while the trend lasts.
Glossary
- Bull market: a sustained uptrend, usually a rise of 20% or more from a recent low that holds.
- Bear market: the opposite, a lasting downtrend of lower highs and lower lows.
- Bull run: everyday name for a strong, extended bull market, common in crypto.
- Secular bull market: a very long uptrend that lasts years across many cycles, not one rally.
- Drawdown: how far price has fallen from its highest point, in percent.
- All-time high (ATH): the highest price an asset has ever reached.
- Golden cross: when the 50-day moving average rises above the 200-day, a bullish trend signal.
- RSI: a momentum gauge from 0 to 100. Above 50 is bullish, below 50 is bearish, over 70 is overbought.
- Accumulation: the quiet stage where smart money buys the lows before the crowd believes.
- Distribution: the stage where smart money sells the top to late buyers, often before the turn.
FAQ
What is a bull market, in plain terms?
It is a market in a lasting uptrend. The common line is a rise of 20% or more from a recent low that holds rather than fading straight back. Prices make higher highs and higher lows, and dips get bought instead of sold.
How much does a market have to rise to be a bull market?
The widely used threshold is 20% above the recent low. A rise of 10 to 20% is treated as a rally that can still fail. Once the gain passes 20% and holds, it is called a bull market and a change of regime.
What is the difference between a bull market and a bear market?
Direction and control. A bull market makes higher highs with buyers in charge, so dips get bought. A bear market makes lower highs with sellers in charge, so rallies get sold. Price above a rising 200-day average is bull structure, below a falling one is bear structure.
How do you spot a bull market early?
Stack three reads. Watch price recover 20% above the low and hold, the 50-day average rise above the 200-day (the golden cross), and RSI keep holding above the 50 midline on dips. One alone can mislead, but when all three agree the uptrend is real.
How long does a bull market last?
There is no fixed length. Some run for years while cheap money and growth last, and others are shorter cyclical climbs. The one habit that repeats is that the biggest gains come early, and the top forms as a slow process rather than a single high.
How do you trade a bull market?
You buy weakness instead of selling it. The main options are buying dips that hold support or the 50 line, trading breakouts to new highs with the trend, holding for the compounding, and for investors, dollar-cost averaging. Trail your stops and take partial profits into strength so a pullback does not erase the run.
What is a golden cross?
It is when the 50-day moving average rises above the 200-day. Traders read it as confirmation that the long trend has turned up. It lags the exact low, so it is best used to confirm a bull market is real, not to time the bottom.
What is a secular bull market?
A secular bull market is a very long uptrend that runs for years and spans several cycles, not a single rally. Inside it there are still corrections and shorter bear phases, but the overall direction stays up. The long tech-led climb is a common example of one.
Are bull markets bigger in crypto?
They tend to be. A stock bull of 20 to 40% is a strong year, but Bitcoin can run several times over, and altcoins stretch it further in the later stage. The 20% rule is just a starting point in crypto, where a real bull run is measured in multiples, not percent.
Can a bull market end without warning?
It rarely ends in a single day. The top is usually a distribution process where new highs start to fail, breadth thins, and momentum quietly slips. The early warnings are RSI losing 50 and the trend no longer making higher highs, which is why an exit plan matters before the euphoria fades.
🌍 Our recommended brokers


Reader Reviews
Be the first to review this — tell other traders what actually helped, or where it fell short.
Leave a Review

Momentum Trader & Technical Analyst
Trades momentum across crypto and forex since 2019, built around RSI, MACD, and volume. Turns discretionary setups into rule-based, systematic entries and validates them on data before they go live.