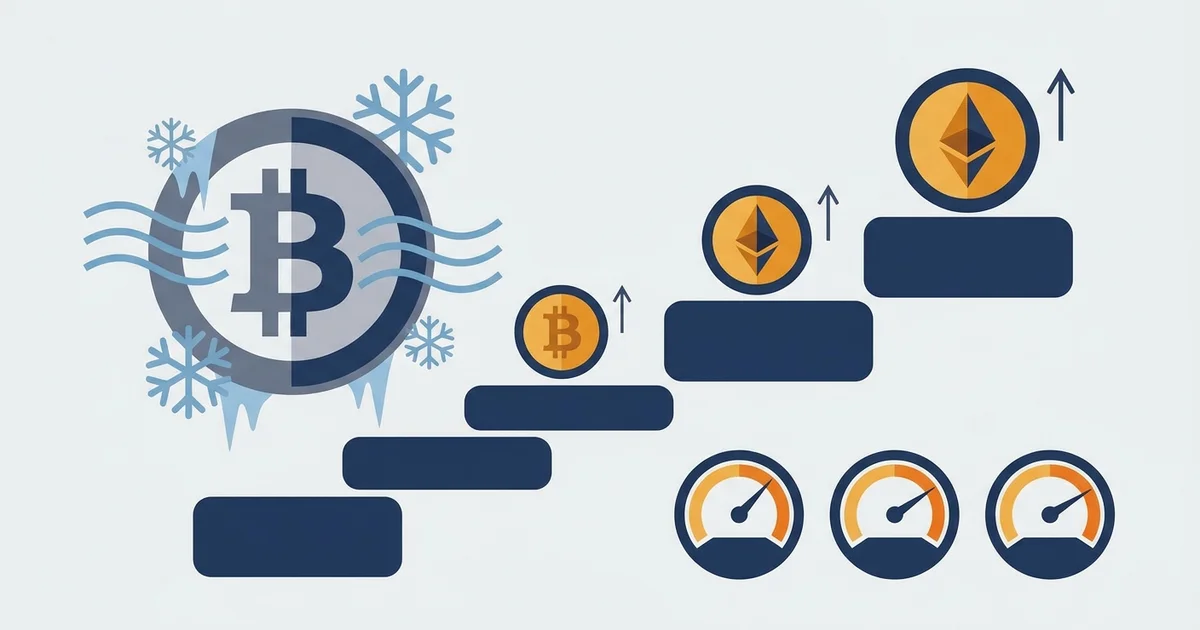

What altcoin season actually is
Altcoin season is a rotation, not a single event. Bitcoin leads a rally, then flattens, and the capital already inside crypto spreads out into altcoins hunting the next move.
That spread is a momentum handoff, and it is readable.
The plainest way to see it is Bitcoin’s own 90-day return sitting under its price.
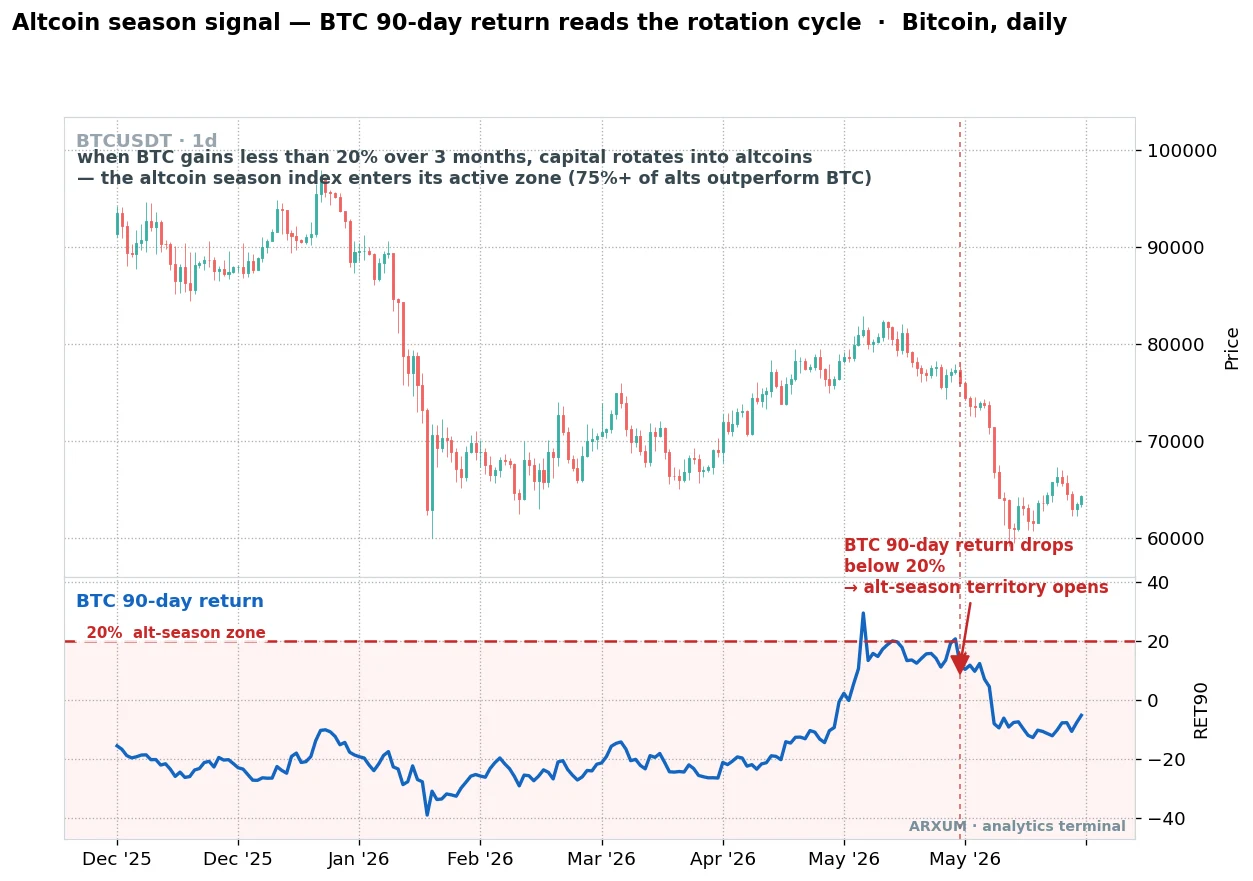
What the chart is showing:
- The top panel is Bitcoin’s price. The bottom panel, RET90, is how much Bitcoin has gained or lost over the past 90 days, in percent.
- The shaded band under the 20% line is the alt-season zone. When Bitcoin’s 3-month gain drops into it, Bitcoin has cooled off.
- The dashed vertical line marks the moment the 90-day return crosses down through 20%. That crossing is the trigger everyone watches.
- The read: hot Bitcoin pulls money in, cooling Bitcoin lets money leak out into alts. That leak is altcoin season.
The altcoin season index puts a number on the same idea. Here is the definition, plainly:
| Index reading | What it means | Market state |
|---|---|---|
| 75 and above | 75%+ of the top 50 coins beat Bitcoin over 90 days | Altcoin season |
| 50 to 74 | Mixed, no clear leader | Neutral |
| 25 and below | Most coins lag Bitcoin over 90 days | Bitcoin season |
The index and the RET90 chart are two windows on one thing: is money leading with Bitcoin, or spreading into alts. A third window is Bitcoin dominance, Bitcoin’s share of the whole crypto market cap.
When dominance falls, money is leaving Bitcoin for alts, the same rotation from a different angle.
Gauge one: Bitcoin’s own 90-day momentum
| Role | How you use it | Best read |
|---|---|---|
| Regime read | Index above 75 = alts leading; below 25 = Bitcoin leading | Daily / weekly, whole market |
| Entry trigger | BTC 90-day return crossing down through 20% while price holds up | Daily, Bitcoin |
| Filter | Only hunt altcoin longs when the index is rising toward the active zone | Daily, altcoins |
| Exit cue | Index rolls back under 75 after a spike, the rotation is fading | Daily, altcoins |
| Confirming | Falling Bitcoin dominance backs up a rising index | Daily, BTC.D |
Rule of thumb: the index tells you the season is on, not which coin to buy. Treat it as the traffic light, not the map.
Gauge two: is Bitcoin’s momentum exhausting?
The 90-day trend tells you the season is structurally on, but it does not time it.
For that, drop to Bitcoin’s daily RSI and watch it fade from overbought.
RSI is a momentum gauge that runs from 0 to 100, and above 70 means Bitcoin is running hot.
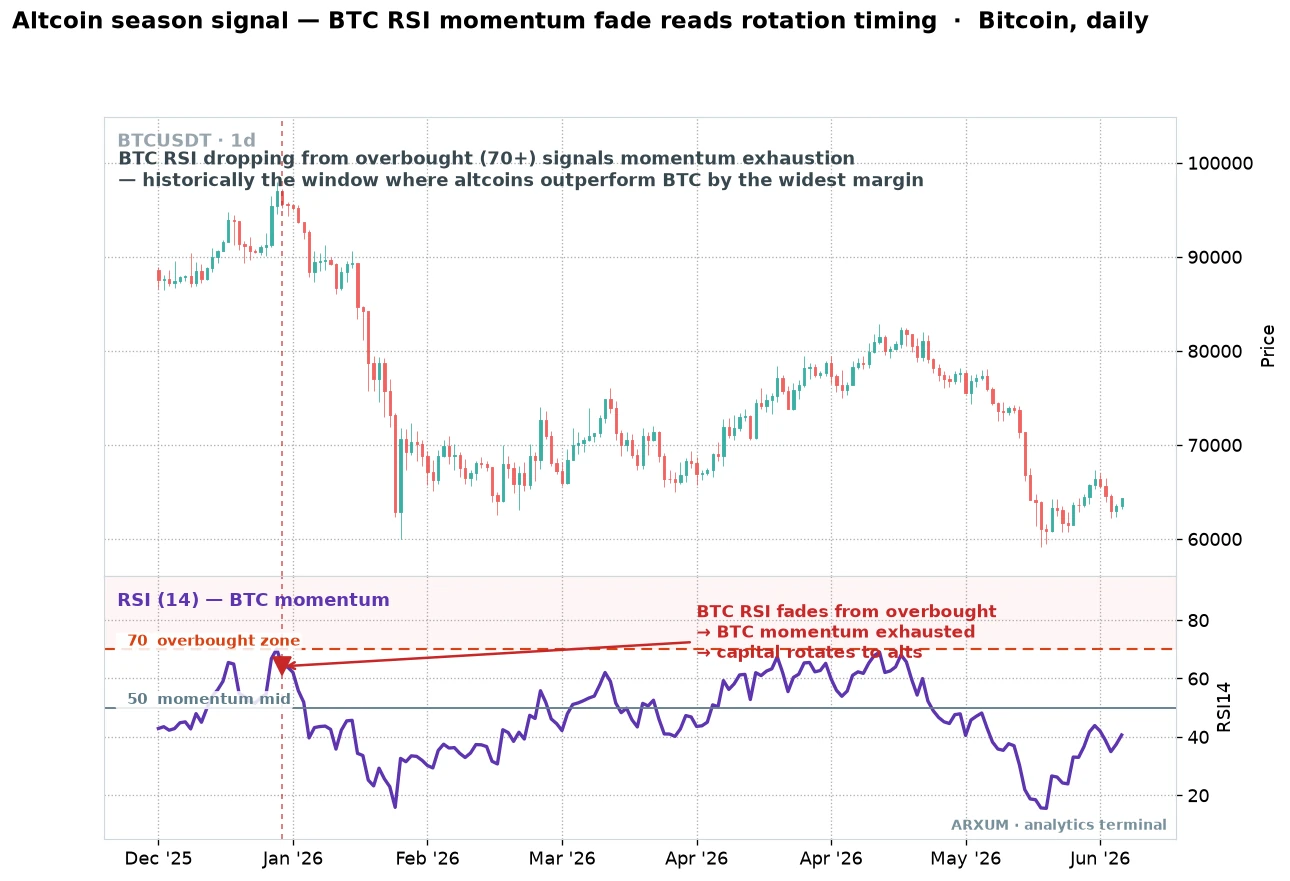
What the labels mean:
- The purple line in the lower panel is RSI on Bitcoin. It measures how strong Bitcoin’s recent moves are.
- The 70 line is the overbought mark. Bitcoin pushing above it means the run is stretched and buyers are getting tired.
- The 50 line is RSI’s neutral middle. Above 50 is bullish momentum, below 50 is bearish.
- The red arrow marks RSI turning down out of the overbought zone. That fade, not the peak in price, is the tell.
- The read: Bitcoin overbought and then rolling over does not mean crypto is done. It means Bitcoin has spent its momentum, and the money looks for a fresher move down the size ladder.
Gauge two, applied
| Role | How you use it | Best read |
|---|---|---|
| Timing | BTC RSI dropping back out of the 70 zone = momentum exhausting | Daily, Bitcoin |
| Rotation cue | The fade is where alts historically start to outperform | Daily, Bitcoin vs alts |
| Filter | Skip fresh altcoin bets while BTC RSI is still climbing above 50 and rising | Daily, Bitcoin |
| Warning | RSI back under 50 and falling = risk-off, alts usually bleed hardest | Daily, Bitcoin |
Rule of thumb: you are not shorting Bitcoin here. You are reading its tiredness as a green light for the coins it has been overshadowing.
Gauge three: micro-timing the rotation
The daily reads set the stage, and the last gauge fine-tunes the click.
On the 15-minute chart, Bitcoin’s MACD flipping negative shows short-term momentum draining, the moment intraday traders use to step off Bitcoin and into the leading alts.
MACD is a momentum indicator built from two moving averages, and its histogram is the fast read.
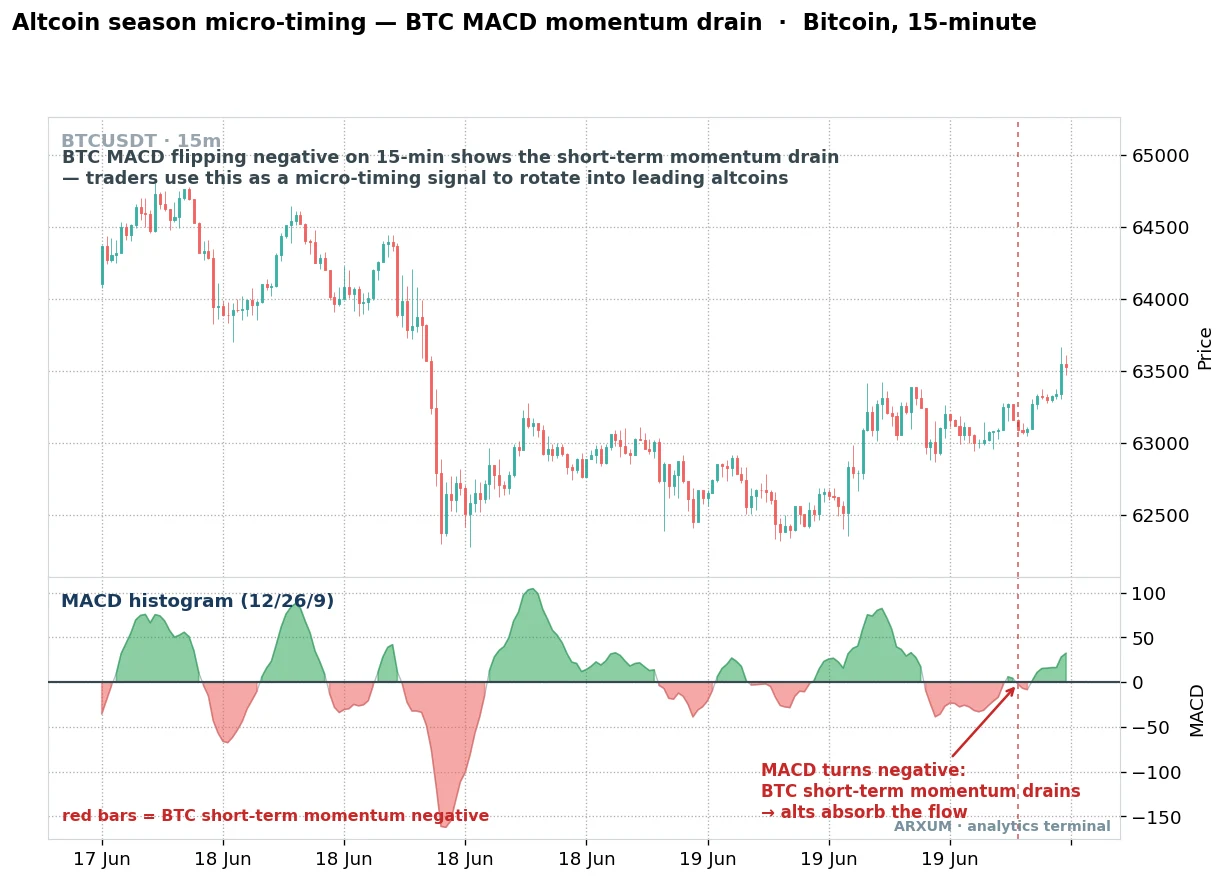
What the labels mean:
- The top panel is Bitcoin price on a 15-minute chart. The lower panel is MACD, settings 12, 26, 9, the standard.
- The histogram is the green and red bars. Green above zero = short-term momentum rising, red below zero = momentum falling.
- The red bars mark Bitcoin’s short-term momentum turning negative. The red arrow points at the flip.
- The read: when Bitcoin stalls intraday, the flow does not sit in cash, it hunts the nearest moving alt. A negative MACD flip on Bitcoin is often the first place that shows up.
Gauge three, applied
| Role | How you use it | Best read |
|---|---|---|
| Micro-timing | BTC 15-min MACD histogram flipping red = short-term momentum drain | 15-min, Bitcoin |
| Rotation trigger | Use the flip to step off Bitcoin into an alt already showing green momentum | 15-min, Bitcoin vs alt |
| Filter | Ignore the flip if the daily regime is not already in an alt-season lean | 15-min under daily |
| Noise warning | The 15-min flips constantly, only act on it when the slow gauges agree | 15-min, Bitcoin |
Rule of thumb: the fast gauge is a scalpel, not a compass. It only earns a trade when the daily reads already say a season is on.
Which gauge tells you what
The three gauges are the same idea read at three speeds, from the 3-month trend down to the 15-minute flip. You want them stacked, slow first.
| Question | Gauge | Yes looks like |
|---|---|---|
| Is a season structurally on? | BTC 90-day return / index | Index 75+, 90-day return under 20% |
| Is Bitcoin's momentum fading? | BTC RSI, daily | RSI dropping back out of 70 |
| When do I step in? | BTC MACD, 15-min | Histogram flipping red on Bitcoin |
How to weigh them:
- All three lined up: the strongest setup. The season is structurally on, Bitcoin’s daily momentum is cooling, and the micro-timing agrees. This is a real rotation, not a head-fake.
- Gauge one only: the index is high but Bitcoin is still ripping on the daily. Alts may pop for a session, then give it back. A watch, not a go.
- Gauges one and two, not three: the season is on and Bitcoin is tiring, you are just waiting for a clean intraday entry. Get ready.
- None aligned: Bitcoin season or risk-off. Hold Bitcoin or the majors, or sit in cash.
Cross-check on other crypto gauges
Bitcoin’s own momentum is the backbone, but crypto gives you several other native reads. They all measure the same rotation, so use them to confirm, not to add noise.
| Gauge | Rotation signal | What it confirms |
|---|---|---|
| Bitcoin dominance (BTC.D) | Falling | Money leaving Bitcoin for alts |
| ETH/BTC ratio | Rising | Large caps leading the handoff |
| TOTAL2 market cap | Rising while BTC flat | Alt capital expanding |
| Stablecoin dominance (USDT.D) | Falling | Cash moving into risk assets |
| Altcoin season index | Climbing past 75 | Breadth, most coins beating BTC |
- Start with ETH/BTC. Ethereum leads almost every rotation, so a rising ETH/BTC ratio is usually the first real tell that the handoff has begun.
- Watch dominance and TOTAL2 together. Falling Bitcoin dominance while total alt market cap climbs is the cleanest picture of money leaving Bitcoin and spreading out.
- Use stablecoin dominance as the fuel gauge. Falling USDT.D means cash on the sidelines is being deployed into coins, which feeds the move.
- Do not add gauges for the sake of it. Three clean reads beat six noisy ones. These back up Bitcoin’s momentum, they do not replace it.
Reading it across timeframes
The same reads scale up and down the timeframes. Slower charts define the season, faster charts time the entries inside it.
| Timeframe | What it tells you | Best use |
|---|---|---|
| Daily / weekly | Is a season on at all (the regime) | Decide whether to be in alts |
| 4-hour | Momentum shifts inside the season | Position for the rotation |
| 15-min / 1-hour | The exact micro-timing and noise | Fine-tune the click, easy to over-read |
- Set the regime on the daily or weekly. The altcoin season index and Bitcoin’s 90-day trend both live here. This is where you decide if the season is real.
- Position on the 4-hour. Bitcoin’s RSI fade and ETH/BTC turning up are 4-hour-friendly reads for stepping in.
- Time on the 15-minute. The MACD flip is your entry trigger, but only when the slow charts already agree.
How the rotation moves through the market
An altcoin season is not one wave, it is a relay. Money leaves Bitcoin and works down the size ladder, from the biggest alts to the smallest and riskiest.
Knowing the stage tells you what to hold and when to worry.
| Stage | What leads | Signal to watch |
|---|---|---|
| Bitcoin run | Bitcoin | 90-day return high, dominance rising |
| Large-cap rotation | Ethereum, top-10 alts | ETH/BTC turning up, dominance topping |
| Broad season | Mid-cap alts | Index 75+, TOTAL2 expanding |
| Late blow-off | Small-caps, memecoins | Index stretched, BTC RSI rolling over |
| Roll-over | Back to Bitcoin or cash | Index under 75, dominance turning up |
How to play each stage:
- Bitcoin run: stay with Bitcoin and the largest alts. The season has not started.
- Large-cap rotation: the first real tell. Ethereum and the top-10 start to outperform Bitcoin. Get your gauges lined up.
- Broad season: the sweet spot. Rotation is confirmed and mid-caps are moving. This is where the plan pays.
- Late blow-off: the riskiest cash. Small-caps and memecoins run hardest and reverse hardest. Trim, do not add.
- Roll-over: the exit. Money heads back to Bitcoin or the sidelines. Protect gains, do not fight it.
Rule of thumb: the further down the size ladder the leadership moves, the closer the season is to its end.
What past rotations looked like
Every altcoin season rhymes. Naming the past ones by what led them makes the pattern obvious, and it always runs the same relay: Bitcoin first, then the size ladder, then a blow-off.
| Rotation era | What led it | How it ended |
|---|---|---|
| The ICO mania | New token launches, exchange coins | Euphoric blow-off, a long winter |
| DeFi summer | DeFi and yield-farming tokens | Sharp reversal back to Bitcoin |
| The NFT and L1 run | NFTs, memecoins, competing layer-1s | Stretched top, deep drawdown |
The lessons that repeat across all of them:
- Ethereum moved first. In each rotation the large caps led before the crowd noticed, which is why ETH/BTC is the gauge to watch early.
- The wildest gains came last, and cost the most. The final memecoin leg felt like the easiest money and marked the top nearly every time.
- They ended faster than they built. The rotation up took weeks, the roll-over took days. Exits mattered more than entries in every one.
What actually works
The short version you can carry:
- 1. Confirm the season on the daily first. The altcoin season index at 75+ with Bitcoin’s 90-day return cooling under 20% is the direct signal. Everything else supports it.
- 2. Wait for Bitcoin’s momentum to fade. Bitcoin’s daily RSI dropping back out of the 70 zone is where alts historically start to outrun it. That fade is the go-ahead, not Bitcoin making new highs.
- 3. Time the step-in on the fast chart. A negative MACD flip on Bitcoin’s 15-minute is your micro-trigger, but only when the daily reads already lean alt-season.
- 4. Back it with the native gauges. Rising ETH/BTC, falling dominance and expanding TOTAL2 all confirm the same rotation. One out of four is a trap.
- 5. Watch for the roll-over. Altcoin seasons end fast. When the index falls back under 75 or Bitcoin dominance turns up, the exit door is already closing.
Pull the gauges up yourself
You can rebuild all three reads for free in a few minutes. The exact indicator names matter, since most charting tools carry look-alike variants.
- On TradingView: load Bitcoin, hit the Indicators button, and add these. For the 90-day trend, Rate of Change (ROC), length 90, which is the 90-day return in the first chart. For momentum, Relative Strength Index, length 14. For the micro-timing, MACD, settings 12, 26, 9, on a 15-minute chart.
- On MT4 or MT5: use Insert -> Indicators -> Oscillators for RSI (period 14) and MACD (12, 26, 9). ROC lives under the same Oscillators menu, period 90.
- The altcoin season index itself is not a one-click chart indicator. The live reading lives on public trackers like blockchaincenter.net, and the ROC(90) on Bitcoin is your on-chart proxy for it.
- Bitcoin dominance has its own ticker on TradingView, BTC.D, and the ETH/BTC ratio charts directly, so you can watch the rotation without any indicators at all.
Rule of thumb: match the settings exactly. A default MACD length or the wrong ROC window will draw a different line and give you a different call.
Common mistakes
- Buying the word, not the signal. Twitter calling altcoin season is not the index reading 75. Check the gauge, not the mood.
- Using one gauge alone. The index can spike on a fake move. Without Bitcoin’s momentum reads and the native gauges you cannot tell a real season from a two-day pop.
- Shorting Bitcoin on the RSI fade. The fade is a rotation cue for alts, not a signal to short Bitcoin itself. Read it, do not trade it directly.
- Chasing after the roll-over. Most of the damage happens buying alts once the season is already ending. A falling index is a sell cue, not a dip.
- Ignoring Bitcoin dominance. Rising dominance while the index climbs is a contradiction worth respecting. The rotation is not as clean as it looks.
- Reading it on the 15-minute alone. A months-long rotation does not turn on one fast candle. Set the regime slow, time it fast.
Using it without getting hurt
Altcoins are the high-beta end of crypto. They move further both ways, so the read has to come with discipline.
- Size for the volatility, not the excitement. Alts can drop 30% in a session. Risk a small, fixed slice of the account per position and let the setup, not the hype, decide the size.
- Plan the exit before the entry. Know your stop and your target up front. The reward-to-risk ratio should be worth the trade before you click.
- A season is a window, not a permanent state. No rotation lasts forever, and no gauge is a guarantee. Take profit into strength rather than waiting for the label to be revoked.
- Only commit money you can afford to lose. This is the most speculative corner of trading. Treat every read as odds, not a promise.
The gauges shift the odds in your favour when they stack up. They do not remove the risk, and altcoin season punishes anyone who forgets that.
Glossary
- Altcoin: any crypto that is not Bitcoin.
- Altcoin season index: a 0 to 100 score for how many top coins are beating Bitcoin over 90 days.
- Bitcoin dominance (BTC.D): Bitcoin’s share of the total crypto market cap. Falling dominance means money is rotating into alts.
- ETH/BTC ratio: Ethereum priced in Bitcoin. Rising means large-cap alts are leading the rotation.
- TOTAL2: the total crypto market cap excluding Bitcoin. Rising means alt capital is expanding.
- RSI: a momentum gauge from 0 to 100. Above 70 is overbought, above 50 is bullish momentum.
- MACD: a momentum indicator built from moving averages. Its histogram above zero means momentum is rising.
FAQ
What is altcoin season, in plain terms?
It is the part of a crypto cycle when most altcoins gain faster than Bitcoin at the same time. Money that led the market through Bitcoin rotates into smaller coins, and they run together.
Is it altcoin season right now?
Read it off Bitcoin. The altcoin season index needs to be at 75 or above, Bitcoin's daily RSI should be fading out of the 70 zone, and Bitcoin dominance should be falling while ETH/BTC rises. If those line up, yes. If only the index is high, not really.
What is the altcoin season index and how is it worked out?
It takes the top 50 coins and checks how many beat Bitcoin over the last 90 days. If 75% of them did, the reading is 75 and the market is in altcoin season. Below 25 and it is Bitcoin season.
How long does altcoin season last?
There is no fixed length. Past ones have run from a few weeks to a couple of months, and they vary a lot. The one reliable habit is that they end faster than they build, so exits matter more than entries.
Why read altcoin season off Bitcoin instead of the alts themselves?
Because the rotation starts with Bitcoin cooling off. Its 90-day trend, daily RSI and short-term MACD show when the money is done leading with Bitcoin, which is the moment it spreads into alts. The alts follow, they do not lead.
Which timeframe is best for reading it?
Use the daily or weekly chart to decide whether a season is on. Use the 4-hour to position inside it, and the 15-minute only to fine-tune the entry. A theme this slow is mostly noise on the fast charts.
Do these gauges work on individual altcoins?
The gauges judge the season, not the coin. Once the rotation is confirmed you still pick coins on their own charts and their own strength. Think of the gauges as the green light for the whole road, not the car you drive.
What ends an altcoin season?
The rotation reverses. The index falls back under 75, Bitcoin dominance turns up, or the money runs out of the smallest coins after a blow-off. Any of those is a signal the window is closing.
Can I rely on just one gauge?
No. The altcoin season index alone will fool you on fake moves. The value is in the agreement between Bitcoin's momentum reads and the native gauges, which is what separates a real season from a short-lived pop.
Is altcoin season the same as a crypto bull market?
No. A bull market can run with Bitcoin leading the whole way, and that is Bitcoin season, not altcoin season. Altcoin season is the specific slice where alts lead. You can have a bull market with no altcoin season at all.
Is Ethereum season the same thing?
It is the first chapter of one. Ethereum and the largest alts move before the broad market does, so a rising ETH/BTC ratio is usually the early tell that rotation has started down the size ladder.
Real-time trade setups with entry, stop loss and take profit. Daily market analysis. No subscription, no complicated theory.
🌍 Our recommended brokers


Reader Reviews
Be the first to review this — tell other traders what actually helped, or where it fell short.
Leave a Review

Momentum Trader & Technical Analyst
Trades momentum across crypto and forex since 2019, built around RSI, MACD, and volume. Turns discretionary setups into rule-based, systematic entries and validates them on data before they go live.
