
What a dead cat bounce actually is
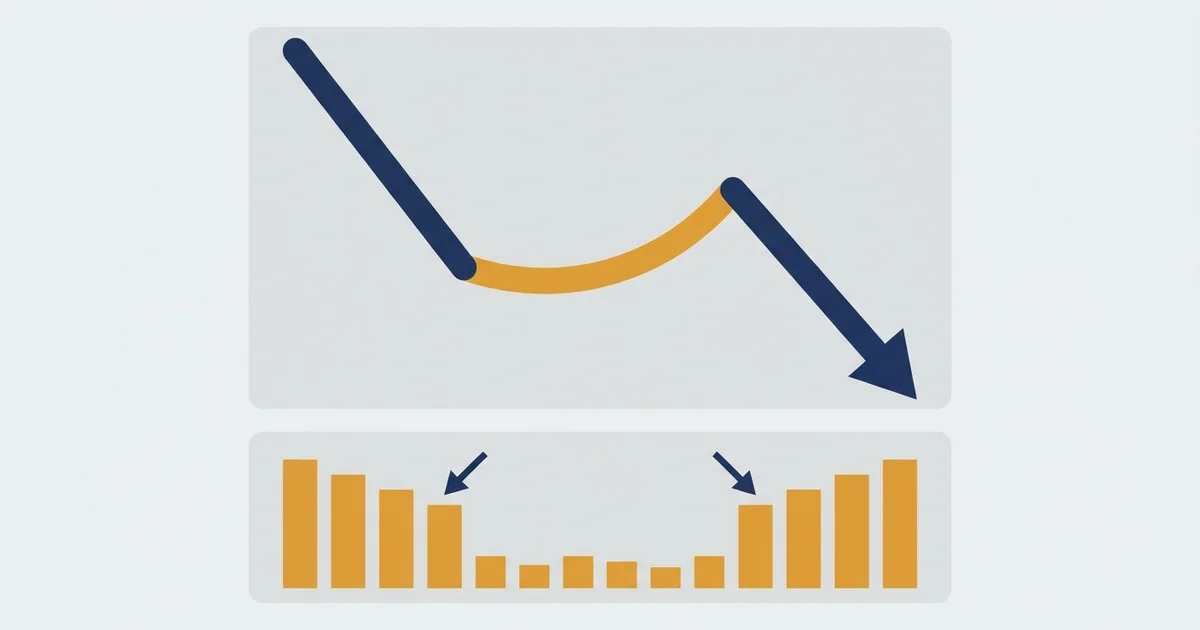
A dead cat bounce is a downtrend faking a recovery. Sellers pause, price pops, and everyone who was waiting to buy the dip piles in, right before the fall continues.
Here is the shape the way it draws in the textbook.
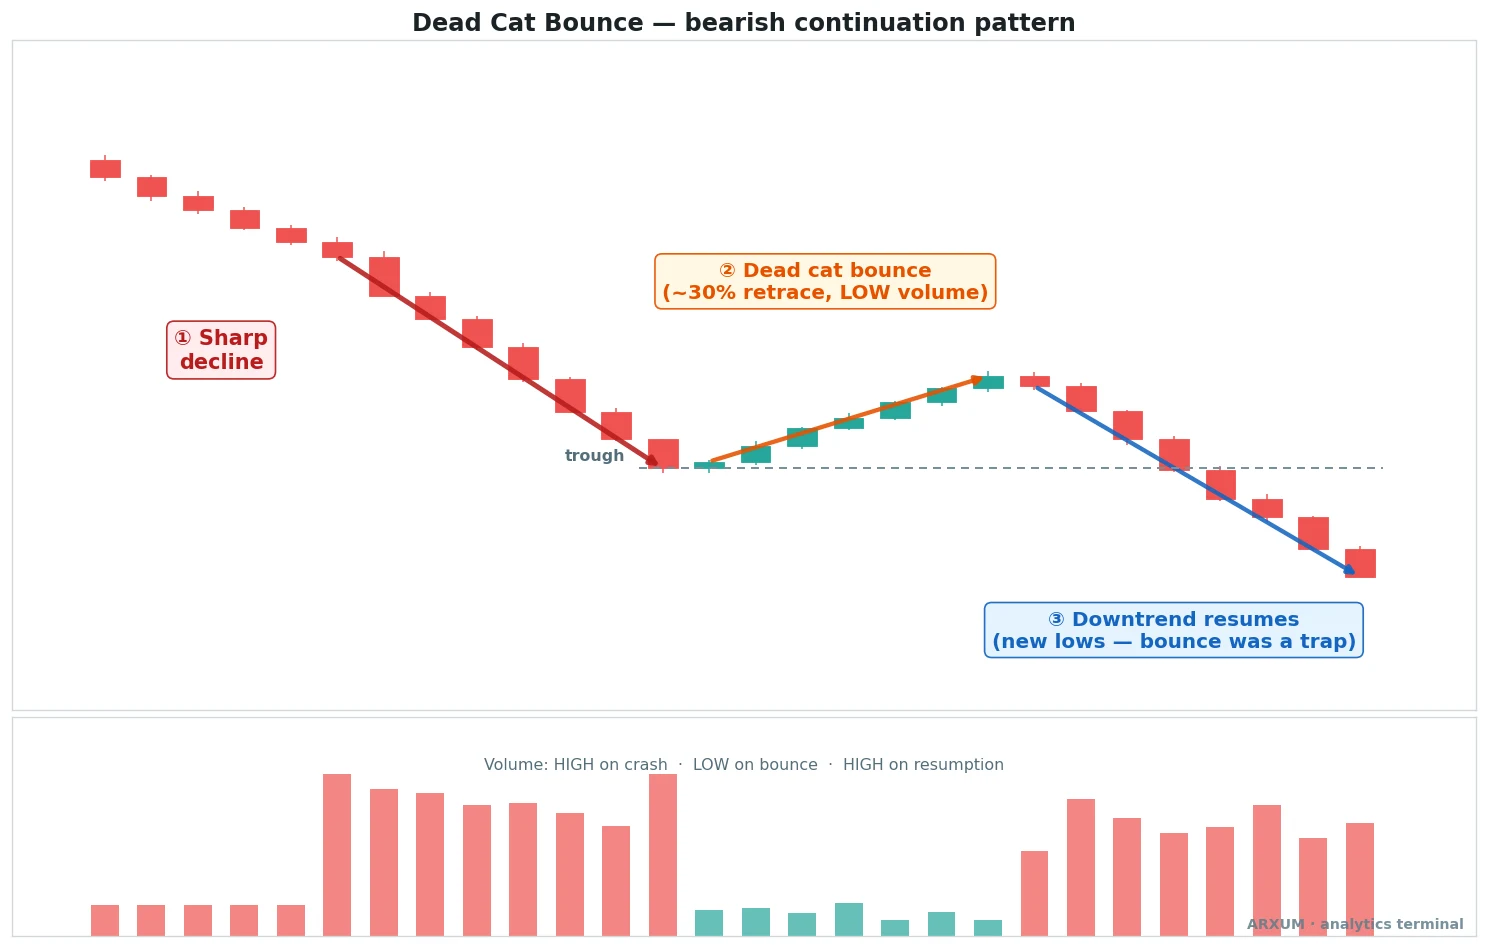
Now that the picture is on screen, the three parts are easy to name. Read them left to right.
- The sharp decline: a fast, one-way sell-off on heavy volume. This is the impulse that sets the trend.
- The bounce: a counter-move up that recovers part of the drop, usually on thin, fading volume. This is the trap.
- The resumption: price rolls back over and takes out the prior low, confirming the bounce was fake.
The bounce is where the damage happens. It looks like the recovery, buyers get interested, and then the sellers who were resting step back in.
That pop is not strength. It is a pause before the next leg down.
| Stage | What it is | The tell |
| Sharp decline | The steep drop that starts the move | Wide down candles, heavy volume, one direction |
| Bounce | The counter-trend recovery | A partial retrace, thin fading volume, stalls at a broken level |
| Resumption | The trend continuing | A close below the prior trough, volume picks up again |
The word “volume” carries a lot of weight in that table, so it is worth defining once. Volume is the number of units traded in a period, drawn as bars under the price.
Heavy volume means real money is moving. Thin volume on the bounce means few buyers actually believe in it.
Why the bounce happens at all
A dead cat bounce is not random. Three groups push price up for a few days, and none of them are long-term buyers.
Knowing who is doing the buying explains why it fades.
- Short sellers taking profit. Traders who sold high now buy back to lock in gains. That buying lifts price, but it ends the moment they are flat.
- Dip buyers guessing at the bottom. After a big drop, bargain hunters step in early. They are hoping, not confirming, and they bail fast when price turns.
- A relief rally on no news. Nothing has actually changed. The thing that caused the crash is still there, so the rally has no fuel.
The common thread is that the buying is shallow and short-lived. That is why the volume dries up, which is the single most useful early warning that a recovery is hollow.
A real bottom brings in fresh, committed buyers on rising volume. A dead cat bounce runs out of them within a few candles.
The one question that matters: bounce or bottom?
Here is the honest core of this whole pattern. While it is happening, a dead cat bounce and the start of a real recovery look exactly the same.
Both start with a drop and a rally. The difference only becomes clear later.
So the useful skill is not calling the top of the bounce in advance. It is reading the odds, then waiting for price to confirm which one you are in.
| Clue | Dead cat bounce | Real reversal |
| Volume on the bounce | Thin and fading | Rising, heavier than the drop |
| How far it retraces | About a third to a half of the drop | Reclaims well past half, often the whole drop |
| Key level | Stalls under a broken support shelf | Reclaims that level and holds above it |
| Trend backdrop | Price still below the 200-EMA | Price climbs back above the 200-EMA |
| What comes next | A new low below the prior trough | A higher low, then a higher high |
That last row is the one that settles it.
A dead cat bounce ends with a new low. A real turn ends with a higher low and a higher high.
The retrace depth is worth a plain word too. Traders measure it with a Fibonacci retracement, a tool your charting app draws that marks the 38.2%, 50%, and 61.8% levels of a move.
In TradingView it is the Fib Retracement tool in the left toolbar; in MT4/MT5 find it under Insert → Fibonacci → Retracement.
A bounce that stalls near the 38.2% or 50% mark on weak volume fits the dead cat. One that pushes past 61.8% and holds is starting to look like a real recovery, so the odds shift.
For the pattern built specifically to mark a genuine bottom, the double top and double bottom guide is the companion read. And because these bounces live inside falling markets, the bear market guide sets the wider scene.
The dead cat bounce on Bitcoin: where volume tells the truth
Crypto is the natural home for the dead cat bounce pattern. Bitcoin has deep, fast bear markets, and exchanges report real traded volume, so the thin-bounce tell is trustworthy.
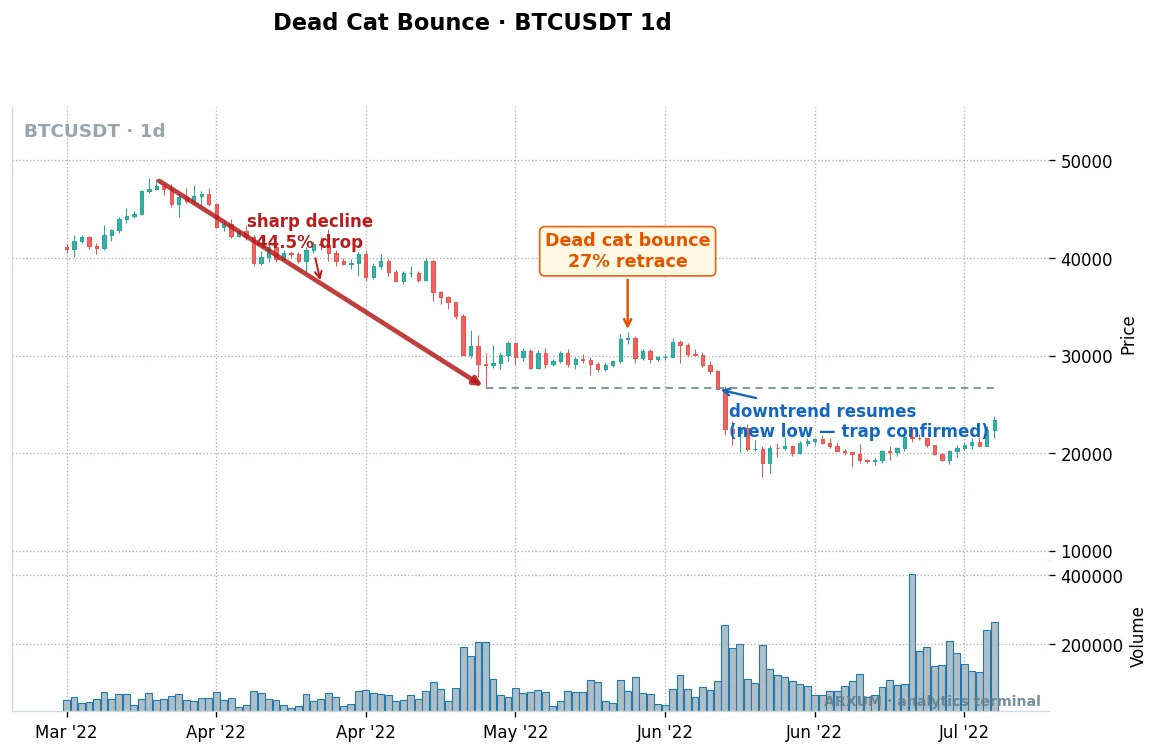
On that Bitcoin chart the sequence is textbook. A 44.5% sell-off carves out the trough, price then bounces about 27% of the way back, and the bounce dies right where the earlier support turned into resistance.
Then the downtrend resumes. Price breaks the prior low, and the new-low label marks the moment the trap was confirmed.
- The volume read: the crash prints heavy bars, the bounce prints thin ones. That gap is the warning, and on crypto you can trust it.
- The retrace: 27% is a shallow bounce, well under half the drop. That shallowness is itself a bearish tell.
- The confirmation: the short only made sense once price closed below the trough, not while it was still bouncing.
The dead cat bounce in crypto often plays out over one to three weeks on the daily, so there is time to wait for that confirmation rather than guess at it. The failed bounce is a cousin of the failed breakout, just pointed down.
The dead cat bounce on gold: the same shape, one big caveat
Spot gold prints the pattern too, but it comes with a warning that crypto does not carry. Gold has a safe-haven bid, so a falling gold market can turn for real at any time.
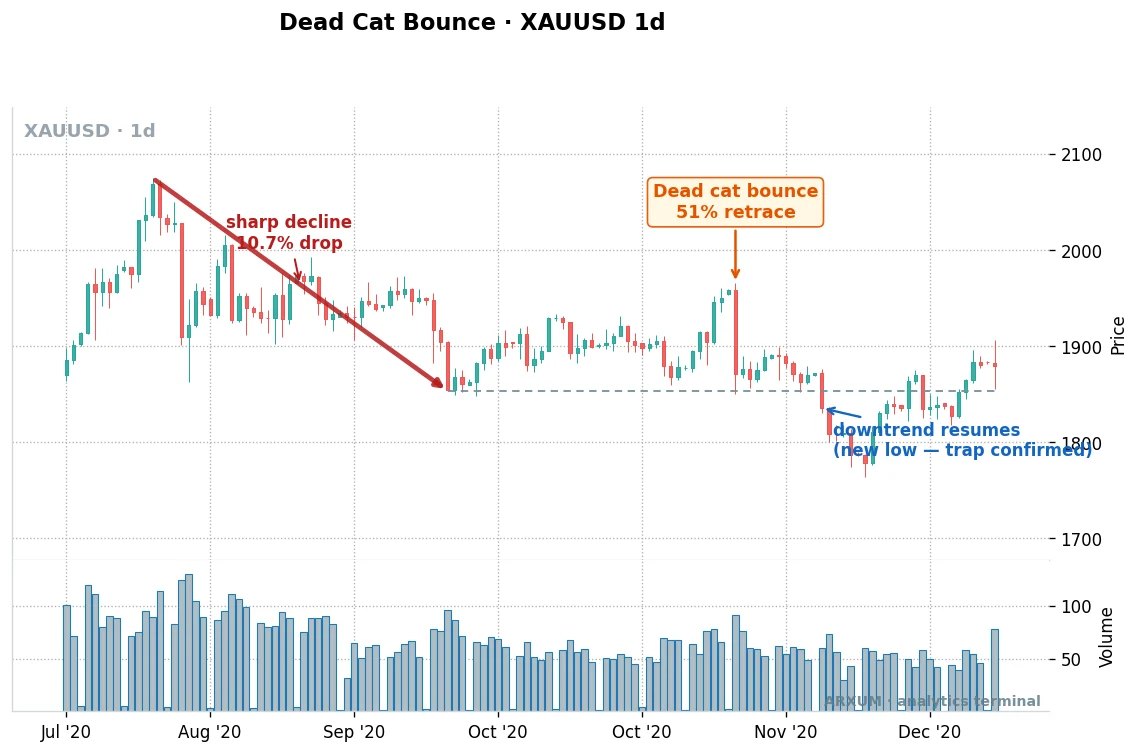
On the gold chart the drop is milder, 10.7%, which is typical of a metal that moves less violently than crypto. The bounce here retraced 51%, right at the edge of what still counts as a dead cat.
That deeper retrace is the point.
A 51% bounce is close enough to half that you could not be certain in real time. Only the eventual new low settled it.
- The volume trap: gold platforms show tick volume, a count of price updates, not real money traded. So the thin-bounce read is unreliable here. Lean on the structure and the trend instead.
- The safe-haven risk: a fresh scare can flip gold’s downtrend into a real bottom fast, so the 200-EMA backdrop matters more than on crypto.
- The lesson: the deeper the bounce, the lower the odds it is a dead cat. At 51% you treat it as a coin flip and wait for the low to break.
Gold’s own support and resistance shelves matter here. A bounce that dies right under a well-tested old support level is a higher-quality short than one fading in open air.
The confirmations that separate a trap from a turn
Every pattern has its own set of filters that actually move the odds, and they are not the same from one setup to the next. For the dead cat bounce, these five are the ones that earn their place.
Front-load one line on the trend filter first. The 200-EMA is the 200-period exponential moving average, a single line your app draws from the last 200 candles.
To add it: in TradingView, open Indicators and search “Moving Average Exponential,” set length to 200 and source to Close; in MT4/MT5, go to Insert → Indicators → Trend → Moving Average, period 200, type Exponential. Below it, the market is in a downtrend, which is exactly the backdrop this pattern needs.
| Filter | What to look for | Where to trust it |
| Regime | Price below the 200-EMA | Every market |
| Bounce depth | Retrace under about half the drop | Every market |
| Volume | Thin, fading bars on the bounce | Crypto and stocks only |
| Failed retest | Bounce stalls under broken support | Every market |
| New low | A close below the prior trough | Every market, this is the trigger |
Two of these do the heavy lifting. The regime keeps you on the right side of the trend, and the new low is the trigger that turns a guess into a trade.
Volume is a strong fifth filter, but only where it is real. That is the whole reason it helps on Bitcoin and misleads on gold.
The rule of thumb: never short a bounce while it is still bouncing.
Wait for the trend to be down, the bounce to be shallow, and the prior low to break. Then act.
How to trade a dead cat bounce, step by step
The safe trade is not buying the bounce and it is not shorting the top. It is selling the resumption once the low gives way.
That way price confirms the trap before you risk a cent.
Here is the whole method as a checklist.
- Confirm the downtrend. Price must be below the 200-EMA. No downtrend, no dead cat. This is the filter that keeps you from shorting a real recovery.
- Mark the trough. Find the low that ended the sharp decline. That level is your line in the sand.
- Watch the bounce, do not chase it. Let it retrace. If it stays shallow, under about half the drop, and fades on thin volume, the odds favour a trap. If it reclaims the trend and pushes past 61.8%, stand aside; this may be a real turn.
- Sell the resumption. Enter when price closes below the prior trough. That break is the confirmation that the bounce is done.
- Set the stop and target. Stop just above the bounce’s most recent lower high. Target the next support, or project the size of the first drop down from the break for a measured move.
On order placement, you do not have to sit and watch. Most platforms let you leave a sell-stop order, an instruction that sells automatically the moment price trades below a level you set, just under the trough.
In the same ticket you fill the stop-loss field above the last lower high and the take-profit field at your target, so the entry, the exit, and the safety net all go in at once.
A worked example you can actually place
Gold makes the cleaner picture, but it is the wrong instrument for a small account.
A sensible stop on gold sits $40 or more per ounce from entry, and at 2% risk on a $1,000 account that is a $20 budget divided by a $40 stop, which is half an ounce. That is below the one-ounce micro-lot minimum, so a $1,000 account cannot even place it.
So take the trade a small account can fill: a EUR/USD short. A short profits when price falls. Here is the setup:
- The pair is below its 200-EMA, in a clear down-leg.
- The sharp decline bottoms at a trough of 1.0500. A thin-volume bounce climbs to 1.0620, stalls under a broken support shelf, and turns, leaving a lower high at 1.0560.
- Price then closes below 1.0500. That is your trigger.
Now the money math, worked from the account down.
- Risk budget: 2% of a $1,000 account is $20. That is the most you will lose on this trade.
- Entry: a sell-stop at 1.0490, ten pips below the trough to confirm the break. A pip is the fourth decimal place, the standard price tick on a major pair, so 1.0500 to 1.0490 is ten pips.
- Stop: 1.0560, just above the last lower high. Entry to stop is 70 pips, your risk distance.
- Position size: $20 risk ÷ 70 pips = $0.29 per pip. A micro lot is worth about $0.10 per pip, so $0.29 ÷ $0.10 = 2.9, which you round down to 2 micro lots (0.02 lots).
- Check it: 2 micro lots at $0.20 per pip over a 70-pip stop risks $14, safely under your $20 cap.
- Target: 1.0350, about 140 pips below the entry. That is a reward-to-risk of 140 to 70, or 1:2.
Reward-to-risk written 1:X is the OANDA-standard way to read a trade. The 1 is your risk, the distance from entry to stop.
The X is the reward, how many times that risk the trade can pay back. The risk-reward ratio guide works the math in full.
One line on leverage, because it scares newer traders.
Two micro lots is about 2,000 units of the euro, roughly $2,000 of exposure on a $1,000 account, so about 1:2 effective leverage. Your broker’s 1:100 is just margin headroom that lets you hold the position; the 2% risk already caps what you can actually lose.
The discipline rule that fits this pattern. Dead cat trades cluster in bear phases, and they stop working the moment the market finds a real bottom.
That is exactly when you will hit a run of small losses, because your “new low” keeps failing and the bounce holds. Two or three losses mean nothing.
A string of four, five, or six in a row is the market telling you the downtrend has probably ended, so stand down and wait for price to settle firmly back below the 200-EMA before the next short.
That is the cue to stop, not to size up and win it back. Only risk money you can afford to lose, because a pattern that leans on a trend will always hand you losing streaks when that trend stalls.
Which timeframe and which market
The chart you watch changes the pattern more than most people expect. The same bounce is a real signal on the daily and mostly noise on the 1-hour.
| Where | Character | Best use |
| Daily (D1) | Fewer, cleaner setups; each is a real trend pausing | The core read on gold and Forex |
| 4-hour (H4) | More setups, more noise | Crypto corrections, with the volume check |
| 1-hour (H1) | Mostly noise; most bounces are not the pattern | Skip, or only to time an entry the daily set up |
| Bitcoin, crypto | Deep bear markets, real volume | The friendliest market; trust the volume tell |
| Gold, silver | Milder drops, tick volume, safe-haven risk | Read structure, not volume; mind the 200-EMA |
| EUR/USD, GBP/USD | Clean legs when the trend is real | Fine in a genuine down-leg; ignore volume |
There is a practical tell hidden in that table. If you find yourself spotting a dead cat bounce every single day, you have drifted to a chart where the edge is gone.
More signals is not more opportunity here. It is the warning light that you are trading noise, so step back up a timeframe.
Where the dead cat bounce fails
The failures teach this pattern better than the wins, because the failure is always the same thing: the bounce was not a dead cat at all. It was the real bottom.
Almost every losing trade comes from one of these.
- It was a genuine V-recovery. Price bounced hard on rising volume, reclaimed the trend, and never looked back. Shorting that is fighting a new uptrend.
- You shorted the bounce itself. Selling before the low breaks means you are guessing. The bounce can run further than you think and stop you out first.
- The retrace was too deep. A bounce that reclaims past 61.8% of the drop is no longer shallow. The odds have flipped, so the setup is void.
- You trusted tick volume on gold or Forex. The thin-bounce read only works where volume is real. On the metals and the majors it is a proxy, not proof.
- Wrong timeframe. On the 1-hour, most bounces are just chop. No filter rescues a pattern on a chart that is mostly random.
The through-line is simple. The pattern only exists in a market that keeps falling, so the moment the market stops making new lows, the pattern stops working.
Decision table: what to do, at a glance
| Situation | Do this |
| Below the 200-EMA, shallow bounce, price breaks the prior low | Sell the resumption; stop above the last lower high |
| Crypto, thin volume on the bounce | Trust it; the volume confirms the trap |
| Gold or Forex, waiting for a volume drop | Read structure instead; tick volume is unreliable |
| Bounce still climbing, low not yet broken | Wait; do not short a bounce mid-flight |
| Bounce reclaims past 61.8% on rising volume | Stand aside; this may be a real reversal |
| Price back above the 200-EMA | Skip it; the downtrend is over |
| Four to six losing shorts in a row | Stop; the market has likely bottomed |
What works: the short version
If you remember three things about the dead cat bounce, make it these.
- Never buy the bounce. While it is happening you cannot know if it is a dead cat or a real bottom. Waiting costs you nothing; guessing costs you the trade.
- Let the low confirm it. The only proof the bounce was fake is a new low below the prior trough. Sell that break, stop above the last lower high, target the next support.
- Match the market to the volume. On crypto the thin-bounce tell is real. On gold and Forex it is not, so lean on the 200-EMA regime and the structure.
The dead cat bounce is a continuation pattern, a relative of the bear flag, and it works the same way: only where a real downtrend earns it. For the wider map of shapes, see the chart patterns guide.
Glossary
- Dead cat bounce: a brief rally in a falling market that fails and gives way to new lows.
- Trough: the low that ends the sharp decline, before the bounce.
- Retracement: how much of the drop the bounce recovers, measured with Fibonacci levels.
- Continuation pattern: a shape that resumes the existing trend rather than reversing it.
- 200-EMA: the 200-period exponential moving average, a trend filter; below it means a downtrend.
- Tick volume: a count of price updates, shown by gold and Forex platforms in place of real traded volume.
- Sell-stop order: an order that sells automatically once price trades below a set level.
- Reward-to-risk (1:X): the reward measured against the risk, where 1 is your entry-to-stop distance.
FAQ
What is a dead cat bounce, in plain terms?
A dead cat bounce is a short, sharp rally inside a falling market that traps buyers and then rolls over to new lows. It has three parts: a steep decline, a partial recovery that usually retraces a third to a half of the drop on thin volume, and a resumption of the downtrend that breaks the prior low. The bounce looks like a real recovery while it is happening, which is exactly why it is a trap.
Why is it called a dead cat bounce?
The name comes from a grim old market saying that even a dead cat will bounce if it falls from high enough. It captures the point perfectly: the bounce is not a sign of life or recovery, just a mechanical reaction after a hard fall. Price pops for a few days and then continues lower.
How do you tell a dead cat bounce from a real reversal?
You cannot be certain while the bounce is happening, but the odds are readable. A dead cat bounce is shallow, usually under half the drop, fades on thin volume, stalls under a broken support level, and stays below the 200-EMA. A real reversal reclaims well past half the drop on rising volume, holds above the broken level, and climbs back over the 200-EMA. The final proof is what comes next: a dead cat makes a new low, a real turn makes a higher low then a higher high.
Does the dead cat bounce happen in crypto?
Yes, and crypto is the clearest place to see it. Bitcoin and altcoins have deep, fast bear markets, so the pattern shows up often, and exchanges report real traded volume, so the thin-bounce tell is trustworthy. A dead cat bounce in crypto often plays out over one to three weeks on the daily chart, which gives you time to wait for the low to break before trading it.
How long does a dead cat bounce last?
It varies with the market and the timeframe. On a daily chart in crypto or gold, a dead cat bounce typically lasts a few days to a couple of weeks before the downtrend resumes. On faster charts it can be over in hours. The bounce ending is not about time, though; it ends when the buying dries up, which shows as fading volume and a stall under a broken level.
Is a dead cat bounce bullish or bearish?
It is bearish. The bounce looks bullish for a few candles, but the pattern is a continuation setup, so it resumes the existing downtrend once price breaks the prior low. The upward pop is the trap, not the signal. The only bullish outcome is when the supposed dead cat turns out to be a real bottom instead, which is why you wait for confirmation.
How do you trade a dead cat bounce?
The safe trade is to sell the resumption, not to buy the bounce. Confirm the market is below the 200-EMA, mark the trough that ended the decline, and let the bounce play out without chasing it. When price closes below the prior trough, enter short with a sell-stop, place the stop just above the last lower high, and target the next support or a measured projection of the first drop. Waiting for the low to break means price confirms the trap before you risk anything.
What timeframe is best for the dead cat bounce?
The daily is the core read on gold and Forex, because each setup reflects a real trend pausing. On crypto the 4-hour also works and prints more setups, especially with a genuine drop in volume on the bounce. The 1-hour is mostly noise on every market, so use it only to fine-tune an entry that the higher timeframe already set up.
How much money do you need to trade a dead cat bounce?
You can start with a small account if you pick the right market. Gold is hard to size on under about $1,000 because a sensible stop pushes the position below the one-ounce micro-lot minimum. A Forex pair like EUR/USD sizes cleanly on a $1,000 account: risking 2%, or $20, over a 70-pip stop works out to about two micro lots. Whatever the market, risk a small fixed slice per trade and only use money you can afford to lose.
🌍 Our recommended brokers


Reader Reviews
Be the first to review this — tell other traders what actually helped, or where it fell short.
Leave a Review

Quant Researcher & Systems Builder
Quantitative researcher who builds the automated systems behind Arxum strategy testing. Works in Python and Pine Script, using AI alongside classic backtesting to validate strategies on years of real data.