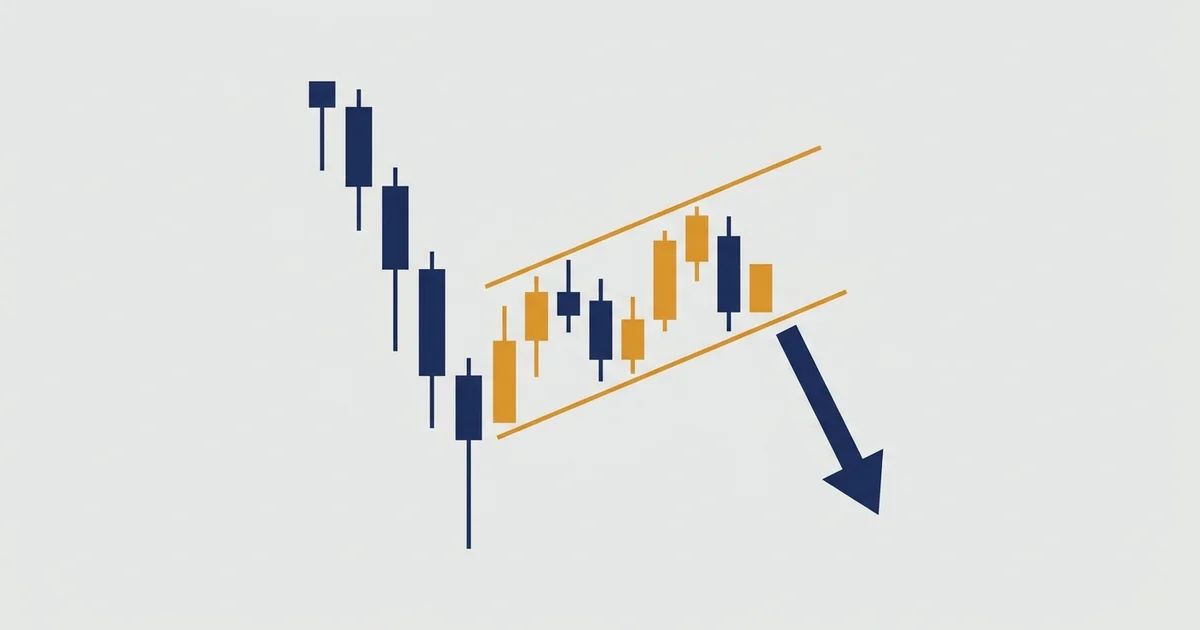

What the bear flag pattern actually is
A bear flag is a downtrend catching its breath. The move arrives in two bursts of selling with a short, deceptive pause between them.
Here is the shape the way a textbook draws it.
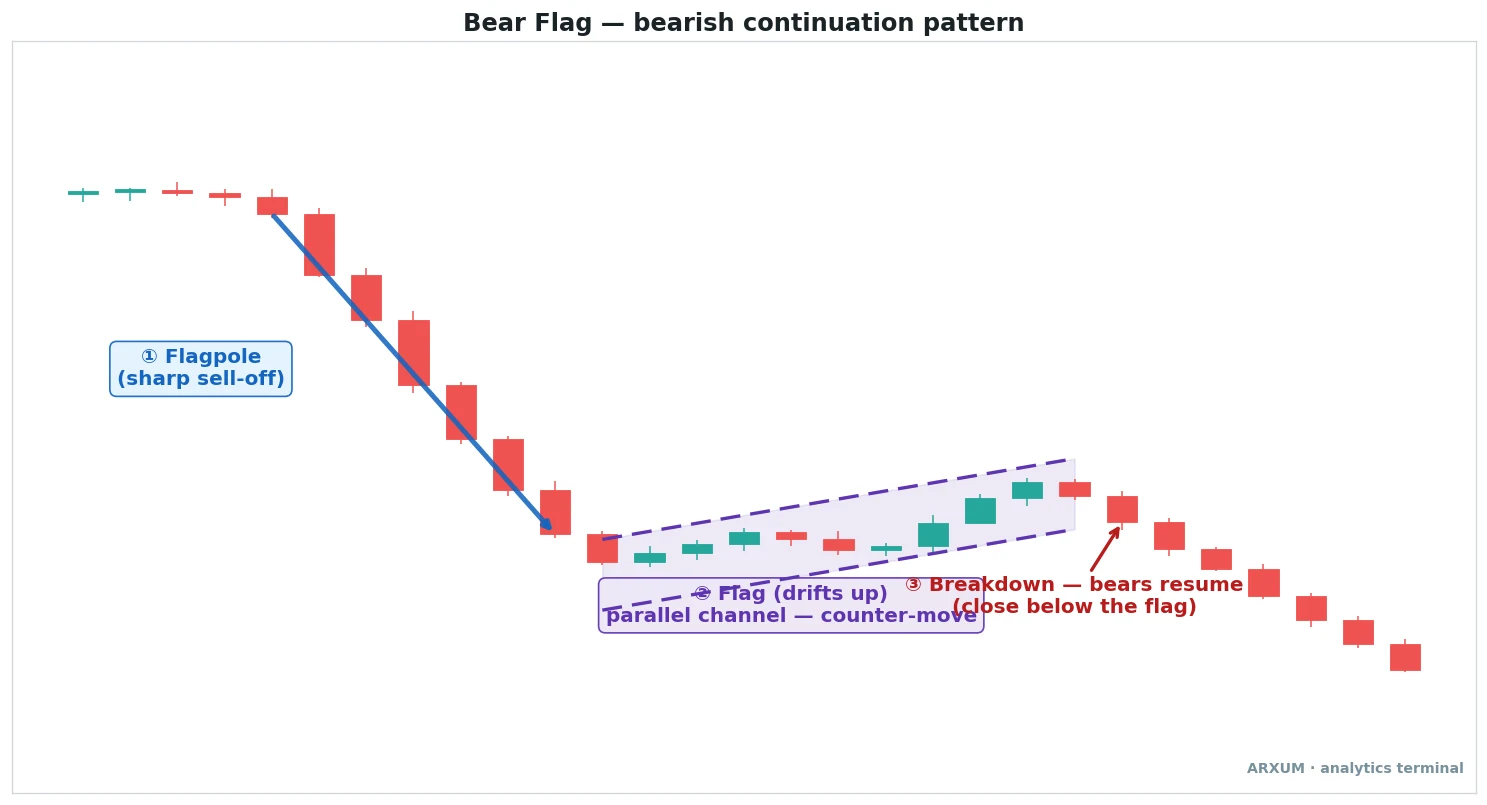
Now that the picture is on screen, the three parts are easy to name. Read them left to right.
- The flagpole: the sharp, one-way sell-off. This is the impulse, and its height sets the target.
- The flag: a small counter-move that drifts up against the pole in a tight channel. It should be shallow and should not give back much more than half the pole.
- The breakdown: a candle that closes back below the flag’s lower line, in the pole’s direction, and the fall resumes.
The flag is the trap. It looks like a recovery, buyers get interested, and then the sellers who were resting step back in.
That upward drift is not strength. It is a pause before the second leg down.
| Part | What it is | What to look for |
| Flagpole | The steep drop that starts the move | Wide down candles, one direction, little overlap |
| Flag | The counter-trend pause | A shallow drift up, tight and orderly |
| Breakdown | The trigger to sell | A close below the flag's lower boundary |
Bull flag and bear flag: the same shape, flipped
The bear flag is the exact mirror of the bull flag. If you already know one, you know both, you just reverse every direction.
The table below lays them side by side.
| Feature | Bull flag | Bear flag |
| Trend it continues | Uptrend | Downtrend |
| Flagpole | Sharp rally up | Sharp sell-off down |
| Flag drift | Drifts down against the pole | Drifts up against the pole |
| Trade | Buy the breakout | Sell the breakdown |
| Regime filter | Price above the 200-EMA | Price below the 200-EMA |
| Target | Pole height projected up | Pole height projected down |
One honest note carries over from the bull flag work. Over the last several years most markets trended up, so the long side had the wind behind it.
The bear flag is just as real and just as tradeable, but it is choosier: it only works when there is a genuine falling market underneath it, and those come around less often. More on that next.
The one rule that decides it: the regime
A bear flag is a continuation pattern. It continues a trend, so there has to be a downtrend there to continue in the first place.
Get this wrong and nothing else matters.
The cleanest filter is the 200-period exponential moving average, or 200-EMA, a single line your charting app draws from the last 200 candles.
Above it, the market is trending up. Below it, trending down.
| Where price sits | What it means | What to do with a bear flag |
| Below the 200-EMA | Downtrend, sellers in control | Trade it; the pattern has a trend to continue |
| Above the 200-EMA | Uptrend, buyers in control | Skip it; you would be shorting into strength |
| Flat, hugging the 200-EMA | No trend, chop | Wait; flags in a range fail both ways |
This is why the bear flag reads so differently market to market. An asset in a long one-way climb, like gold has been, spends most of its time above the 200-EMA, so they keep getting run over by the bigger uptrend.
An asset in a real correction spends time below it, and that is where the short side pays.
How to read each stage, and what to do with it
Spotting the shape is only half the job. The value is in knowing what each part of the pattern is telling you to do.
This is the core of the whole method.
| Stage | How you use it | Best read |
| Flagpole | Confirms the trend and sizes the target | Steep, wide candles, one direction |
| Flag | Wait, do not chase the bounce | A shallow drift up, tight channel, holds most of the pole |
| Breakdown | Your trigger to sell | A decisive close below the flag's lower line |
| Stop | Caps the loss if the flag holds | Just above the flag's high |
| Target | Where you plan to cover | Flagpole height projected down from the breakdown |
| Regime | The go or no-go switch | Price below the 200-EMA |
A word on how the target works, because it is the simplest part and the one beginners skip. Measure the flagpole from top to bottom.
Take that distance and project it downward from the point where price breaks the flag. That projected level is your first target, and it is what gives the pattern its natural reward against risk.
The risk-reward ratio guide takes that math apart in plain terms.
The bear flag on gold: only in a real down-leg
Spot gold (XAU/USD) prints textbook flags, but it is the classic example of the regime problem. Gold has spent long stretches climbing, so most of its flags sit inside a bigger uptrend and get bought back.
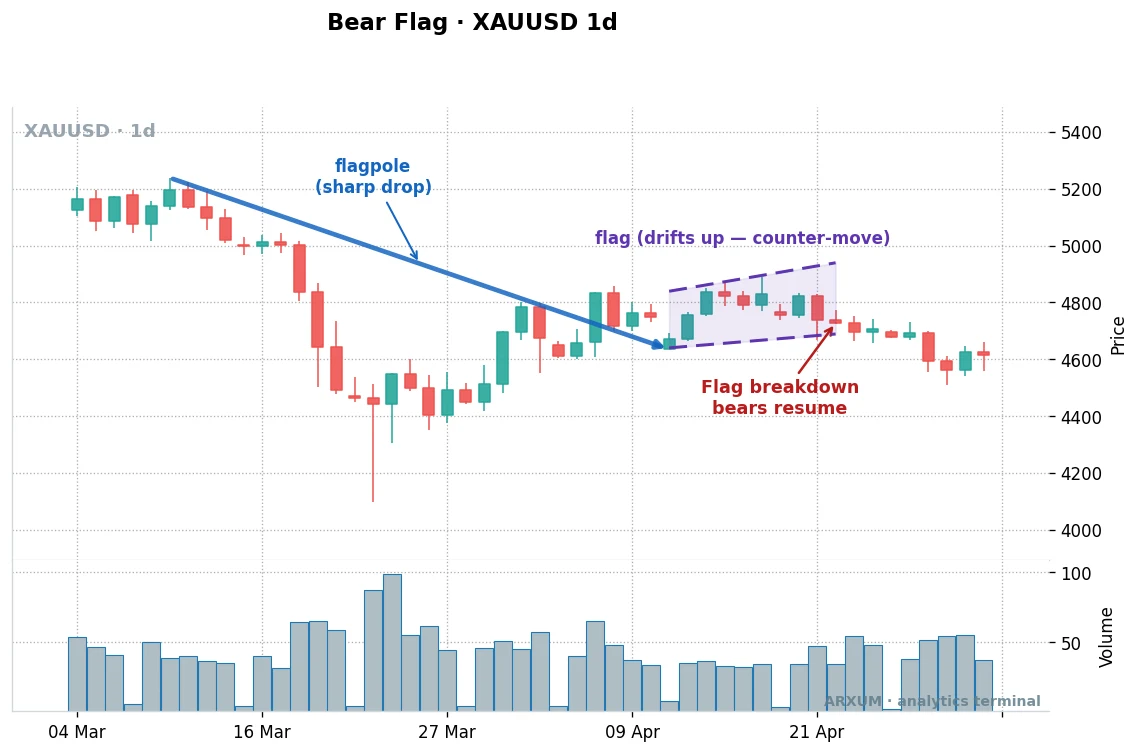
On that gold chart, the sequence is clean. A sharp drop forms the flagpole, price pauses and drifts up into the shaded channel, and the breakdown label marks where it fails lower again.
- How it looks on gold: long, deliberate flagpoles; patient flags that can take a week or two to form on the daily.
- The catch: a safe-haven bid can cut a gold downtrend short at any time, so the flag needs the 200-EMA firmly overhead.
- The volume trap: gold shows tick volume, not real traded volume, so a volume spike on the breakdown is unreliable. Read the structure, not the volume bar.
| Market | Best timeframe | What to lean on |
| Spot gold (XAU/USD) | Daily | The 200-EMA regime and a clean flagpole |
| Silver (XAG/USD) | Daily | Same, but expect wider flags and more fakeouts |
| Oil (WTI) | Daily | Cyclical, so real down-legs happen; wait for the close |
Gold’s own support and resistance levels matter here too. A bear flag that breaks down right into a well-tested support shelf is a lower-quality short than one breaking into open air.
The bear flag on Bitcoin and crypto: where the short side breathes
Bitcoin is the friendlier home for the bear flag, and the reason is simple. Crypto has sharp, deep corrections, so it spends real time below the 200-EMA, and that is exactly the regime the pattern needs.
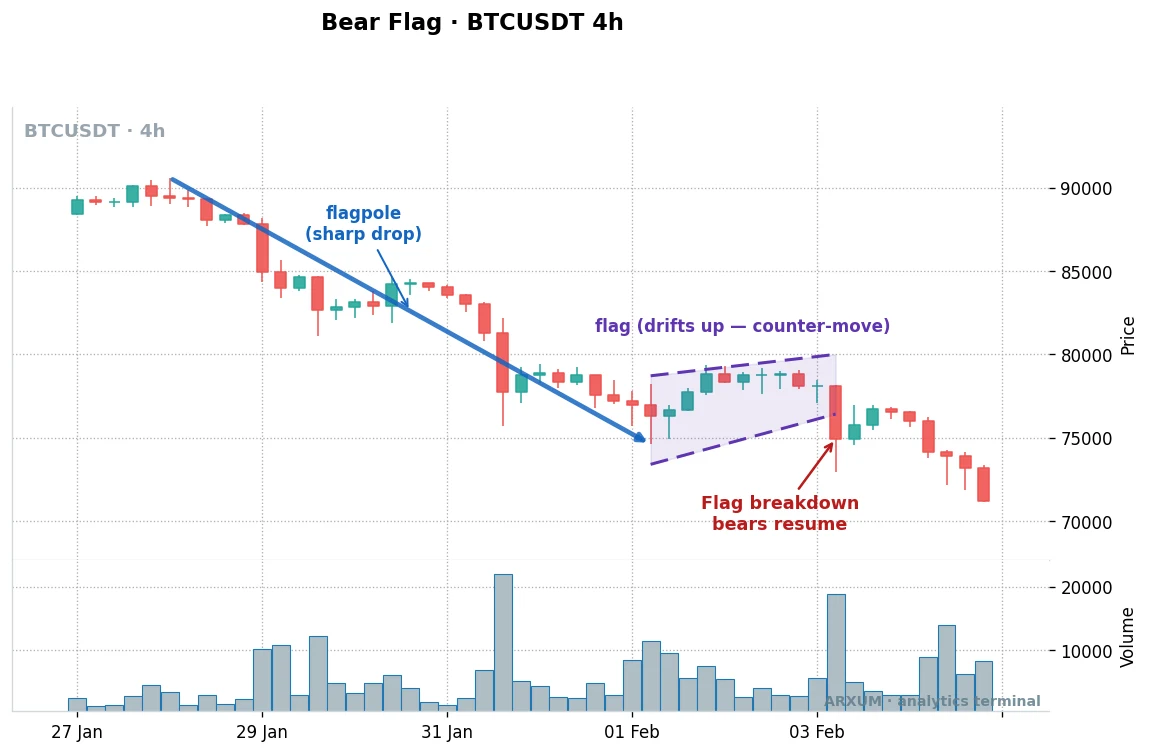
That BTC chart is a bear flag in its natural habitat, a downtrend that pauses, drifts up, and rolls over. Crypto gives you two things gold cannot.
- Real downtrends: corrections of 20% or more are routine, so there is a genuine trend to continue.
- Real volume: exchanges report every coin traded, so a volume surge on the breakdown is a true tell, not a guess.
- Faster flags: the 4-hour chart prints far more flags than the daily, which suits an active trader.
| Setup | How to use it | Best read |
| BTC in a correction | The core bear flag home | 4-hour and daily, price below the 200-EMA |
| Breakdown volume | Adds real conviction | A visible volume surge on the break candle |
| Altcoins | Sharper but noisier | Only in a clear BTC-led sell-off |
The volume difference is the one place gold and crypto genuinely split. It is worth its own small table, because it decides whether you trust that spike on the breakdown or ignore it.
| Market | Volume shown | Trust a spike on the break? |
| Bitcoin, crypto | Real exchange volume | Yes, a surge confirms the breakdown |
| Gold, silver, oil | Tick volume, a proxy | No, read structure instead |
| EUR/USD, GBP/USD | Tick volume, a proxy | No, lean on the trend and the flag shape |
The bear flag on Forex majors
The majors sit between gold and crypto. EUR/USD and GBP/USD trend in clean legs, and when one of those legs is down, flags inside it read well.
- In a trending leg: flags are orderly and the breakdown is reliable.
- In a range: the same shape fires constantly and fails both ways, so the 200-EMA filter is doing the heavy lifting.
- The volume rule: like gold, Forex shows tick volume, so skip the volume filter and trade the trend and the structure.
| Pair | Best timeframe | Condition |
| EUR/USD | Daily, 4-hour | Price below the 200-EMA, a clear down-leg |
| GBP/USD | Daily, 4-hour | Trends hard, so flags are clean when the trend is real |
| Yen crosses | Daily | Strong moves, but news-driven; mind the calendar |
Which timeframe to watch it on
The chart you use changes the pattern more than most people expect. The same flag is a real signal on the daily and mostly noise on the 1-hour.
| Timeframe | Character | Best use |
| Daily (D1) | Fewer, cleaner flags; each is a real trend pausing | The core read on gold and Forex |
| 4-hour (H4) | More flags, more noise; suits crypto | Crypto corrections with a volume check |
| 1-hour (H1) | Mostly noise; most flags are not real | Skip, or use only to time an entry the daily already set up |
There is a practical tell hidden in that. If you find yourself taking many flag trades a day, you have drifted down to a chart where the edge is gone.
More signals is not more opportunity here. It is the warning light that you are trading noise, so step back up a timeframe.
How to trade the bear flag, step by step
The rules are mechanical, which is what makes this a good pattern for a newer trader. Here is the whole method as a checklist.
- Confirm the downtrend. Price must be below the 200-EMA. No downtrend, no bear flag. This is the filter that saves you.
- Find the flagpole. A steep, one-way drop on wide candles. That impulse is the trend you plan to join.
- Wait for the flag. A shallow drift up in a tight channel. It should hold most of the pole. If it retraces more than about half, the momentum is gone, so pass.
- Sell the breakdown. Enter on the candle that closes below the flag’s lower line. On crypto, a volume surge on that candle adds conviction. On gold and Forex, do not wait for one.
- Place the stop and target. Stop just above the flag’s high. Target the flagpole’s height projected down from the breakdown. You can cover part of the position at the halfway mark and trail the rest, which means moving your stop down behind price as the trade goes your way to lock in gains. Never widen the stop.
On order placement, you do not have to sit and watch for the close. Most platforms let you leave a sell-stop order, an instruction that automatically sells the moment price trades below a level you set, just under the flag’s lower line.
In the same order ticket you fill the stop-loss field just above the flag’s high and the take-profit field at your measured target, so the whole trade, entry, exit, and safety net, is placed in one go. The breakdown is a form of breakout trading, just to the short side.
Sizing, in plain numbers. Risk a small fixed slice of the account, usually 1 to 2%, per trade, and let the distance from your entry to the stop decide the position size, never the other way around.
Say you risk $10 and your stop sits $50 above your entry: you take a size where each $1 move is worth 20 cents, so a $50 move against you hits the stop for your $10 and nothing more.
A tighter flag means a closer stop, which lets you trade a bigger size for the same fixed dollar risk.
One discipline rule sits on top of the math. A pattern that leans on a trend will hand you losing streaks when that trend stalls.
Two or three losses mean nothing. A run of five or six in a row means the downtrend has probably rolled over, so stand down and wait for price to settle firmly back below the 200-EMA before the next short.
That is the cue to stop, not to size up and win it back.
Where the bear flag fails
The losers teach the pattern as well as the winners do. Almost every failed setup comes from one of these.
- Shorting into an uptrend. A bear flag above the 200-EMA has no downtrend to continue. This is the number one mistake, and the regime filter exists to stop it.
- A deep flag. If the counter-move gives back more than half the pole, the sellers have lost the thread. Skip it.
- Chasing the flag itself. The upward drift tempts you to buy the bounce. That is trading against the pattern. Wait for the breakdown.
- Trusting tick volume. On gold and Forex, a volume spike on the break is a proxy, not proof. Do not build a trade on it.
- The wrong timeframe. On the 1-hour, most flags are noise. No filter rescues a pattern on a chart that is mostly random.
Decision table: what to do, at a glance
| Situation | Do this |
| Below the 200-EMA, clean pole, tidy flag | Sell the close below the flag |
| Crypto, breakdown on a real volume surge | Take it; the volume adds conviction |
| Gold or Forex, waiting for a volume spike | Do not wait; trade the structure |
| Price above the 200-EMA | Skip it; no downtrend to continue |
| Flag retraced more than half the pole | Skip it; momentum is gone |
| Many flags per day on the 1-hour | Step up a timeframe; that is noise |
| Five or six losses in a row | Stop; the trend has likely stalled |
What works: the short version
If you remember three things about the bear flag pattern, make it these.
- Regime first. Only take it below the 200-EMA, in a market with a real downtrend. That single filter fixes most bad trades.
- Wait for the close below the flag. The drift up is the trap. The breakdown is the trigger. Sell that, stop above the flag, target the pole projected down.
- Match the market to the volume. On crypto, use the volume surge; on gold and Forex, ignore it and trade the trend and the shape.
The bear flag is the mirror of the bull flag, and it works the same way, just on the short side and only where the trend earns it. For a reversal pattern built to spot a top rather than continue a fall, see the double top and double bottom guide.
Glossary
- Flagpole: the sharp, fast move that starts the pattern. Its height sets the target.
- Flag: the shallow counter-move that pauses the trend before it resumes.
- Breakdown: the candle that closes below the flag and triggers the short.
- Continuation pattern: a shape that resumes the existing trend, not one that reverses it.
- 200-EMA: the 200-period exponential moving average, a trend filter; below it means a downtrend.
- Tick volume: a count of price updates, shown by gold and Forex platforms in place of real traded volume.
- Measured move: projecting the flagpole’s height from the breakdown to set the target.
FAQ
What is the bear flag pattern in trading?
The bear flag is a bearish continuation chart pattern. Price drops sharply in a move called the flagpole, then pauses and drifts upward in a small channel, the flag, before breaking down again to continue the fall. You sell the close below the flag, place the stop just above it, and target the flagpole's height projected down from the breakdown.
Is a bear flag bullish or bearish?
It is bearish. The upward drift of the flag looks like a recovery, but it is a pause, not a reversal. The pattern is a continuation setup, so it resumes the existing downtrend once price breaks below the flag. The counter-trend bounce is the trap, not the signal.
What is the difference between a bull flag and a bear flag?
They are mirror images. A bull flag has an upward flagpole, a flag that drifts down, and a breakout up, traded long in an uptrend. A bear flag has a downward flagpole, a flag that drifts up, and a breakdown, traded short in a downtrend. Every direction is simply reversed, including the trend filter: a bull flag needs price above the 200-EMA, a bear flag needs it below.
Does the bear flag pattern actually work?
It works, but only where there is a real downtrend to continue. That is the whole condition. In markets that trended up for years, like gold, bear flags kept getting bought back. In markets with genuine corrections, like Bitcoin, the short side has room to work. The pattern is real; the regime decides whether it pays.
How do you set the target on a bear flag?
Measure the flagpole from its top to its bottom, then project that same distance downward from the point where price breaks below the flag. That projected level is your first target. Because the stop sits just above the flag while the target is the full pole, the pattern naturally offers a favourable reward against risk.
Where do you put the stop loss on a bear flag trade?
Just above the flag's high. That is the natural invalidation point: if price climbs back above the flag, the breakdown has failed and the pattern is void. Placing the stop all the way at the top of the flagpole is far too wide and ruins the reward against risk.
What timeframe is best for the bear flag?
The daily is the core read on gold and Forex, because each flag reflects a real trend pausing. On crypto, the 4-hour also works and prints more setups, especially with a real volume surge on the breakdown. The 1-hour is mostly noise on every market, so use it only to fine-tune an entry the higher timeframe already set up.
Do you need volume to confirm a bear flag breakdown?
It depends on the market. On Bitcoin and crypto, exchanges report real traded volume, so a surge on the breakdown is a genuine tell worth waiting for. On gold and Forex, the platform only shows tick volume, a count of price updates rather than money traded, so the spike is unreliable. Use volume on crypto and ignore it elsewhere, leaning on the trend and the flag shape instead.
Why did my bear flag trade fail?
The most common reasons are a missing downtrend, a flag that is too deep, or the wrong timeframe. A bear flag above the 200-EMA has no downtrend to continue and gets run over. A flag that retraces more than half the pole has lost its momentum. And a flag on the 1-hour is often just noise. Confirm the regime first, keep the flag shallow, and trade the daily on gold and Forex.
Real-time trade setups with entry, stop loss and take profit. Daily market analysis. No subscription, no complicated theory.
🌍 Our recommended brokers


Reader Reviews
Be the first to review this — tell other traders what actually helped, or where it fell short.
Leave a Review

Momentum Trader & Technical Analyst
Trades momentum across crypto and forex since 2019, built around RSI, MACD, and volume. Turns discretionary setups into rule-based, systematic entries and validates them on data before they go live.
