
For the wider map of breakout and reversal shapes, see the chart patterns guide. This piece takes flag pattern trading and finds where it actually pays, and which piece of common advice to ignore.
What the pattern actually is
A flag is a trend catching its breath. The move comes in two bursts with a pause between them.
- The pole: a sharp, fast move in one direction. This is the impulse, the part everyone sees.
- The flag: a short consolidation right after, drifting gently against the pole in a tight channel. It should be smaller than the pole and should not give back more than about half of it.
- The breakout: a candle that closes back out of the channel in the pole’s direction, continuing the trend.
The target is the simplest part: take the height of the pole and project it up from the breakout. Here are both versions, the way a textbook draws them.
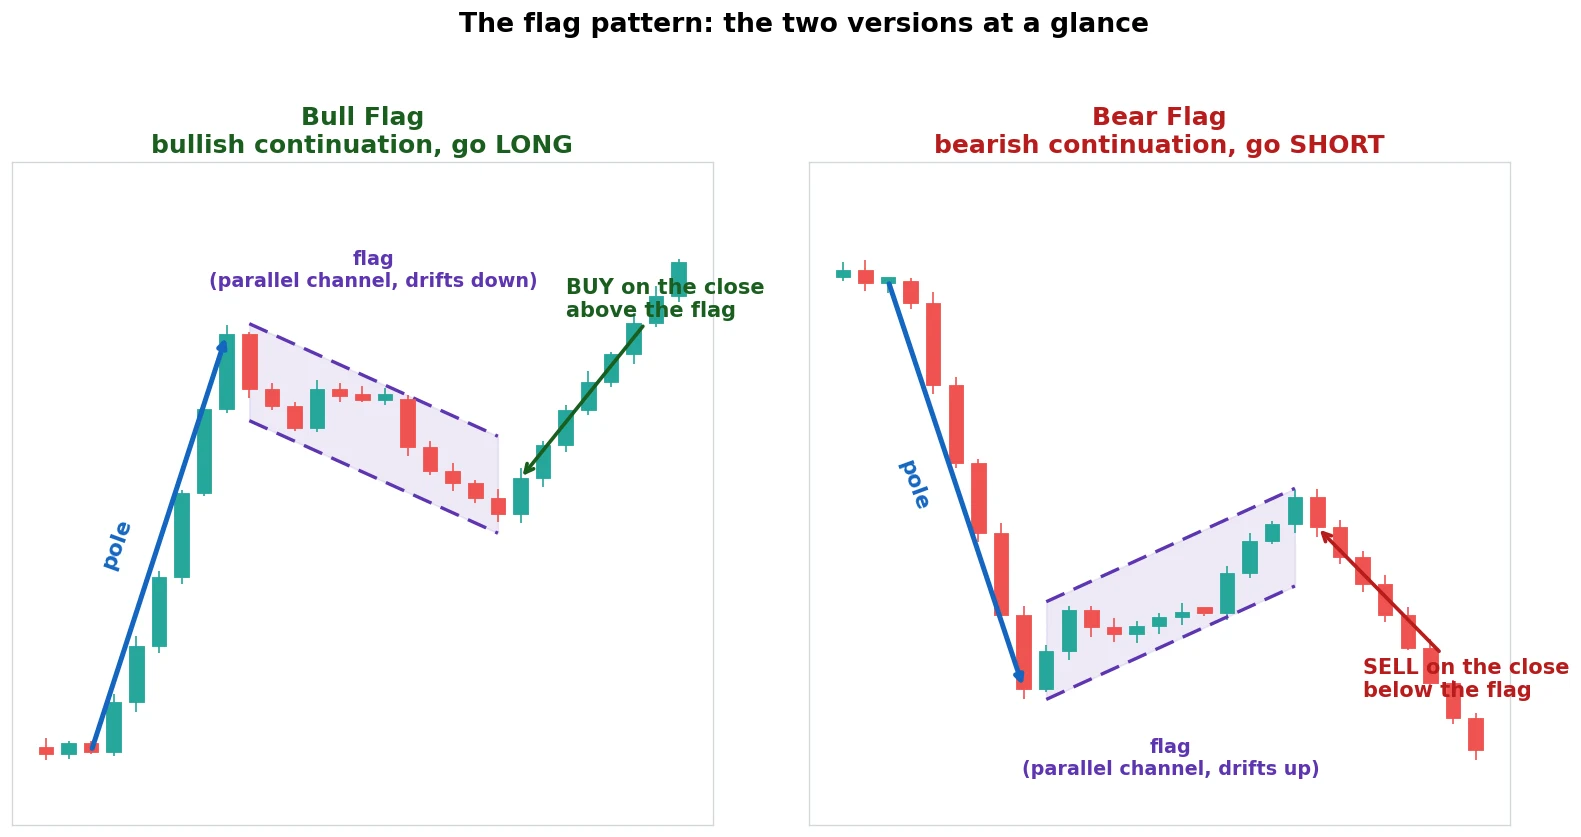
A word on direction. I tested the bear flag as a full short, not as an afterthought, and it is real, but second-class. It only pays where there is a genuine downtrend to continue, like a Bitcoin correction. Shorting flags into a market that grinds up for years, the way gold has, loses. More on that near the end. The bullish flag is the main event, so here it is in battle mode, on gold’s daily chart in 2024.
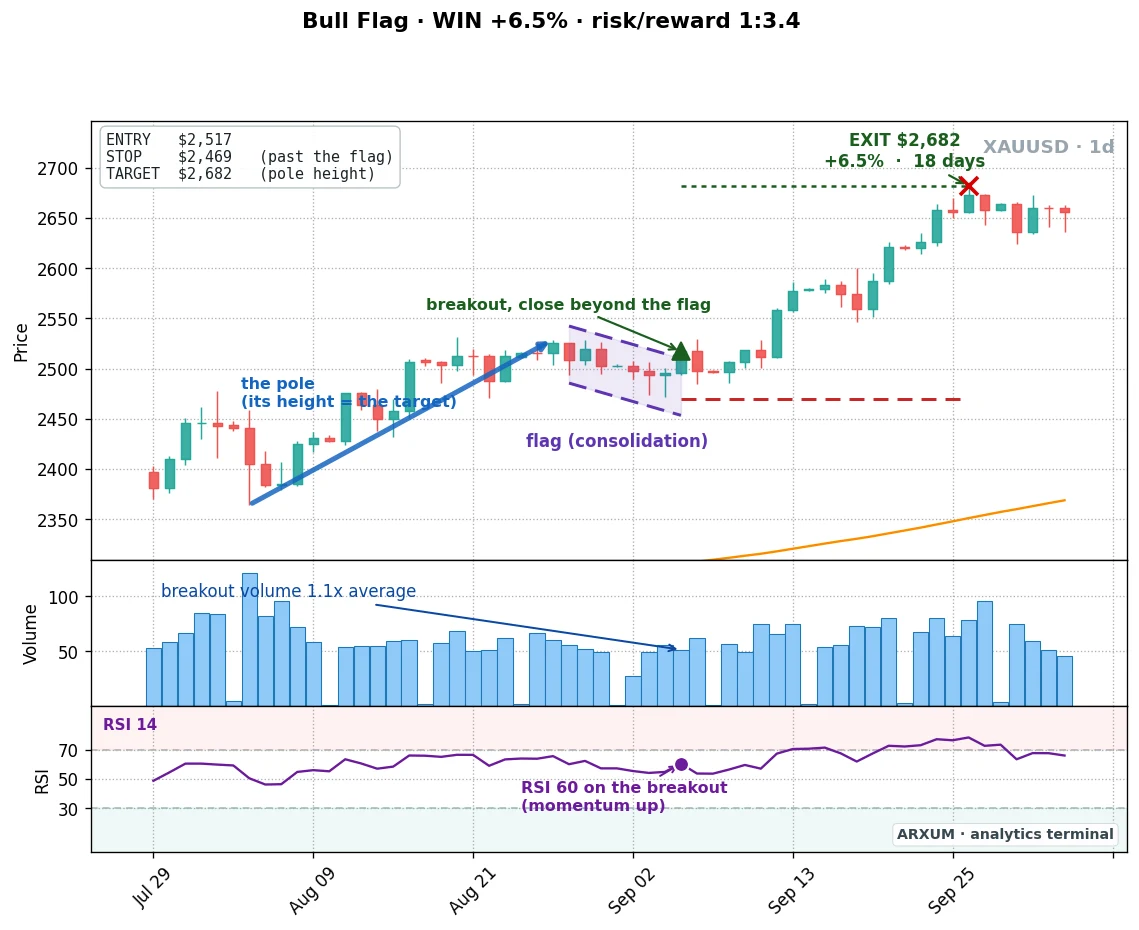
Four things define the trade, and they are all on that chart:
- The pole, the steep run that sets the trend and the target distance.
- The flag, a tight channel that drifts against the pole and holds most of it.
- The entry, on the candle that closes back out of the channel.
- The target, the pole’s height projected from the breakout, with the stop just past the flag.
That is the textbook. Now the part the textbook gets half-wrong.
The honest part: the flag pays, but not because of volume
Most patterns are picky about where they work. The cup and handle, for instance, needs a trending market on a slow chart and fails everywhere else. The flag is different, and more forgiving.
I built a detector that finds every clean pole-and-flag, then traded the breakout by the book across gold, the euro, the pound, and Bitcoin. On the daily chart, every one of them made money.
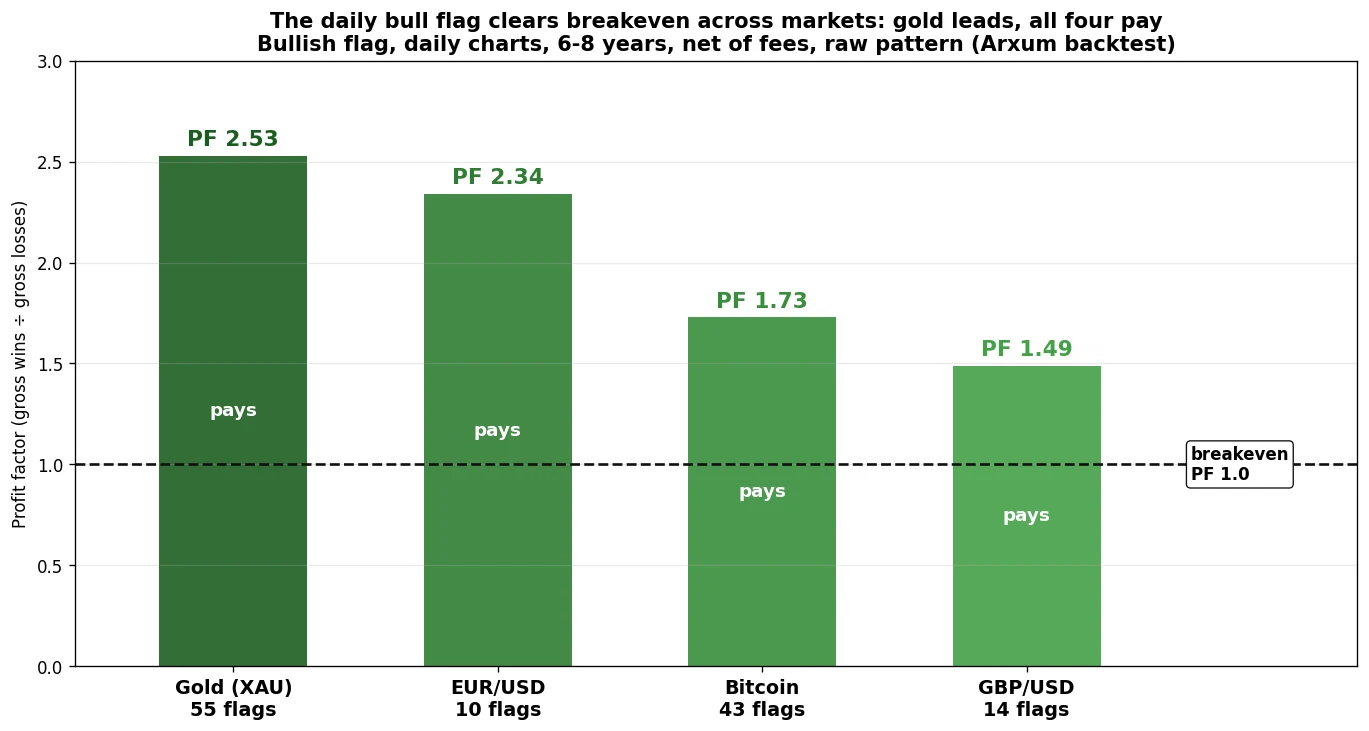
Gold led at a 2.53 profit factor, the euro followed at 2.34, Bitcoin at 1.73, and the pound at 1.49. Every market in the green.
That makes sense once you see what a flag is. It is just a trend moving in two bursts, and every market that moves in bursts, which is all of them, prints flags. The flag is the most democratic pattern there is.
So if it pays everywhere, where is the catch? It is in the one piece of advice every flag guide repeats: wait for a volume surge on the breakout. That rule is either the best filter you have or a fast way to lose money, and which one depends entirely on the market.
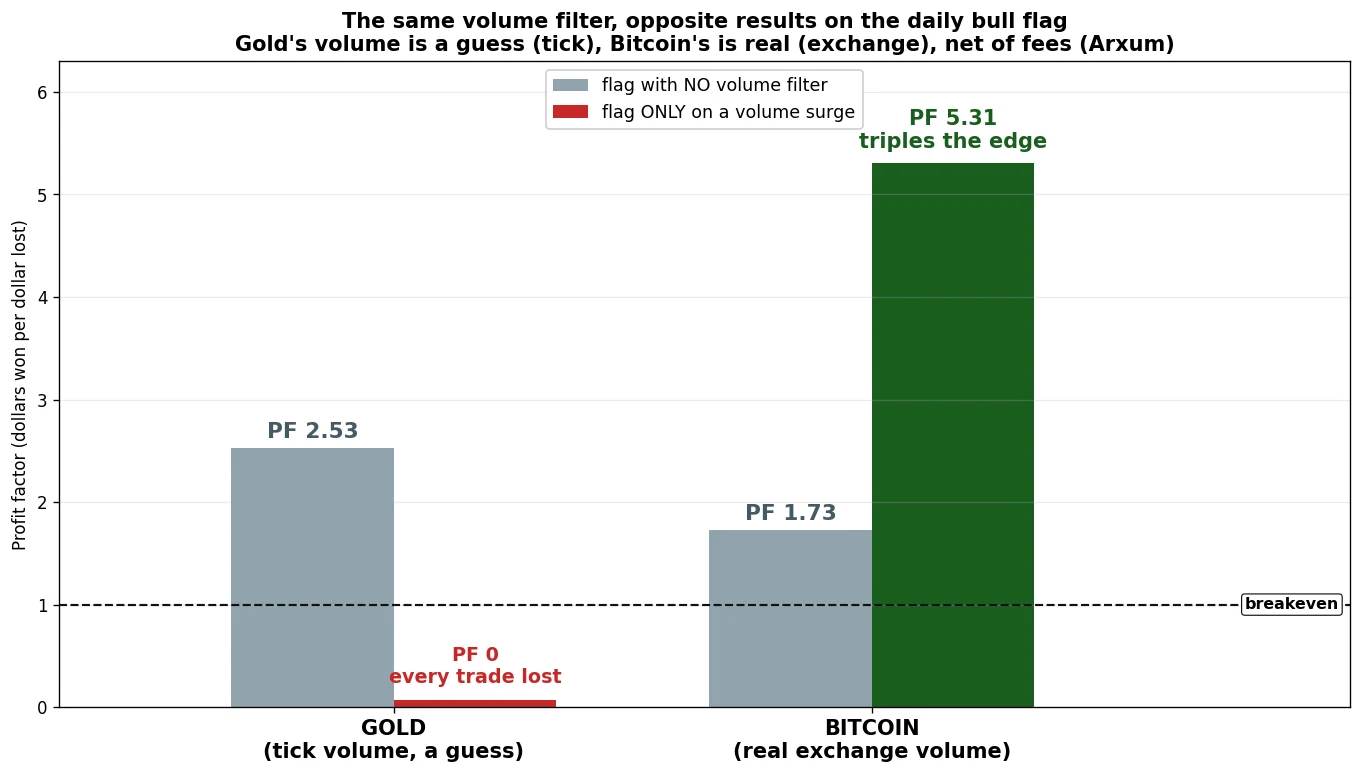
Look at the two sides of that chart.
On Bitcoin, filtering for breakouts that fire on real volume took the daily bull flag from a 1.73 profit factor to 5.31. The volume surge is a genuine edge.
On gold, the same filter took a healthy 2.53 and destroyed it. Only three of fifty-five gold breakouts even had a volume spike, and all three lost.
Same rule, opposite outcome. The reason is what the volume number actually is.
Why the volume rule lies on gold and tells the truth on Bitcoin
Bitcoin trades on exchanges that report every coin changing hands. When the chart shows a volume spike, real money really did pile in. That is a signal worth waiting for.
Gold and Forex have no single exchange. The “volume” your platform draws is tick volume, a count of how many price updates arrived, not how much was traded. It is a rough proxy at best.
On a daily gold candle, tick volume is so smoothed out that a real surge almost never registers. The rare spikes that do show up tend to come at exhaustion, the blow-off top of a move, exactly the wrong moment to buy.
So the honest method for the flag is not one rule, it is two, depending on what your volume is made of:
- On gold and Forex (tick volume): trade the pattern with the trend and the measured move. Skip the volume filter. The chart can’t tell you what you need, so don’t ask it.
- On crypto (real volume): add the volume filter. It is a scalpel, and a quiet breakout is the one to avoid.
One thing both methods keep is the trend regime. A flag is a continuation, so you only take a bull flag when price is above the 200-period EMA, a single line your charting app draws from the last 200 candles: above it the market is trending up, below it down. You trade with that trend, never against it.
The setup on gold’s daily chart
The daily gold bull flag is the cleanest setup in the whole test. Trade it with the trend, target the pole, and ignore the volume noise.
Traded completely raw it returned a 2.53 profit factor. Taking it only with the trend, when price was above the 200-EMA, lifts that to a 2.68 profit factor over 52 trades at 44 percent wins. That 2.68 is the gold number to remember.
A 44 percent win rate that makes good money looks wrong until you see the reward. At a reward-to-risk near 1:3.4, the average winner was more than three times the average loser, so being right under half the time still adds up.
And the edge held in both halves of the data: a 2.50 profit factor in the first four years, 2.81 in the last four. An edge that survives out of sample, meaning the years it was not tuned on, and even firms up, is the opposite of a curve-fit. Here is the full trade history.
| Trades | 52 |
| Win rate | 44% |
| Average win / loss | +7.9% / −2.3% |
| Reward-to-risk | 1:3.4 |
| Profit factor | 2.68 |
| Max drawdown | −14% |
| First half / second half PF | 2.50 / 2.81 |
| $1,000 at 2% risk | → $2,809 |
That is not one lucky trade carrying the results either. The equity curve climbs in steady steps, not a single cliff, across the full eight years.
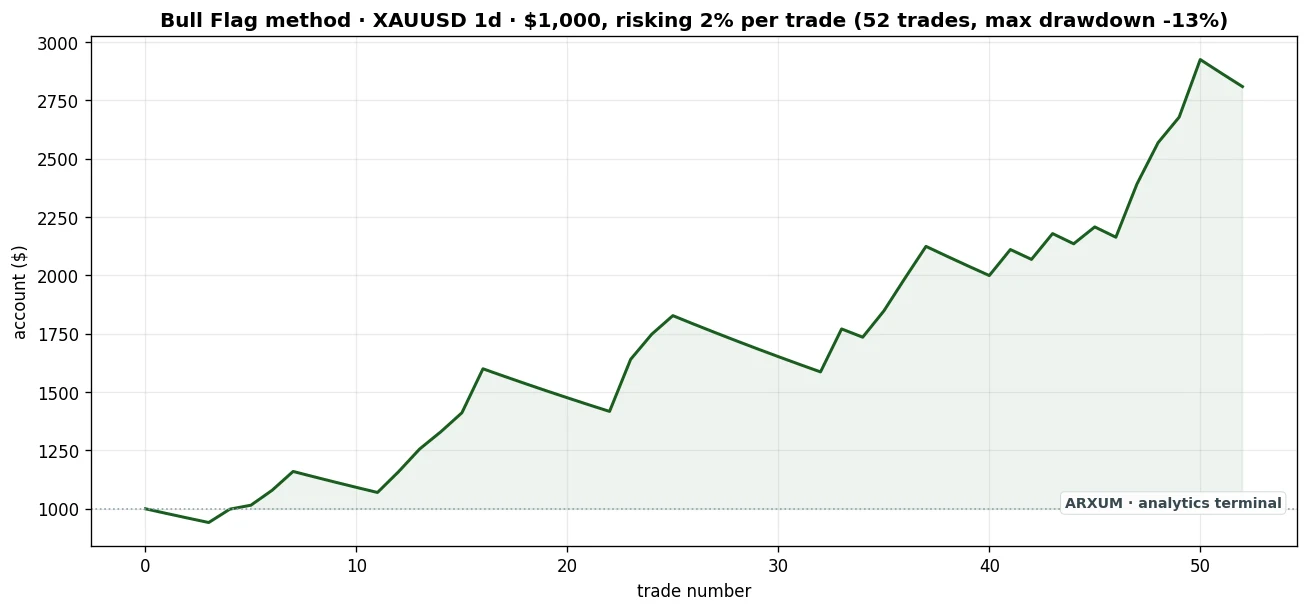
Not every one wins, of course. Here is a recent loss, so you see the other half honestly.
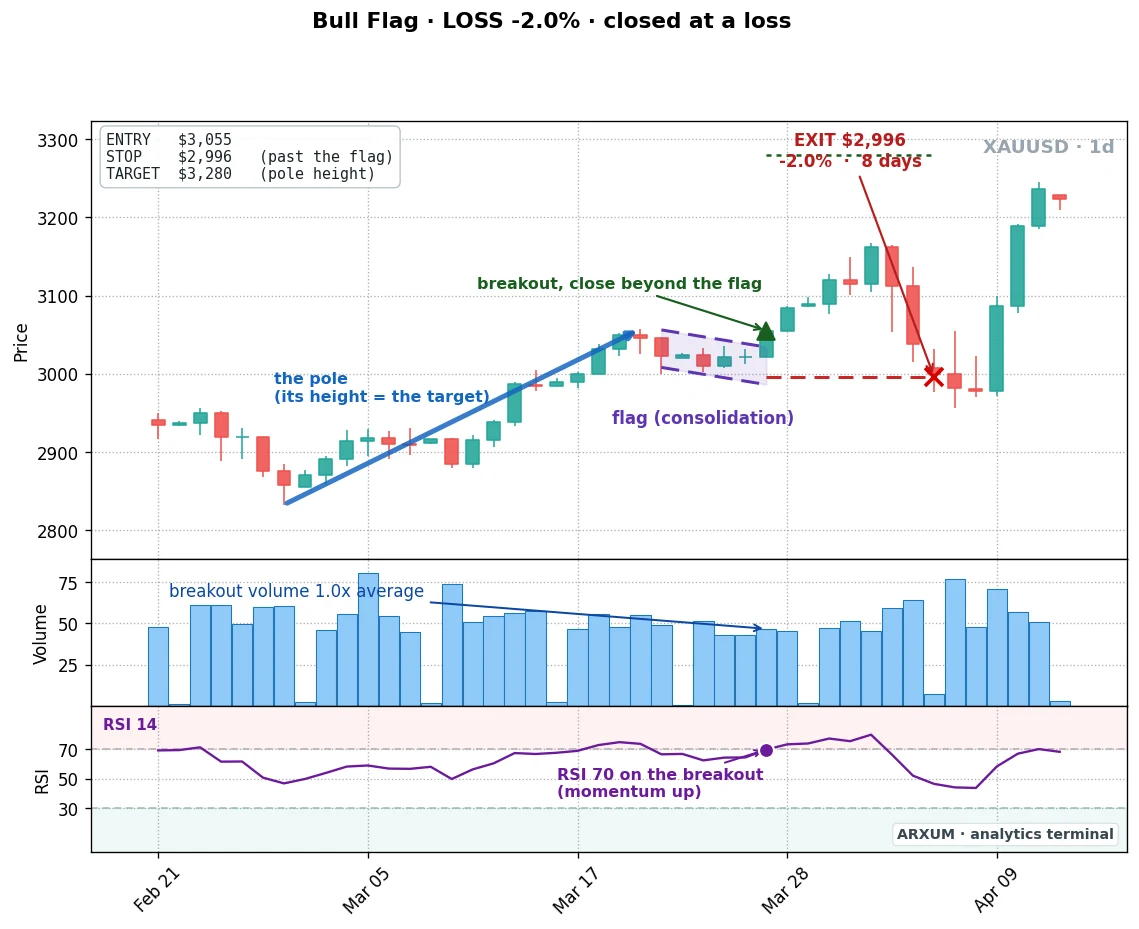
A 2 percent loss against winners worth nearly 8 percent on average. That gap, not the win rate, is where the money is.
The setup on Bitcoin: where the volume filter earns its keep
Bitcoin is the mirror image of gold, and the reason is its real volume.
Traded raw, the daily Bitcoin bull flag returned a 1.73 profit factor over six years, already profitable. But because its volume is real, you can sharpen it the way the textbook promises.
| Raw, no filter | 43 trades · 37% win · PF 1.73 |
| Only breakouts on a volume surge | 7 trades · 57% win · PF 5.31 |
| Volume surge + above the 200-EMA | 5 trades · 80% win · PF 16.4 |
Demand a real volume surge and the profit factor jumps from 1.73 to 5.31. Add the trend regime on top and the five trades that qualified won four of them.
The sample gets small fast, because a textbook-clean signal on Bitcoin is rare. But every one of them was a real, identifiable moment. Here is the clearest.
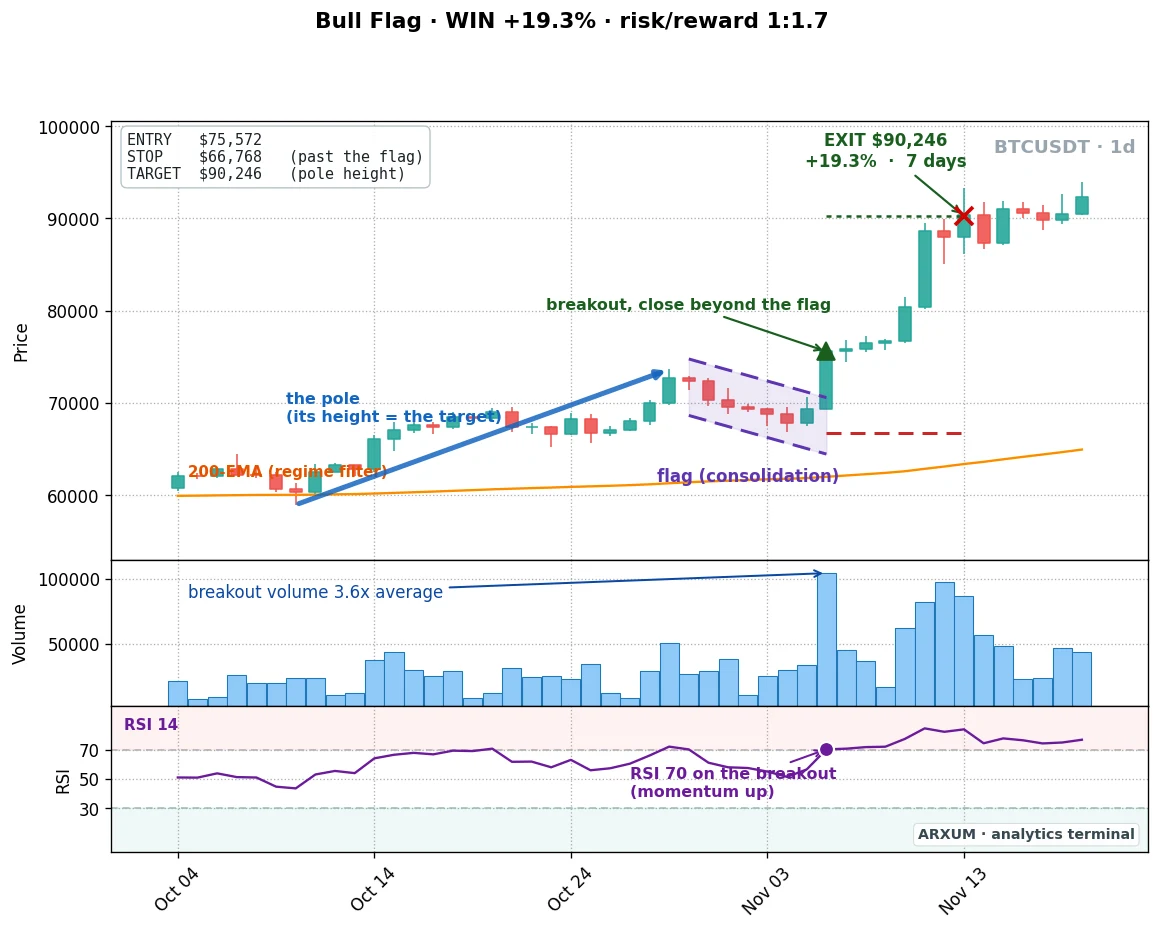
If you would rather have more signals than the daily offers, the 4-hour Bitcoin chart prints them far more often, over 300 raw flags in six years, and stays profitable with the volume filter at a 1.45 profit factor. Its edge did fade in the most recent stretch, though, so treat the 4-hour as the higher-frequency, lower-quality cousin of the daily. Here is the headline daily record.
| Trades | 35 |
| Win rate | 46% |
| Reward-to-risk | 1:2.7 |
| Profit factor | 2.23 |
| Max drawdown | −53% |
| First half / second half PF | 1.15 / 3.33 |
| $1,000 at 2% risk | → $2,174 |
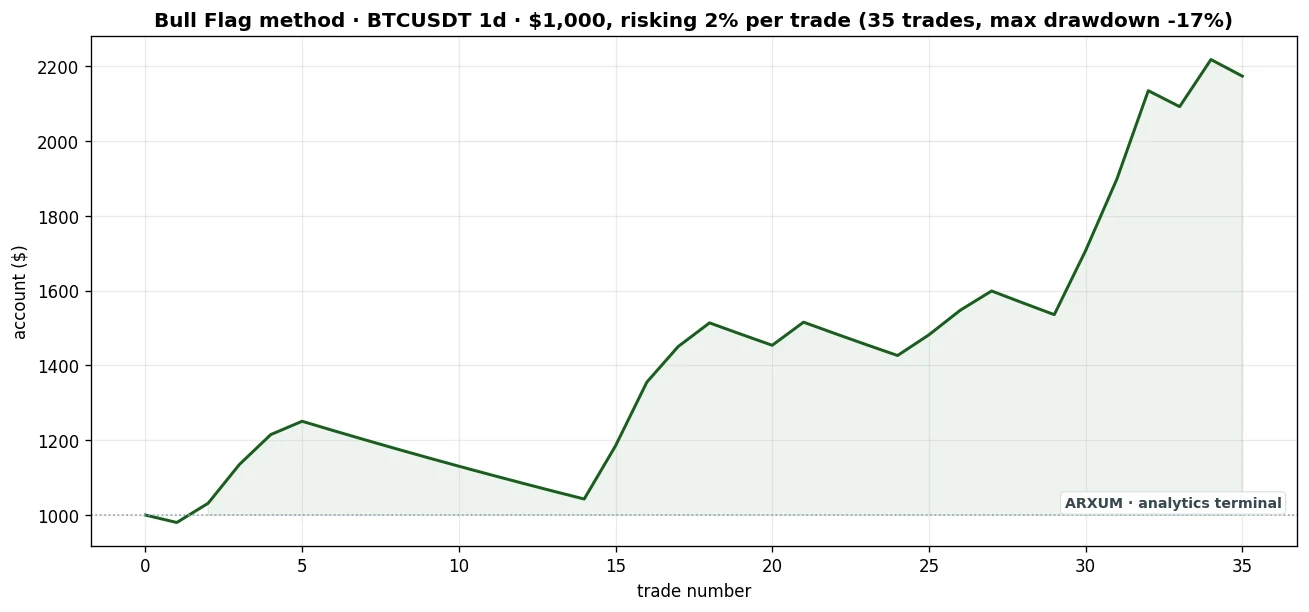
A word on which Bitcoin number to trust. The 5.31 and 16.4 in the filter table are real, but they ride on just seven and five textbook-perfect signals. The honest number to remember for Bitcoin is the 2.23 profit factor over 35 trades, with the volume filter as the thing that pushes the best of them higher.
Two honest notes on top of that. That 53 percent drawdown is real, far deeper than gold’s 14 percent, and most of the edge sits in the recent bull market, the 1.15 to 3.33 split. Bitcoin pays more and hurts more. Size it smaller than you would gold.
Why a 44 percent win rate still makes money
A method that wins fewer than half its trades and still turns a profit trips people up, so it is worth slowing down on the two numbers behind it, because they measure different things.
Reward-to-risk is one trade’s shape. The gold flag’s 1:3.4 says a typical winner returned about three and a half times what a typical loser cost. That is the engine: you lose small and often, you win big and less often, and the size of the wins more than covers the misses.
Profit factor is the scoreboard for the whole run, every dollar won divided by every dollar lost. The gold flag’s 2.68 says it banked $2.68 for each $1.00 it handed back. One number is the per-trade shape, the other is the total. You want both above their line, and on the daily gold flag they are. The risk-reward ratio guide takes the first one apart in full.
The timeframe decides it too
Besides the market, there is the chart you watch it on, and here the flag breaks a comforting myth, that a pattern works on any timeframe as long as you adjust your stops.
To test it honestly, each chart gets the window that fits it. A daily pattern earns a long, eight-year look. A fast chart decays quicker and a stretch from years ago tells you little about today, so the 4-hour gets the most recent two years and the 1-hour the most recent one.
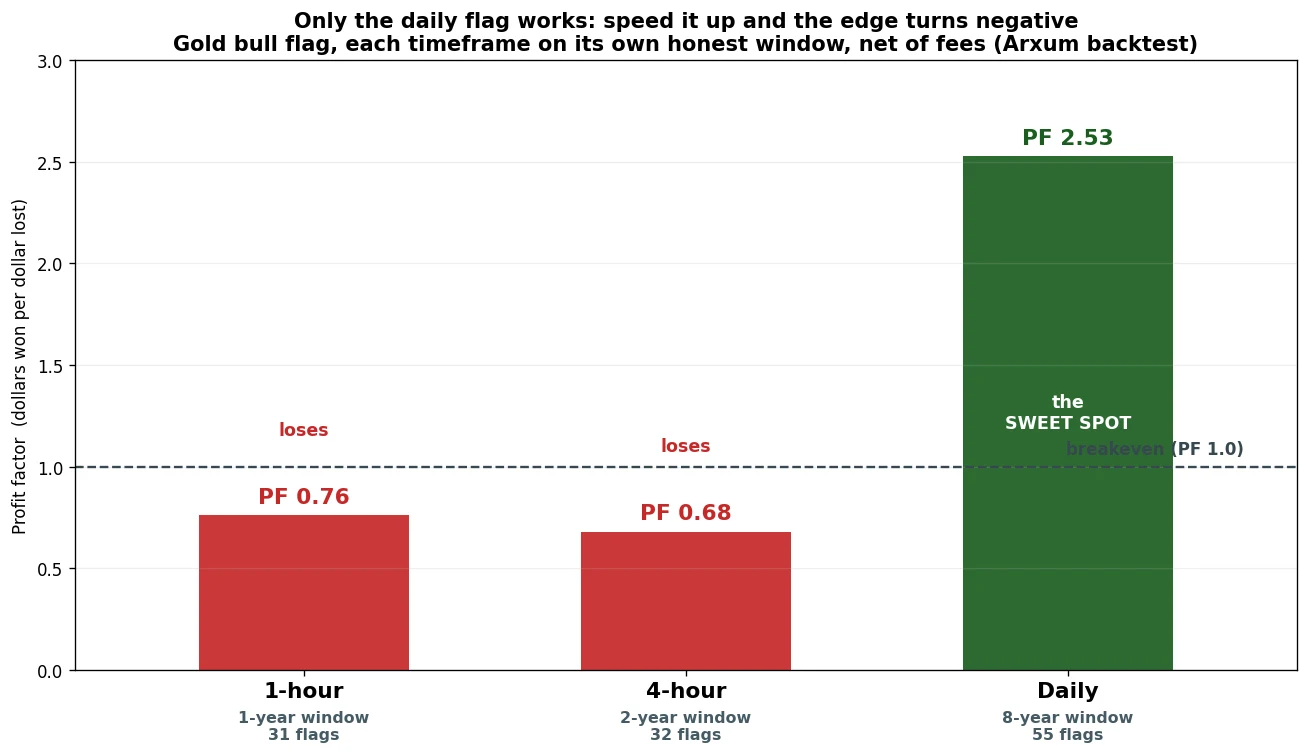
The daily was a 2.53. The 4-hour, over the recent two years, came in at a 0.68. The 1-hour, over the last year, a 0.76. Both sit below breakeven. Speeding the flag up does not just add noise, it flips the edge from positive to negative.
There is a practical tell hidden in that. If you find yourself taking far more than a handful of flag trades a month, you have drifted down to a chart where the edge is gone. More signals is not more opportunity here, it is the warning light that the method has stopped working. When the count climbs, step back up to the daily.
Position sizing, in plain numbers
Sizing rests on one idea: you risk the same small dollar amount on every trade, and the stop distance decides how big the position is, never the other way around.
Work it from the account down. Here is the gold winner from earlier, traded on XAU/USD, which is just gold priced against the US dollar, on a $1,000 account:
- Your risk budget. Risk 1 percent of the account. One percent of $1,000 is $10. That is the most this one trade can lose.
- Your risk per ounce. You buy gold at the $2,517 breakout and set the stop just past the flag at $2,469. The gap between them is $48, so every ounce you hold can drop $48 before the stop closes it.
- Your position size. Divide the budget by that per-ounce risk: $10 ÷ $48 = 0.21 of an ounce. That is all you buy, so a stop-out costs exactly your $10 and nothing more.
- Your payoff. The target is $2,682, which is about $165 above the entry. On 0.21 of an ounce that is 0.21 × $165 = roughly $34. You risked $10 to make $34: the 1:3.4 on this trade, in dollars.
Everything scales cleanly. A $5,000 account at the same 1 percent risks $50 and buys five times the size. Forex is identical, just with the stop measured in pips, the smallest step a price moves, and the position in micro-lots, the small beginner-sized Forex unit, instead of ounces. The sum never changes: risk budget divided by stop distance.
One discipline rule sits on top of the math. A method that wins in the mid-40s hands you losing streaks as a matter of routine, so two or three losses mean nothing. A run of five or six in a row means something: the trend the flag leans on has probably rolled over. That is the cue to stop, not to size up and win it back. Stand down, wait for price to settle firmly back above the 200-EMA, and let the next clean setup come to you.
And keep the numbers in proportion. They are the edge a patient trader earns across many trades, not a promise about the next one. The detector that found these flags is rigid where your eye is forgiving, and telling a crisp pole from a messy one is judgment that only screen time builds. So treat the backtest as a map rather than a guarantee, and lean on the flag hardest when it agrees with the things you already trust, a support level under the pole, a higher-timeframe trend pointing the same way. It is a tool, not a robot.
The bear flag: only where there is a downtrend to continue
The bear flag pattern is the bull flag flipped: a steep drop (the pole), a small upward drift (the flag), then a breakdown that continues the fall. You sell the close below the flag, stop just above it, and target the pole’s height projected down.
It works, but on one strict condition: there has to be a real downtrend to continue. That is the same regime rule as the bull flag, just inverted, take it only when price is below the 200-EMA.
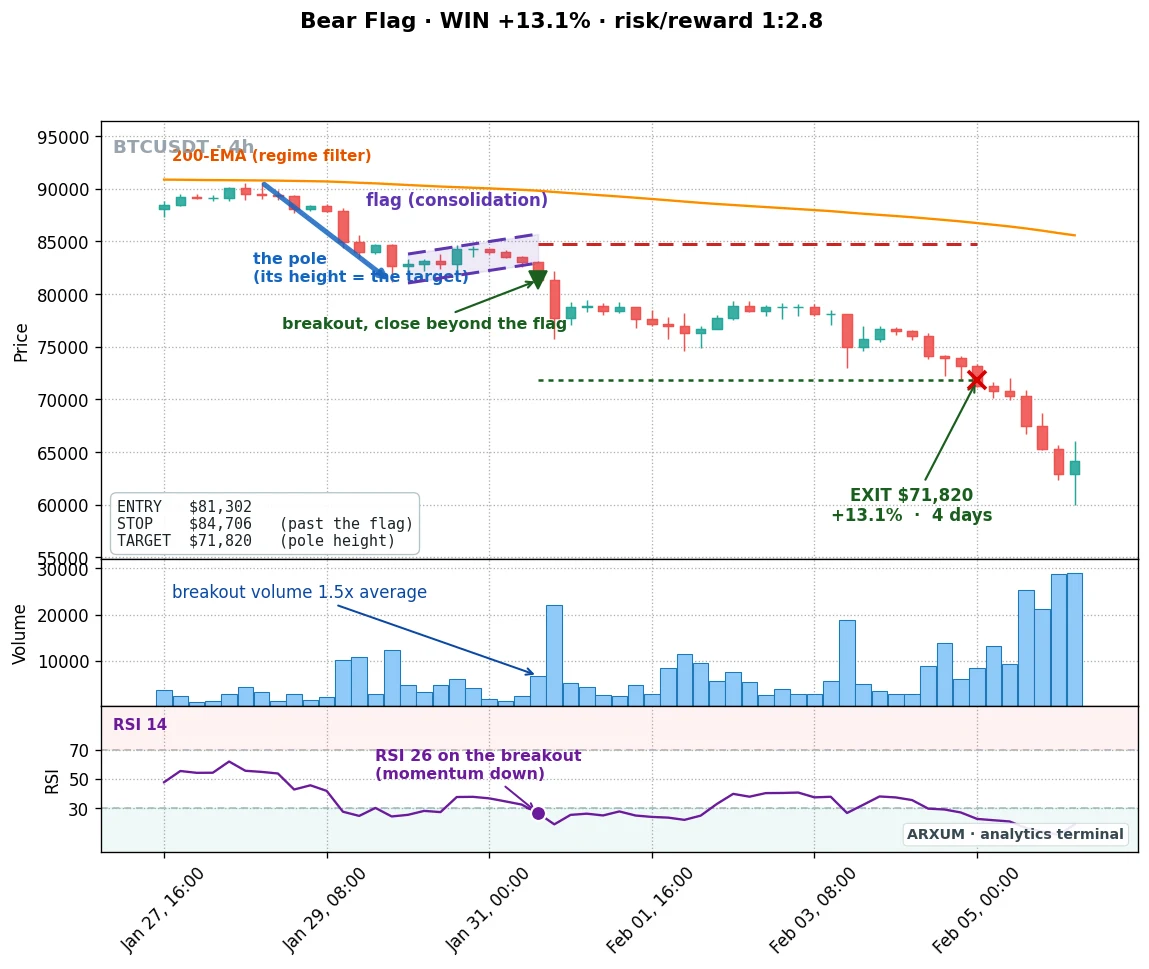
Where the bear flag had a real downtrend, it paid: a 1.33 profit factor on Bitcoin’s 4-hour corrections, which actually firmed up in the recent data, and a 1.76 on a weak pound.
Where it did not, it bled. On gold, which trended up for eight years, the bear flag lost: any short edge it showed early vanished out of sample, because you were fighting the dominant trend the whole time. So the rule is simple. A bear flag needs a falling market underneath it. Into a rising one, leave it alone.
What does not work
The losers are as instructive as the winners. The clearest one is the flip side of the Bitcoin volume story: a breakout with no real volume behind it.
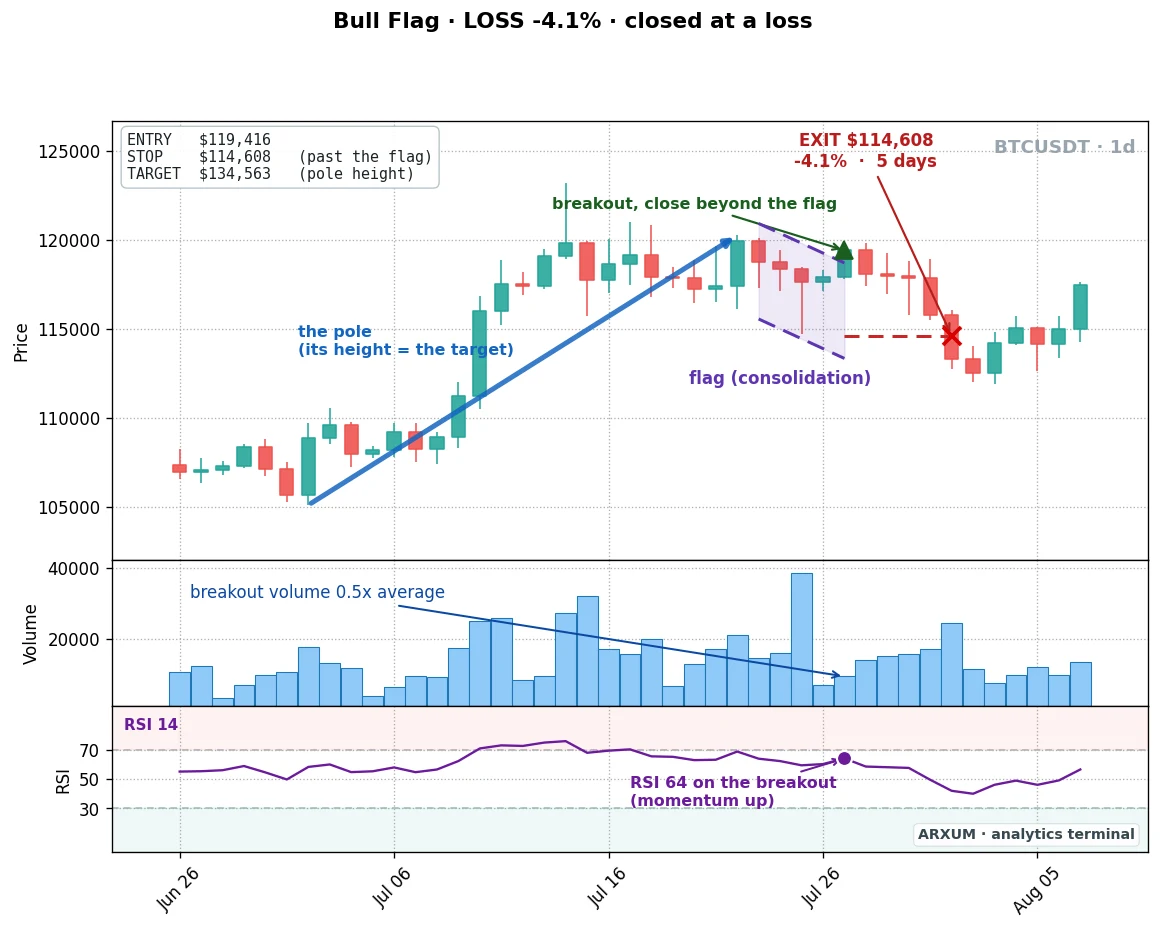
That chart is the whole lesson in one image. On Bitcoin, where volume is real, skipping the volume check costs you. The rest of the avoidable mistakes:
- Trading the bear flag into an uptrend. Shorting flags on gold, which trended up for eight years, lost steadily. A bear flag needs a real downtrend to continue. It paid on Bitcoin’s 4-hour corrections and on a weak pound, and bled everywhere else.
- Trading it below the regime. A bull flag below the 200-EMA is not continuing an uptrend, because there is no uptrend. The trend filter exists to stop you.
- A deep flag. If the consolidation gives back more than half the pole, the move has lost its momentum. Skip it.
- The wrong timeframe. On the 1-hour the gold flag lost outright. No filter rescues a pattern on a chart that is mostly noise.
How to trade it, step by step
- Pick the market and know its volume. Gold and Forex show tick volume, a guess, so trade those flags on trend and structure alone. Bitcoin and crypto show real volume, so use it.
- Pick the timeframe. The daily is where the flag pays. On crypto the 4-hour still works with the volume filter, but on gold and Forex it loses, so stick to the daily there. Skip the 1-hour everywhere.
- Find the trend. Confirm price is above the 200-EMA for a bull flag. A flag is a continuation, so the trend has to be there first.
- Spot the pole and wait for the flag. A steep impulse, then a tight channel that drifts against it and holds most of the pole. The flag is the patience step.
- Trade the break. Enter on the close beyond the flag. On crypto, require a volume surge; on gold and Forex, do not. Stop just past the flag, target the pole’s height from the breakout. You can take partial profit at the 1:1 mark and trail the rest, but never widen the stop.
Any charting platform does this. On the free tier of TradingView, adding the 200-EMA and the volume indicator to your chart takes two clicks each, and that is everything the method needs.
Decision tree
- Gold or Forex, daily, price above the 200-EMA? Take the bull flag on trend and the measured move. Ignore the volume reading.
- Bitcoin or crypto, with a real volume surge on the break? Take it. The volume filter is a true edge here.
- A breakout on thin or below-average volume, on crypto? Pass. The quiet break is the one that fails.
- A bear flag with no real downtrend behind it? Skip it. Do not short flags into an uptrend.
- Three to six losses in a row? Stop. The trend has likely stalled. Re-check before the next trade.
Bottom line: trade the flag, but trust the right confirmation
The bull flag is the most democratic of the patterns. It prints in every market and pays on the daily across all of them, gold, the euro, the pound, and Bitcoin. Finding one is not the hard part.
The skill is knowing which confirmation to trust, and that comes down to what your volume is made of. Here is the whole map from the testing:
- Gold, daily: the cleanest edge. 2.68 profit factor, and it held up out of sample. Trade it on trend, skip the volume filter.
- Bitcoin, daily: pays raw at 1.73, and the volume filter lifts it to 5.31. Real volume, real edge, but a deep drawdown.
- Forex (the euro, the pound), daily: profitable, same as gold, on trend without the volume crutch.
- Timeframe: the daily is where the flag lives. On crypto the 4-hour also works with volume; on gold and Forex it loses, and the 1-hour loses everywhere.
- The bear flag: real, but only with a genuine downtrend to continue. Never short flags into a rising market.
The whole method fits on a matchbox:
- Trade the bull flag on the daily, with price above the 200-EMA.
- Enter on the close out of the flag, stop just past the flag, target the pole’s height.
- On crypto, demand a volume surge; on gold and Forex, ignore volume.
Most guides hand you one rule for every chart: wait for volume. The data says that rule is a gift on Bitcoin and a trap on gold. Trade the flag with the trend, target the pole, and ask one question before you trust a volume spike: is this volume real, or is it a guess? For the other big continuation pattern, see the cup and handle; for a reversal setup built the same honest way, the head and shoulders method.
FAQ
What is the bull flag pattern in trading?
Does the bull flag pattern actually work?
Do you need volume to confirm a bull flag breakout?
What is the difference between a bull flag and a bear flag?
How do you measure the target for a bull flag breakout?
What timeframe is best for the bull flag?
Where do you put the stop loss on a bull flag trade?
Why did my bull flag trade fail?
Is the bull flag good for beginners?
Real-time trade setups with entry, stop loss and take profit. Daily market analysis. No subscription, no complicated theory.
🌍 Our recommended brokers


Reader Reviews
Be the first to review this — tell other traders what actually helped, or where it fell short.
Leave a Review

Forex Analyst & Senior Trader
Former FX desk trader with 8 years in institutional forex. Works in multi-timeframe analysis and order flow, turning desk experience into systematic, testable rules across forex and metals.
