
Head and Shoulders Chart Pattern: The Method That Turns It Into a Tradeable Edge

For the wider map of reversal and continuation shapes, see the chart patterns guide. This piece takes one pattern all the way to a method you can copy.
What the pattern actually is
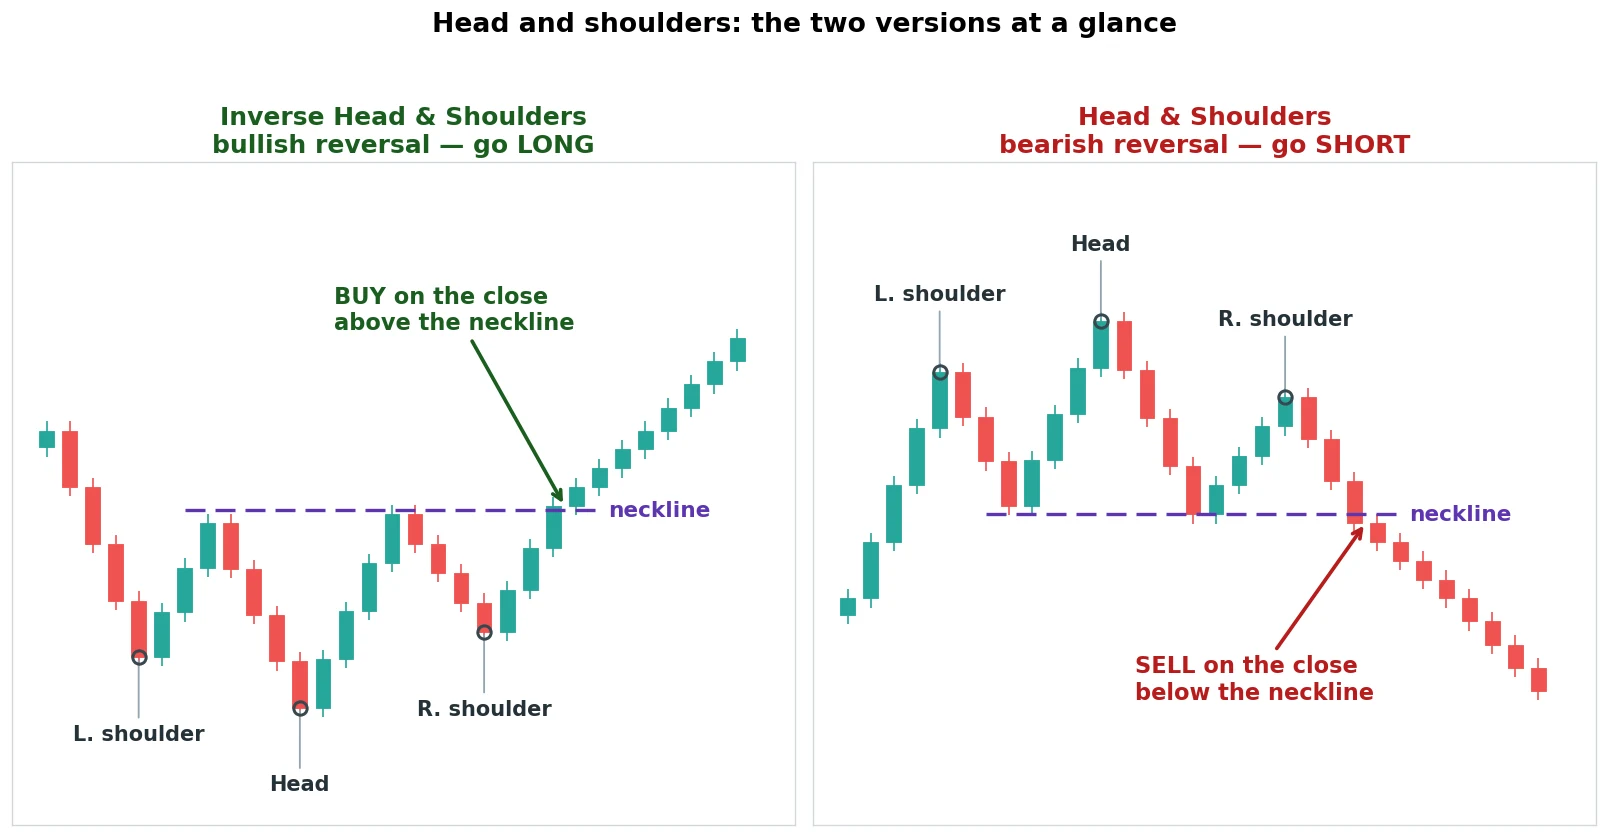
A head and shoulders is three pushes that fail:
- Left shoulder: price rallies, then pulls back.
- Head: it rallies again to a higher high, then pulls back.
- Right shoulder: it tries a third time, cannot get as far, and rolls over.
A line under the two pullback lows is the neckline, and a close below it is the trigger.
The inverse is the same shape flipped at a bottom, a low, a deeper low, a shallower low, with the neckline across the two bounce highs and a close above it as the signal.
Here are both versions the way a textbook draws them, the bullish inverse on the left and the bearish standard on the right, so the shape is clear before we look at a live one.
Now here it is in battle mode, the standard top that formed on Bitcoin in January 2025.
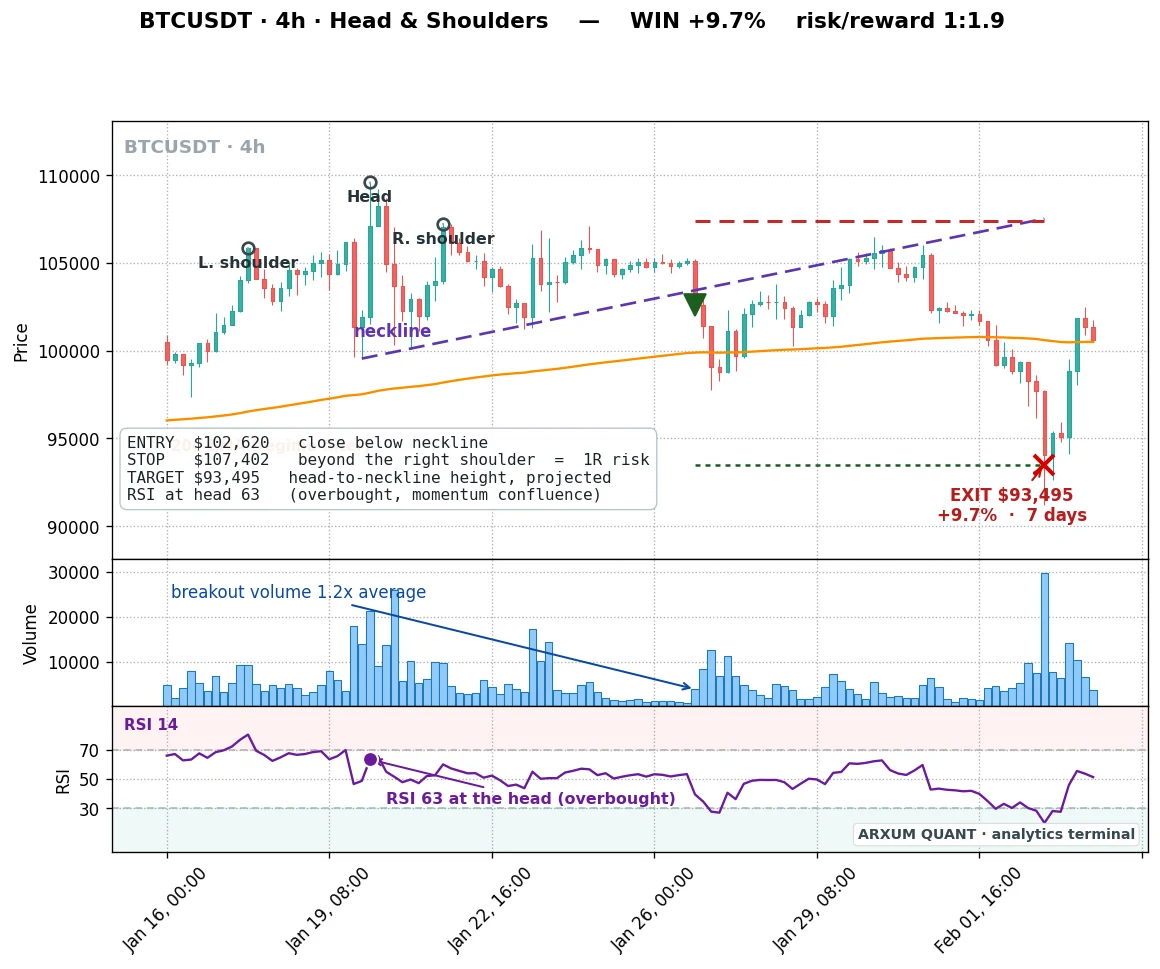
Five things define the trade, and they are all on that chart:
- The three peaks, head highest, shoulders lower and roughly level.
- The neckline, drawn under the two dips.
- The entry, on the candle that closes through the neckline.
- The stop, just beyond the right shoulder.
- The measured target, the head-to-neckline height projected the same distance past the break.
On that last point: the head on the Bitcoin trade sat about 9,500 above the neckline, so the target landed roughly 9,500 below the break.
That is the textbook. Now the question the textbook dodges: does trading it actually make money?
The honest problem: the raw pattern barely works
I built a detector that finds every clean head and shoulders, standard and inverse, then trades the neckline break by the book: enter on the close, stop beyond the right shoulder, target the measured move. Run that raw, with no other filter, across eight years of gold and EUR/USD and six years of Bitcoin, and the result is humbling.
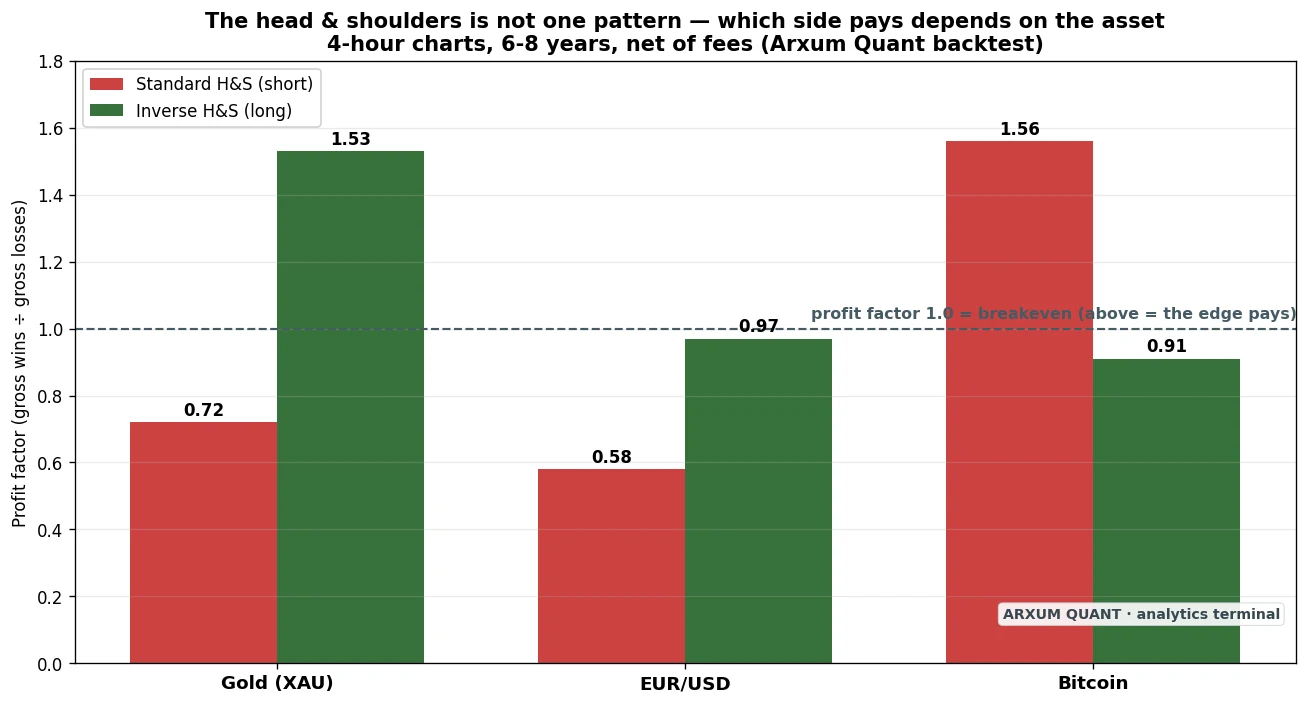
Profit factor here is just dollars won per dollar lost, so anything under 1.0 lost money. Only two of the six combinations cleared it: the bullish inverse on gold and the bearish standard on Bitcoin, both modestly. Everything else was a coin flip or a loser. The often-quoted “works 65 to 72 percent of the time” is a myth once you account for costs and pick a side.
So the pattern alone is not a strategy. It is a starting point. The edge is not in spotting the shape, it is in knowing which shapes to skip.
The method: the pattern plus three confirmations
This is the part that turns a famous picture into something tradeable. Take the pattern and demand three things before you act. Not ten indicators, three, and each one earns its place in the numbers.
1. The break has to come on real volume. A neckline break with no participation behind it is usually a liquidity grab that fades back into the range. I keep only breaks where volume on the break candle is at least one and a half times its recent average. This single filter does more work than any other. One caveat for Forex and gold: the volume your platform shows there is tick volume, a count of price updates rather than real contracts traded, so treat it as a proxy; on Bitcoin it is genuine exchange volume. For the wider toolkit on reading participation, see the best indicators for day trading.
2. The trade has to agree with the trend, read off the 200-EMA. The 200-period exponential moving average is a slow trend line every platform draws for you, and which side of it price sits on is what traders call the regime: above the line is an uptrend, below it a downtrend. The rule is simple: take the inverse (a buy) only when price is above the 200-EMA, and take the standard (a sell) only when price is below it. In plain terms, buy bottoms in an uptrend, and short tops in a market that is already rolling over. Never fade a strong trend with a pattern. If the moving average is new to you, start with the exponential moving average guide.
3. The head has to show a stretched RSI. The Relative Strength Index measures momentum from 0 to 100. On an inverse pattern I want the head, the lowest low, to print an oversold RSI near or below 40, a sign sellers are exhausted. On a standard top I want the head overbought, near or above 60. It is the momentum agreeing with the picture. The RSI indicator guide covers the readings, and RSI divergence is the next level of this same idea.
That is the whole method. A clean pattern, a volume-backed break, the right side of the 200-EMA, and a stretched RSI at the head. Here is what it does to the numbers.
| Setup and market | Raw pattern | The full method |
|---|---|---|
| Inverse on gold (buy bottoms) | 60% win, profit factor 1.5 | 78% win, profit factor 2.2 |
| Standard on Bitcoin (short tops) | 50% win, profit factor 1.6 | 71% win, profit factor 2.8 |
The win rate jumps, the profit factor jumps, and the drawdown shrinks. Same pattern, three filters, a different animal.
The method on gold: buying the bottoms
Gold spent these years in a strong uptrend, so the inverse pattern, a bottom, lines up with the grain of the market. Filtered by the method, it won 78 percent of its trades at a profit factor of 2.2, and the worst dip in the account was under 2 percent.
It was not a fluke of one lucky stretch either. Split the eight years in half and the edge held in both: a profit factor of 2.8 in the older half, 1.6 in the recent one. Here is a clean trade.
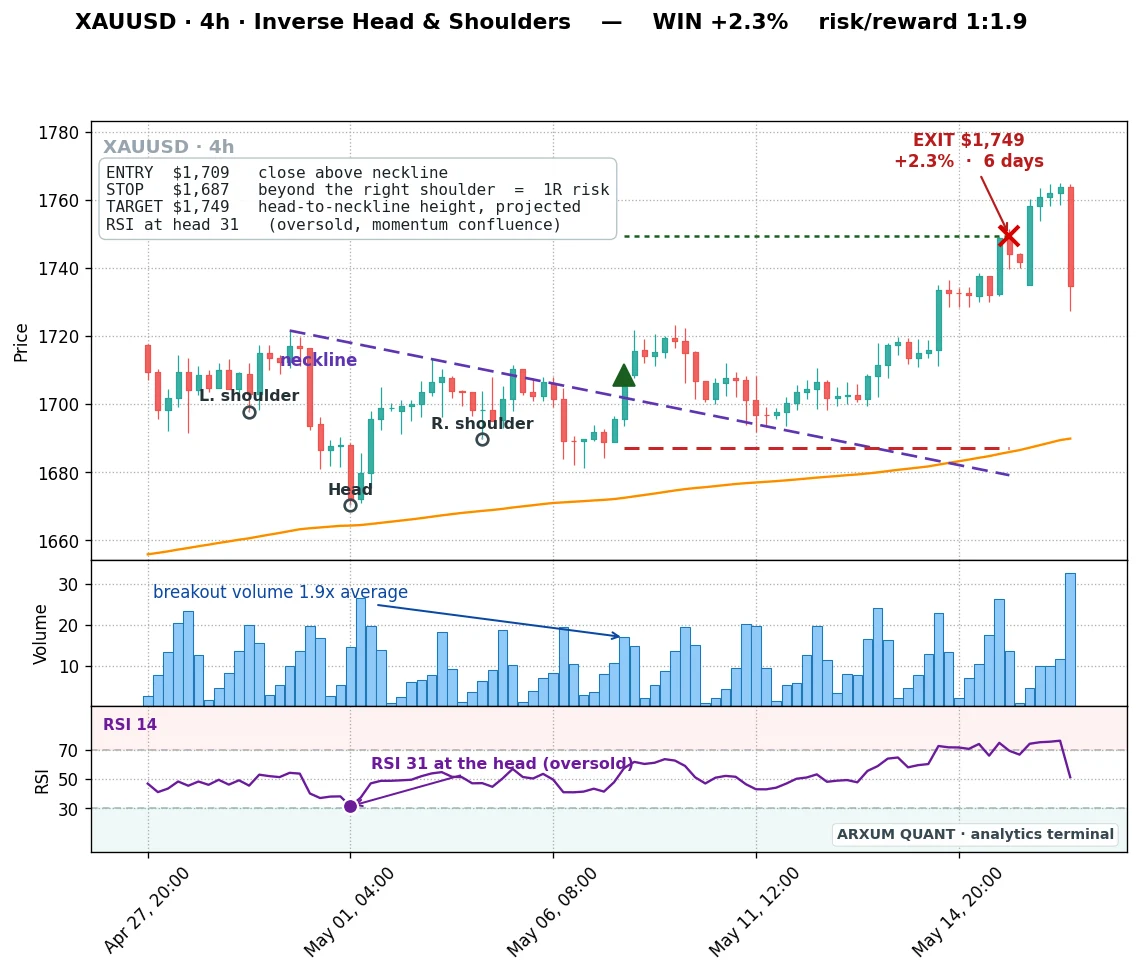
The chart shows every part of the method at once, not just the pattern:
- Trend: price is above the 200-EMA (the orange line), an uptrend, so the inverse buy is allowed.
- Volume: the break candle prints a clear surge.
- Momentum: the RSI panel reads 31 at the head, deep in oversold.
That is the difference between drawing a shape and trading a setup. The trade entered on the close above the neckline at $1,709 and reached its target near $1,749 in six days.
One honest detail about the reward. On the gold inverse the stop, below the right shoulder, usually sits further away than the target above, so the average winner is actually a bit smaller than the average loss, around 1:0.6, meaning you keep about 60 cents for every dollar you put at risk. That sounds bad until you see the win rate. The method wins 78 percent of the time, so a lot of small wins easily outweigh the occasional bigger loss. The edge here is the hit rate, not fat winners.
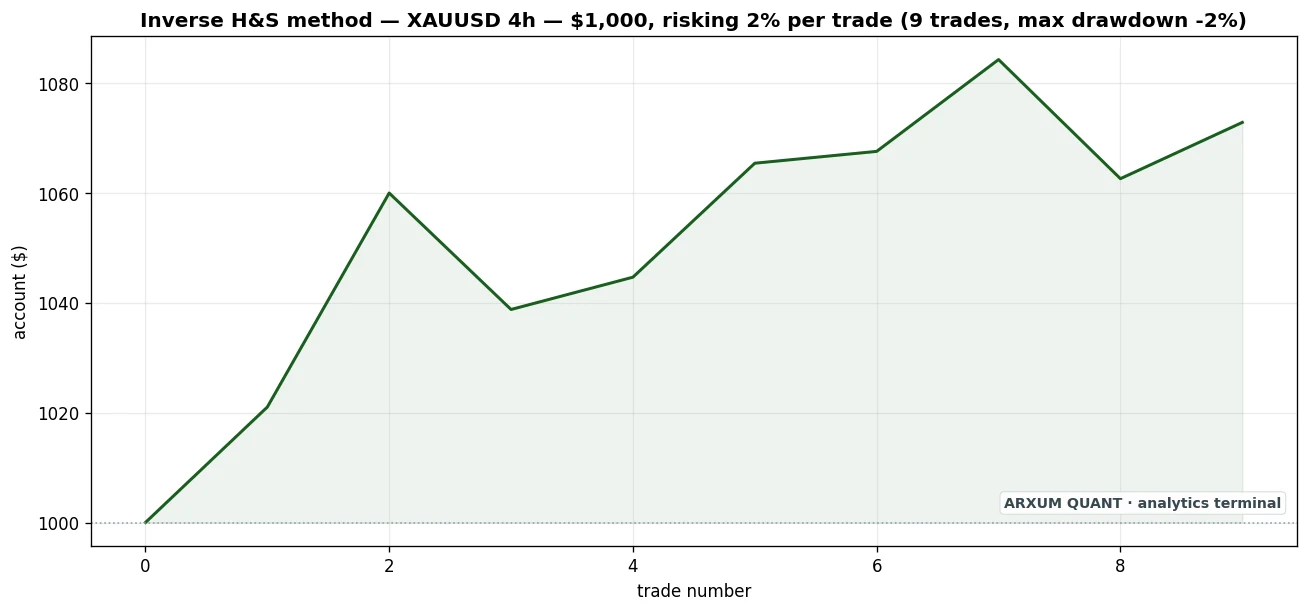
| Trades | 9 |
| Win rate | 78% |
| Reward-to-risk | 1:0.6 |
| Profit factor | 2.16 |
| Net on $1,000 (2% risk) | +7% → $1,073 |
The dollar gain looks small for one plain reason: this is a selective method, only nine trades in eight years on gold, about one a year. That is the price of a 78 percent win rate, it does not fire often. The win rate and the 2.16 profit factor are the real result. And the slope of that curve is simply the risk you choose: risk more per trade and it steepens, risk less and it flattens.
The method on Bitcoin: shorting the tops
Bitcoin is the opposite character. It tops violently and follows through hard, so the standard pattern, a top, is where the edge lives here, especially when price has already lost the 200-EMA. The method won 71 percent at a profit factor of 2.8. Here is the April 2024 top.
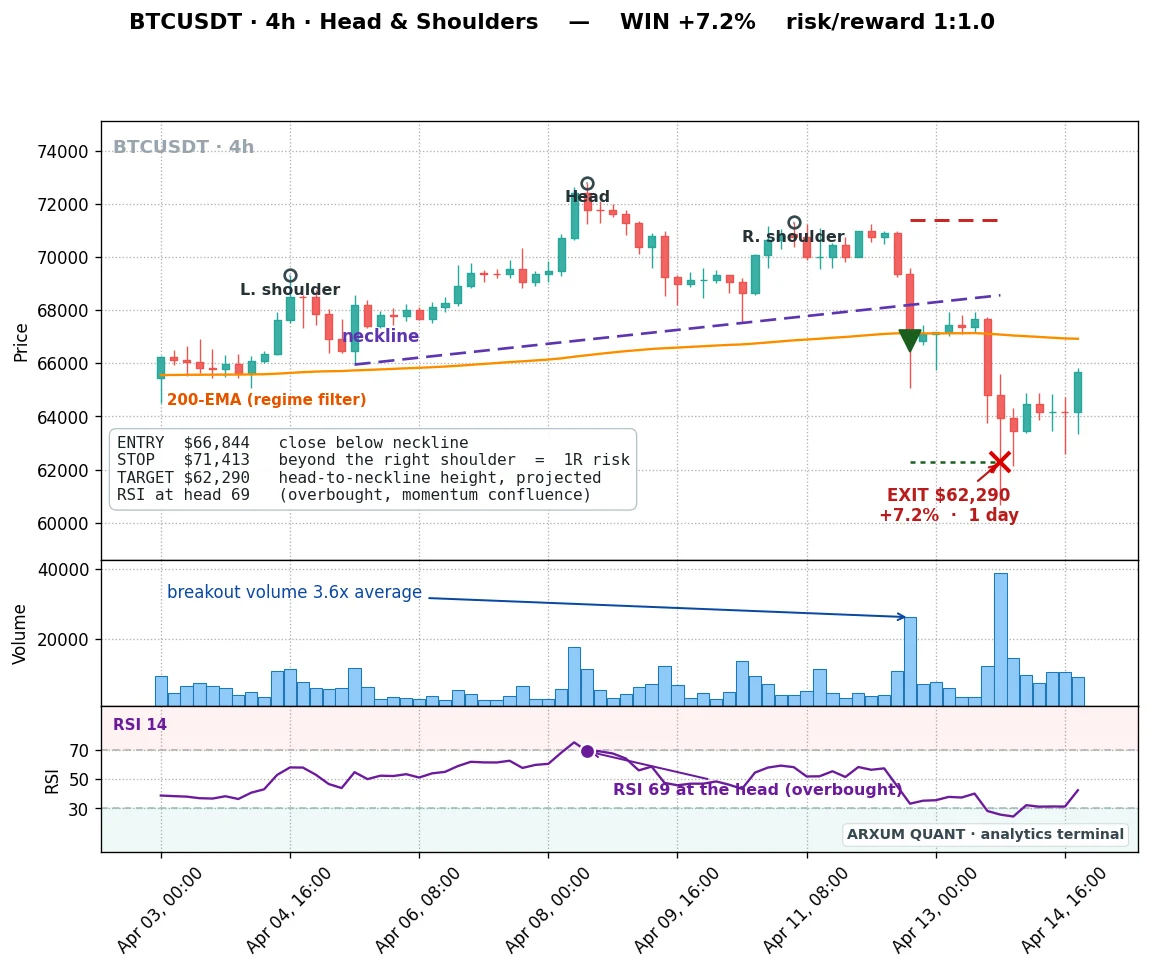
Same three confirmations, opposite direction. Every box ticked:
- Trend: price was already below the 200-EMA, a downtrend.
- Momentum: the head printed an overbought RSI near 69.
- Volume: the neckline broke on more than three times average volume.
The short entered on the close below the neckline at $66,844 and hit its target near $62,290 in a day, +7.2 percent.
Bitcoin’s reward profile is healthier than gold’s here: the winners run a little bigger than the losers, so it does not lean on the win rate quite as hard.
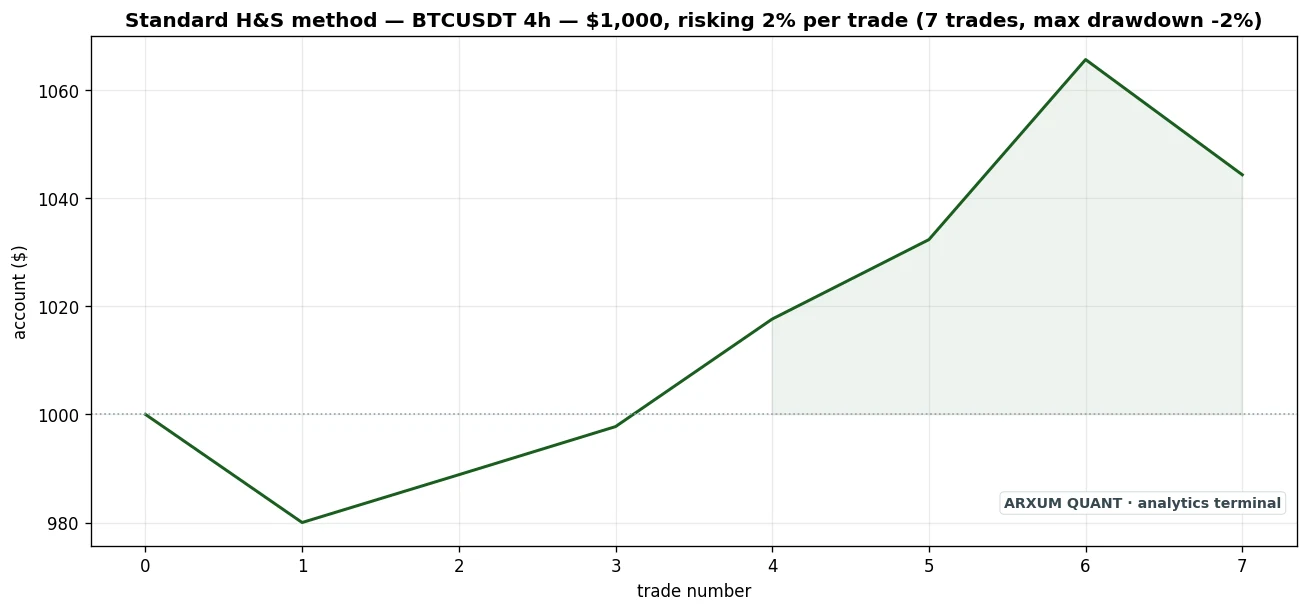
| Trades | 7 |
| Win rate | 71% |
| Reward-to-risk | 1:1.1 |
| Profit factor | 2.77 |
| Net on $1,000 (2% risk) | +4% → $1,044 |
Reading these tables: win rate is the share of trades that won; reward-to-risk compares the average winner to the average loss (1:0.6 means the winner is smaller, 1:1.1 means it is bigger); profit factor is dollars won per dollar lost, above 1.0 is profitable. The two methods get to a similar profit factor by opposite routes: gold wins small and often, Bitcoin wins bigger and a little less often.
Profit factor and reward-to-risk are not the same number
These get blurred, so plainly:
- Reward-to-risk (written 1:X) is what a single trade made compared to what it risked.
- Profit factor is the whole method’s total winnings divided by its total losses, above 1 means it made money overall.
They can disagree completely. The gold method has a below-even reward of 1:0.6, its winners are smaller than its losers, yet it still posts a strong 2.16 profit factor because it wins 78 percent of the time. The Bitcoin method wins less often but its winners are bigger.
You need both numbers to judge a setup, and knowing which kind you hold tells you whether a losing streak is normal or a warning. For the full breakdown of sizing a trade off its risk, the risk/reward ratio guide walks it slowly.
The timeframe decides it
People assume more signals is better. It is the opposite. Drop this method to the 1-hour chart and it falls apart.
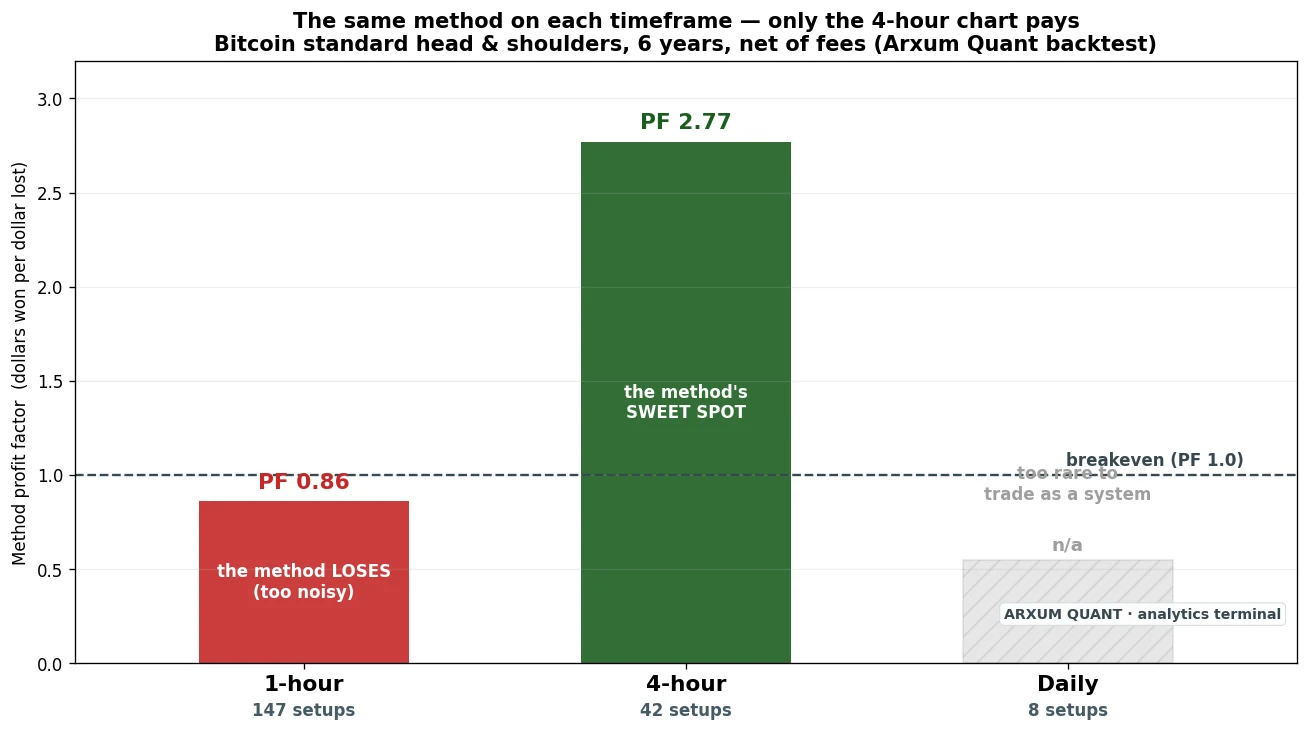
The 4-hour chart is the home for this. The 1-hour is noise dressed up as opportunity, lots of half-formed patterns and costs that eat the edge. The daily produces beautiful, rare textbook patterns, but too few to run as a system. If you take one mechanical rule from this article, make it this: trade the head and shoulders on the 4-hour or higher.
Risk, and the rule that protects you
The method only works if your losses are uniform, and that comes from sizing off the stop. Say you short the Bitcoin pattern. Size it off the stop in three steps:
- Risk per coin: entry at $66,844, stop above the right shoulder at $71,400, so about $4,556 at risk on each coin.
- Risk per trade: on a $2,000 account you decide to risk 1 percent, which is $20.
- Position size: $20 divided by $4,556 is a tiny fraction of a coin, sized so that if the stop is hit you lose exactly that $20, no more.
Do that on every trade and your losses are all the same controlled size.
Now the rule that keeps a good method from turning into a bad month.
A 70-plus percent win rate means a long losing streak should almost never happen. Three losses in a row at those odds is roughly a 1-in-50 event, about a 2 percent chance. So if you take three to six losing trades in a row, that is not bad luck. It is the market telling you the regime has changed.
So you stop. Stand down for a week, re-check whether price is still on the right side of the 200-EMA, and only come back when the conditions the method needs are back. The discipline to pause is part of the edge, not separate from it.
What doesn’t work
The losers teach as much as the winners.
The standard short on EUR/USD. A range-bound major chops top breakdowns to pieces. Here is a textbook pattern that broke down and got run straight over.
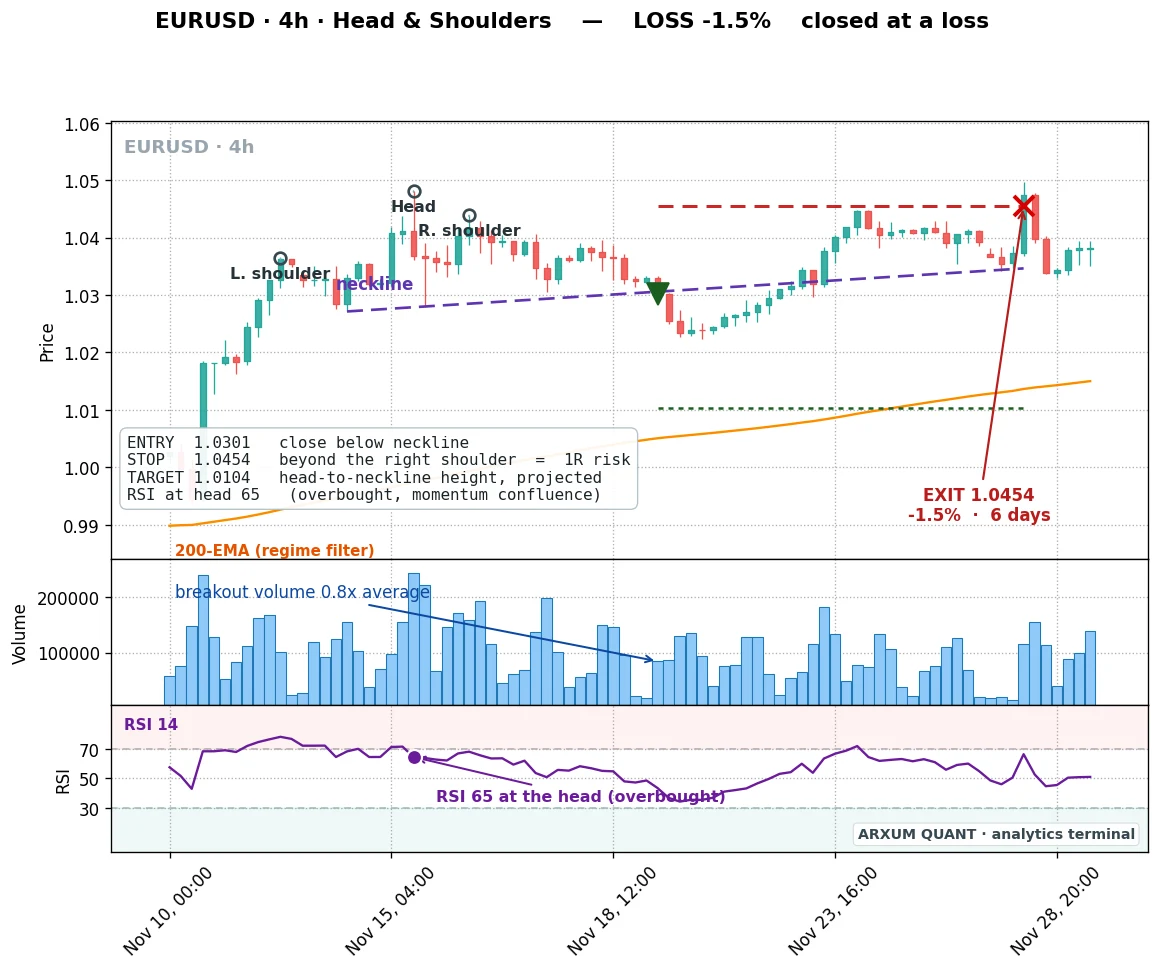
That single chart is the case for the method. The pattern was perfect, but the break came on thin volume and fought a market that was turning up, so price reversed off 1.0301, took the stop at 1.0454, and climbed into the recovery rally. The shape was right and the context was wrong, and the volume and regime filters would both have kept you out.
The inverse on Bitcoin and the standard on gold. Wrong tool for the market. Bitcoin bottoms in sharp V shapes, not rounded inverse shoulders. Gold’s standard tops fade against its uptrend. The method cannot rescue a setup the market does not give.
Any break with no volume, or against the trend. The two most common ways to get stopped. If the break is limp, or it fights the 200-EMA, it is not your trade.
How to trade it, start to finish
- Find a clean pattern on the 4-hour chart. Head highest (or lowest, for the inverse), shoulders roughly level, a definable neckline.
- Check the regime. Buying an inverse? Price must be above the 200-EMA. Shorting a standard? Price must be below it.
- Check the head’s RSI. Oversold near 40 for an inverse, overbought near 60 for a standard.
- Wait for the body close through the neckline on above-average volume. No volume, no trade. A wick that closes back cancels it.
- Place the stop beyond the right shoulder, the target at the measured move, and size off the stop so the loss is a fixed small slice of the account. Then manage by the three-to-six-losses rule.
You need a charting platform that shows the 200-EMA, RSI and volume, which is every serious one, and TradingView’s free tier is the usual place beginners start. You also want a broker with clean execution. If gold is your market, the how to trade gold guide covers the instrument itself.
Your decision in four lines
- Uptrend market like gold, inverse pattern at a bottom, oversold head, volume on the break? Buy the neckline break. This is the highest-win-rate version.
- A market rolling over like Bitcoin, standard pattern at a top, overbought head, volume on the break? Short the neckline break.
- Range-bound pair like EUR/USD? Demand the volume surge or pass. Treat the pattern as one vote, not the whole case.
- Three to six losers in a row? Stop for a week and re-check the regime.
For the bullish bottom on its own, the inverse head and shoulders guide goes deeper, and the double top and double bottom is the two-peak cousin that responds to the same three filters.
The bottom line
The head and shoulders is real, but the single win rate everyone quotes is a fiction. Raw, it is a coin flip. The value is in the method: a clean pattern, a volume-backed break, the right side of the 200-EMA, and a stretched RSI at the head. Demand all four and the same pattern that loses on its own won roughly seven in ten trades on gold and Bitcoin across years of data. Match the side to the market, take only the confirmed setups, size off the stop, and stand down when the streak says the regime turned. That is how a famous picture becomes an edge.
FAQ
What is the head and shoulders chart pattern?
Does the head and shoulders pattern actually work on its own?
What is the head and shoulders method in this guide?
Which indicators do you combine with the head and shoulders?
How do I calculate the head and shoulders target?
Where do I put the stop loss?
What is the best timeframe for the head and shoulders?
What should I do after a string of losing trades?
Does this work on stocks and other markets, not just gold, Bitcoin and EUR/USD?
What is a failed head and shoulders, and what does it mean?
Real-time trade setups with entry, stop loss and take profit. Daily market analysis. No subscription, no complicated theory.
🌍 Our recommended brokers


Reader Reviews
Be the first to review this — tell other traders what actually helped, or where it fell short.
Leave a Review

Forex Analyst & Senior Trader
Former FX desk trader with 8 years in institutional forex. Works in multi-timeframe analysis and order flow, turning desk experience into systematic, testable rules across forex and metals.
