
What crypto futures trading actually is
A crypto future is a contract, not a coin. You agree to a price now and settle the difference later, which lets you go long or short and add leverage without ever holding the asset.
The one relationship that makes the whole market tick is the futures price versus the spot price, so look at that first.
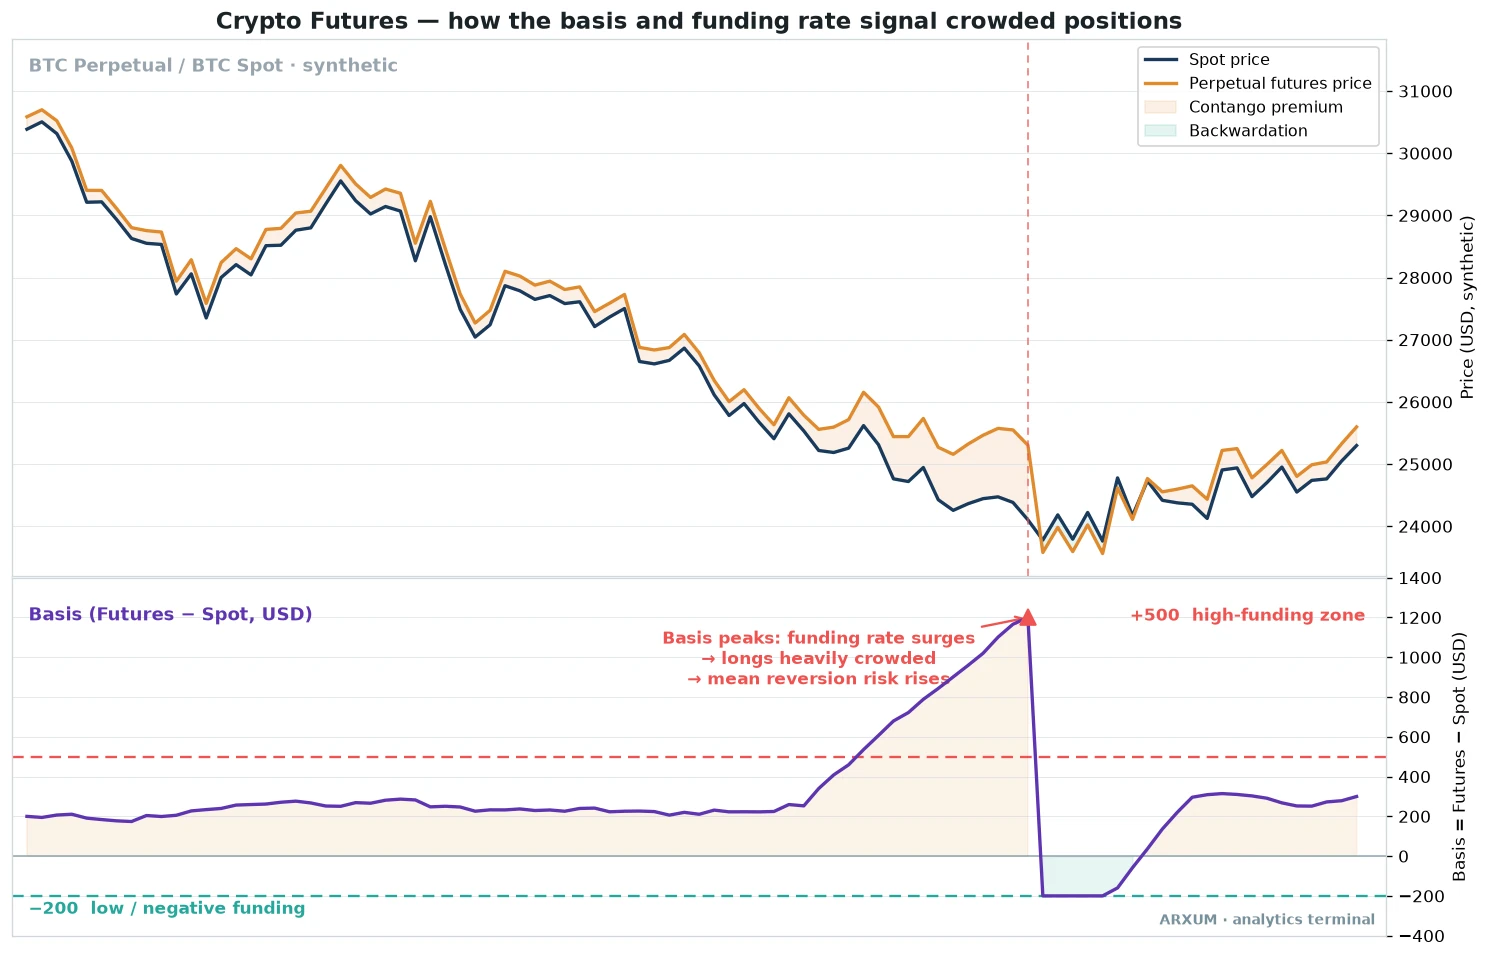
Read the picture from the bottom panel up. The basis is simply the futures price minus the spot price, and it is the market’s crowding gauge.
- Perpetual futures are the contract almost everyone trades. No expiry, held as long as you like, kept near spot by funding.
- Basis is futures minus spot. Positive means futures trade above spot (contango, the orange shading), negative means below (backwardation, the teal shading).
- The funding rate is the periodic payment that closes that gap. When the basis is high and positive, longs pay shorts, which quietly bleeds a crowded long trade.
- A high, positive basis (the top of the lower panel) says buyers are stacked on one side. That is where sharp pullbacks tend to start.
- A negative basis says shorts are crowded and panic may be near a floor.
The one-line read: price tells you where the market is, the basis and funding tell you how crowded it got to get there.
Crypto futures explained: the building blocks
Before any strategy, get these five words straight. Each one is a lever you will actually pull.
| Term | Plain meaning | Why it matters |
|---|---|---|
| Perpetual future | A contract with no expiry, pinned to spot by funding | The default product on every crypto exchange |
| Quarterly future | A contract that settles on a fixed date, no funding | Cleaner for holding a directional view for weeks |
| Funding rate | A small recurring payment between longs and shorts | Positive funding taxes crowded longs over time |
| Basis | Futures price minus spot price | The market's crowding and sentiment gauge |
| Leverage | Borrowed size on top of your margin | Multiplies both the gain and the loss |
| Liquidation | Forced close when your margin runs out | The real risk that spot trading does not have |
Two of those, perpetual and quarterly, are just the two contract types. Most beginners only ever touch perpetuals, so this guide stays there.
The other four, funding, basis, leverage and liquidation, are the mechanics that make futures behave differently from spot. They are covered one by one below.
Crypto futures vs spot: what actually changes
Spot means you own the coin. Futures means you own a bet on its price.
That single difference cascades into everything else.
| Feature | Spot trading | Crypto futures |
|---|---|---|
| What you hold | The actual coin | A contract tracking the price |
| Direction | Long only, in practice | Long or short with equal ease |
| Leverage | None, one to one | Optional, often up to high multiples |
| Ongoing cost | None once bought | Funding paid or received periodically |
| Worst case | The coin falls in value | Liquidation wipes the margin |
| Best use | Holding, stacking, long horizon | Active trading, hedging, shorting |
The takeaways from that table, in plain words:
- Futures let you short. In a downtrend you can profit from the fall, which spot buyers cannot.
- Futures cost you rent. Hold a crowded long and positive funding chips away at it every few hours.
- Futures can go to zero fast. Leverage plus a sharp move against you equals liquidation, a risk spot never carries.
- Spot is calmer. If you just want exposure to Bitcoin and can sit through drawdowns, spot is the simpler tool.
How leverage and liquidation really work
Leverage is the feature beginners reach for first and understand last. It is worth slowing down here.
Leverage means your deposit, the margin, controls a bigger position. At 10x, a deposit of one part controls ten parts of exposure.
- The move is multiplied. At 10x, a 1% move in your favour is roughly a 10% gain on your margin. A 1% move against you is roughly a 10% loss.
- Liquidation is the floor. Once losses eat through your margin, the exchange force-closes the trade. You do not choose the moment.
- The rough math: at 10x, a move of about 10% against you is enough to liquidate. At 20x, only about 5%. Higher leverage means a closer liquidation price.
- Crypto moves fast. A 5% candle on Bitcoin is an ordinary day, so high leverage puts liquidation within one normal move.
The rule of thumb most survivors settle on: low leverage, wide stop. Two to five times is plenty for a beginner, and it keeps the liquidation price far from normal noise.
Leverage does not add edge. It only scales whatever your setup already does, wins and losses alike.
Size the trade off your risk, not off the maximum the exchange offers. The position sizing guide shows how to work that out from the account down.
Three reads that guide a futures position
Futures give you two extra dials that spot does not: funding and basis. Layer a couple of familiar indicators on top and you have a simple decision kit.
None of these is a full system on its own. Together they answer three questions: is the crowd leaning too far, is momentum stretched, and which way is the trend pointing.
Read one: funding and basis, the crowding gauge
This is the read unique to futures, and it is the one worth learning first. It uses the anatomy chart at the top of this guide.
How it looks:
- High, positive funding means longs are paying shorts and buyers are stacked. Crowded longs are fuel for a sharp flush.
- Negative funding means shorts are paying longs. Crowded shorts can mark a capitulation low.
- A basis stretching into the high zone, as the lower panel shows, is a caution flag on chasing the move.
- Funding near zero means neither side is crowded, so the signal is quiet and price leads.
Application table: funding and basis
| Role | How you use it | Best read |
|---|---|---|
| Sentiment filter | Fade nothing, but avoid chasing longs into high funding | BTC and ETH, any timeframe |
| Crowding warning | Tighten stops when funding is extreme and one-sided | D1 for the swing view |
| Contrarian tilt | Watch for reversals when funding pins at an extreme | H4 and D1 on BTC |
| Cost check | Skip holding a long that pays heavy funding for days | Perpetuals only |
I check funding before I even look at an entry. A perfect chart setup into extreme positive funding is a trade I size smaller, because the crowd is already there.
Read two: RSI on the daily as a funding-momentum proxy
You do not always have a clean funding feed in front of you. The RSI on the daily chart is a decent stand-in for how stretched momentum has become.
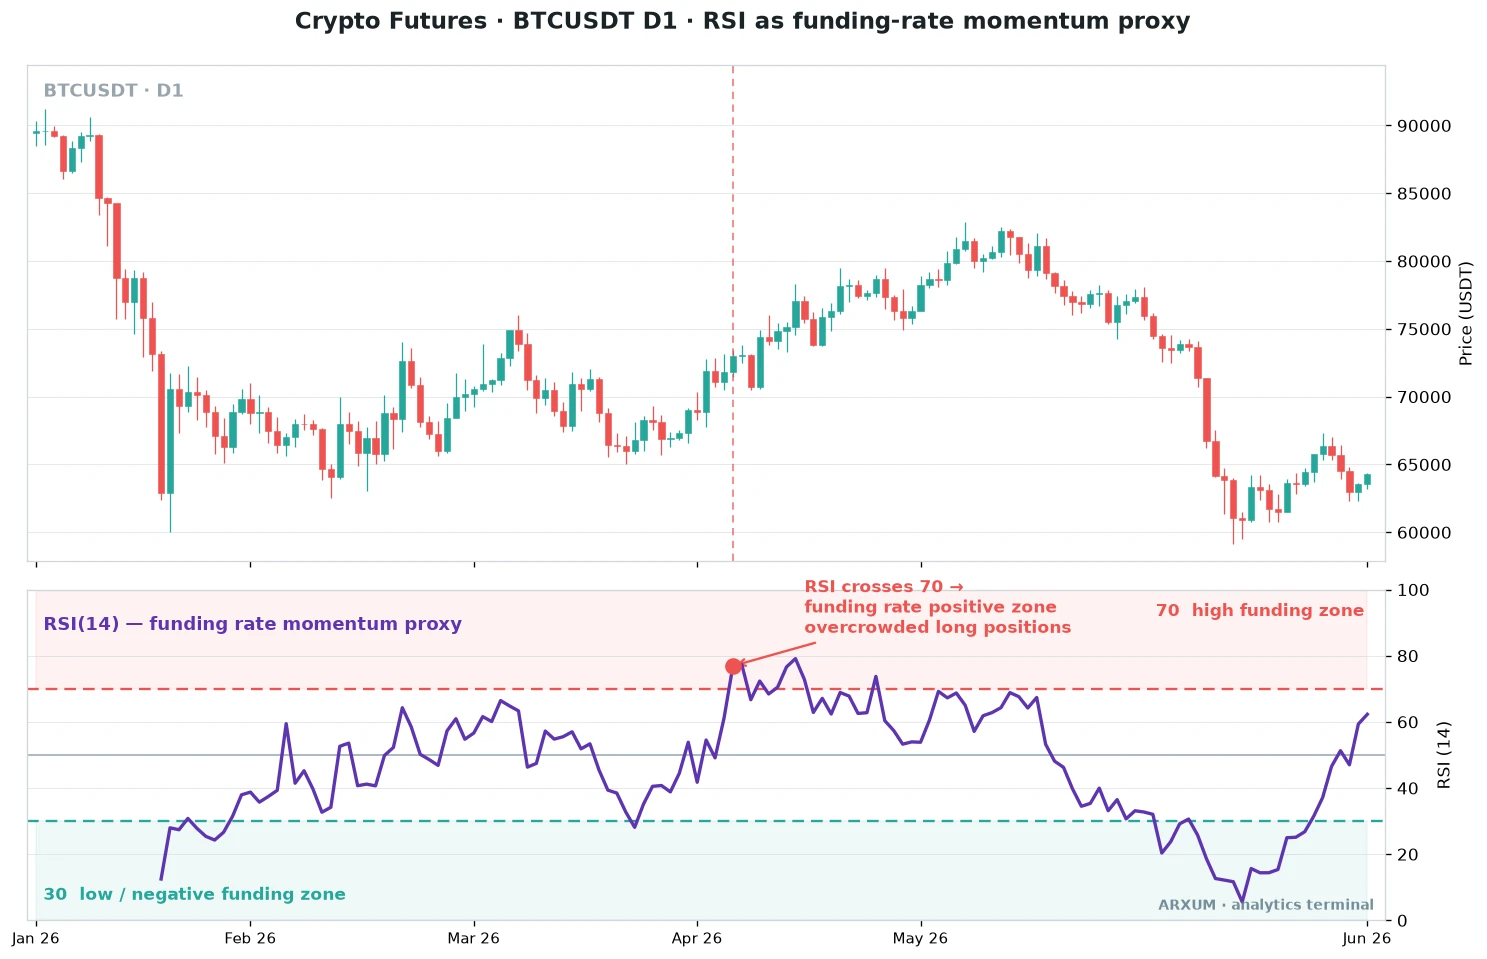
RSI, the relative strength index, measures how fast and far price has moved on a 0 to 100 scale. Above 70 is hot, below 30 is cold.
How it looks:
- RSI above 70 on the daily lines up with crowded longs and rich funding. Momentum is stretched, so chase carefully.
- RSI below 30 lines up with panic and often negative funding, where shorts are crowded.
- RSI drifting back toward 50 means the stretch is unwinding and neither side is crowded.
- A push above 70 that holds is a strong trend, not an instant short. Overbought can stay overbought in a bull run.
Application table: RSI on futures
| Role | How you use it | Best read |
|---|---|---|
| Stretch check | Read above 70 as crowded longs, below 30 as crowded shorts | D1 on BTC and ETH |
| Entry filter | Prefer longs from the 40 to 55 zone, not from 75 | D1 and H4 |
| Exit cue | Trim a long as RSI stalls in the 70s and rolls over | D1 swing trades |
| Confirmation | Pair with funding, agreement strengthens the read | BTC, the deepest market |
RSI is not a trigger by itself. It is a second opinion that tells you whether the move you want to trade is fresh or already exhausted.
Read three: MACD on the four-hour for trend direction
For the actual direction of a futures position, I lean on the MACD on the four-hour. It answers one question well: who has control right now.
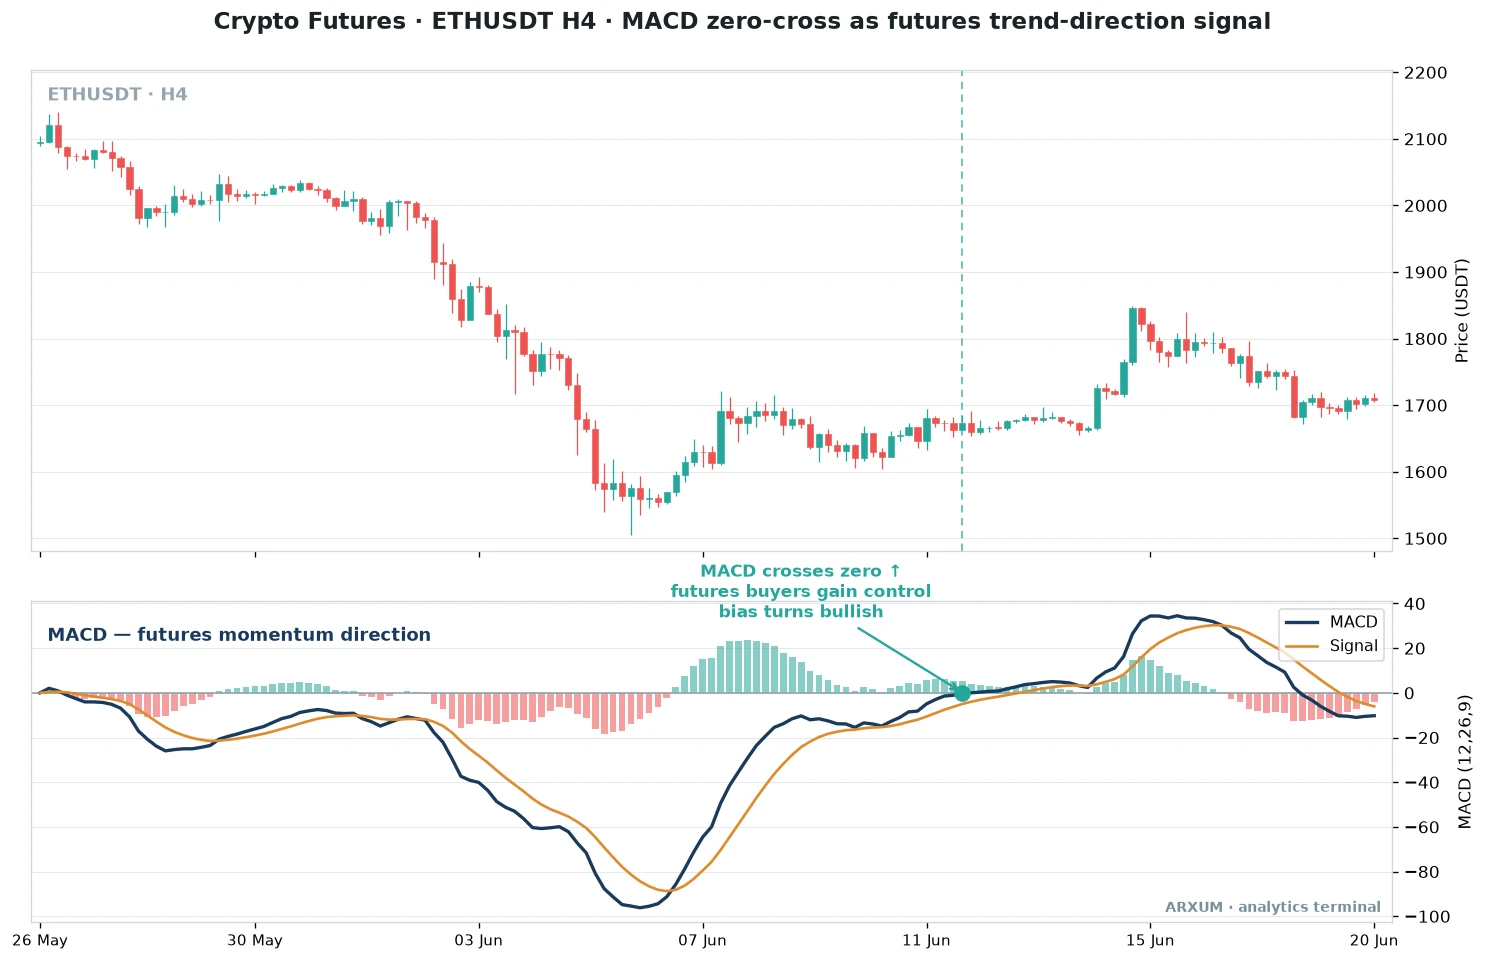
MACD stacks two moving averages and plots the gap between them as a line, with a signal line and a histogram. The level that matters most here is zero.
How it looks:
- MACD above zero means the faster average is above the slower one. Buyers hold the trend, favour longs.
- MACD below zero means sellers hold control, favour shorts. On futures you can actually take that short.
- The zero-cross, marked on the chart, is the moment control changes hands. It is cleaner than chasing every small signal-line wiggle.
- A histogram shrinking toward zero warns the current move is losing steam before price turns.
Application table: MACD on futures
| Role | How you use it | Best read |
|---|---|---|
| Direction call | Long while MACD is above zero, short while below | H4 on ETH and BTC |
| Entry trigger | Act on the zero-cross in the trend direction | H4 for swing entries |
| Trend filter | Take RSI and funding reads only in MACD's direction | H4 paired with the D1 view |
| Warning | A fading histogram flags an early exit | Any liquid perpetual |
The four-hour is a sweet spot for crypto. The 15-minute is mostly noise for this, and the daily turns slowly, so the four-hour catches swings without drowning you in false crosses.
Which read to use when
The three reads are not rivals. They stack.
Direction first, then stretch, then crowding, is the order I run them in.
| Read | What it answers | Strength | Weakness |
|---|---|---|---|
| Funding and basis | Is the crowd leaning too far | Unique to futures, catches extremes | Quiet when funding is flat |
| RSI on D1 | Is momentum stretched | Simple, universal, free | Overbought can persist in trends |
| MACD on H4 | Which way is the trend | Clear direction and trigger | Lags at sharp turns |
A few plain rules of thumb from that table:
- Direction beats everything. If MACD on the four-hour is below zero, do not go hunting long entries because RSI dipped.
- Stretch tells you size. Into a hot RSI and high funding, take a smaller position or none.
- Crowding is the tiebreaker. When price and momentum agree but funding is extreme, respect that the move may be late.
- Crypto never sleeps. There are no sessions to shade like Forex, so these reads run around the clock, weekends included.
Managing risk on leveraged futures
Leverage is why futures reward discipline and punish its absence. The risk plan matters more here than on spot.
- Risk a fixed slice per trade. Around 2% of the account is a common ceiling. Size the position so a stop-out costs that, no more.
- Set the stop first, then the size. Decide where the idea is wrong, measure the distance, then work out the position from your risk budget.
- Keep leverage low. Two to five times keeps the liquidation price far from normal candles, so a stop closes you, not a forced liquidation.
- Expect losing streaks. Even a good read loses often. If several trades in a row stop out, step back and check the regime before adding size.
- Only risk money you can lose. Leverage can zero an account in a bad move, so trade a balance whose loss would not hurt your life.
The reward-to-risk math is the same as anywhere. Aim for setups where the target is a multiple of the risk, and the risk-reward ratio guide walks the 1:X framing in plain terms.
How to trade crypto futures, step by step
You do not need anything exotic. The reads above live on free charting, and the trade lives on any major exchange. That said, funding rates and liquidation engines are not the same everywhere, and on a leveraged position both decide how long you survive a bad candle: an exchange tested on a live account is the honest comparison.
| Step | What to do | Tool |
|---|---|---|
| 1. Chart it | Open BTC or ETH on TradingView, add RSI and MACD | Free TradingView account |
| 2. Check direction | Note if MACD on H4 is above or below zero | MACD, default 12, 26, 9 |
| 3. Check stretch | Read RSI on D1 for overbought or oversold | RSI, default length 14 |
| 4. Check crowding | Glance at the exchange funding rate | The exchange futures page |
| 5. Size and place | Set the stop, size for 2% risk, use low leverage | The exchange order ticket |
Two honest notes on setup:
- On TradingView, add the built-in “Relative Strength Index” and “MACD” by name from the indicators search. Both use the standard settings above, so your chart matches the ones here.
- The funding rate is shown on the exchange itself, on the perpetual contract’s page, usually as a small percentage with a countdown to the next payment. There is no single indicator for it.
If you are newer to active crypto trading, the crypto day trading guide covers the timeframes and habits that pair with this, and momentum trading digs into the RSI and MACD ideas on their own.
What works: the three things to remember
If you keep only three points from this guide, keep these.
- Futures add funding, basis and leverage. The first two tell you when the crowd is leaning too far. The third scales your result and, unmanaged, ends in liquidation.
- Stack the reads, do not rely on one. MACD for direction, RSI for stretch, funding for crowding. Agreement across all three is a stronger trade than any single signal.
- Low leverage is the edge nobody sells you. Two to five times keeps you alive through normal noise. High leverage only moves the liquidation price closer to the next ordinary candle.
Crypto futures are a sharper tool than spot, and sharper tools cut both ways.
Traded with a stop, low leverage and a read on the crowd, they let you profit in both directions. Traded on maximum leverage and hope, they are the fastest way to a blown account in the market.
FAQ
What are crypto futures, in plain terms?
How do I trade crypto futures for beginners?
What is the difference between crypto futures and spot?
What are perpetual futures in crypto?
What is the funding rate in crypto futures?
What is the basis in crypto futures?
How much leverage should a beginner use on crypto futures?
What is liquidation and how do I avoid it?
Which indicators work best for crypto futures?
Can you lose more than you put in trading crypto futures?
🌍 Our recommended brokers


Reader Reviews
Be the first to review this — tell other traders what actually helped, or where it fell short.
Leave a Review

Momentum Trader & Technical Analyst
Trades momentum across crypto and forex since 2019, built around RSI, MACD, and volume. Turns discretionary setups into rule-based, systematic entries and validates them on data before they go live.