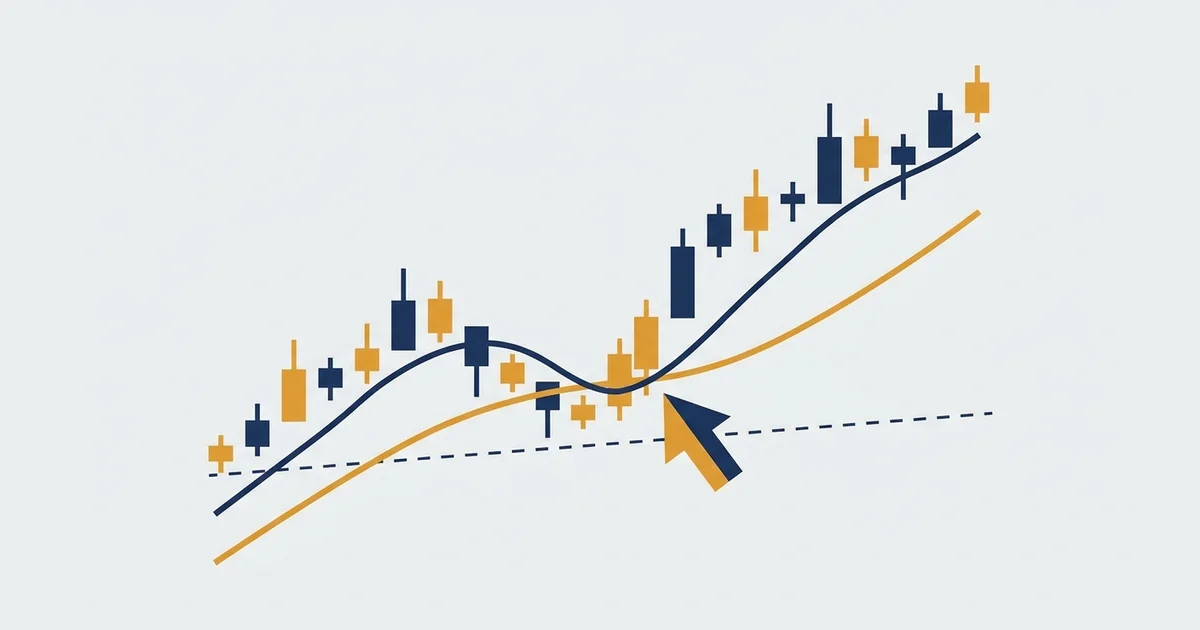

What the Hull Moving Average actually is
Start with the problem it solves. A plain moving average is slow on purpose, so it smooths out noise, but that smoothing means it turns late and you enter a trend well after it began.
The Hull Moving Average, or HMA, is one answer to that lag. It takes a couple of weighted averages, one fast and one slow, subtracts to cancel most of the delay, then smooths the result so it stays readable.
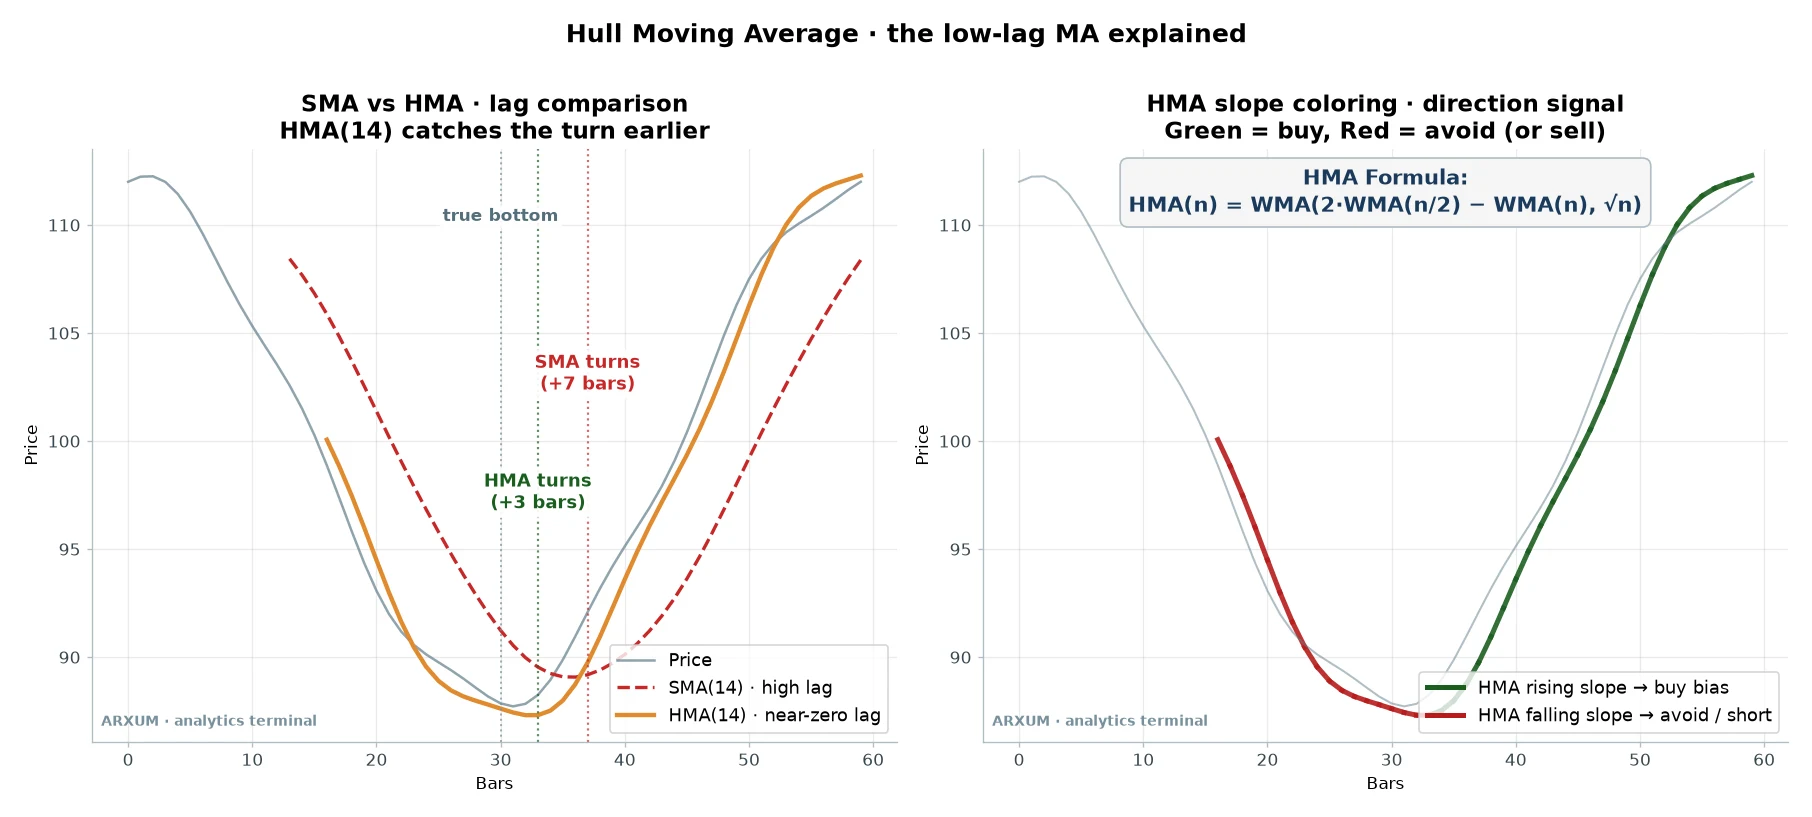
Look at the left panel. Both lines track the same dip, but the Hull turns up near the actual bottom while the simple average is still pointing down for another several bars.
That head start is the whole appeal.
You do not need the formula to trade it, but here it is in plain terms. The Hull takes a weighted average of a short window, doubles it, subtracts a weighted average of the full window, then smooths that with a final average over the square root of the length.
If that reads like noise, ignore it. The line is one click on any charting platform, and the only thing you read off it is direction.
Reading the Hull line by its slope
The simplest way to use the Hull is not a cross at all. It is the colour of the line, set by which way it is pointing.
Rising Hull, coloured green, means the trend is up and you want longs. Falling Hull, coloured red, means the trend is down or stalling, so you stand aside or look short. That is the entire read.
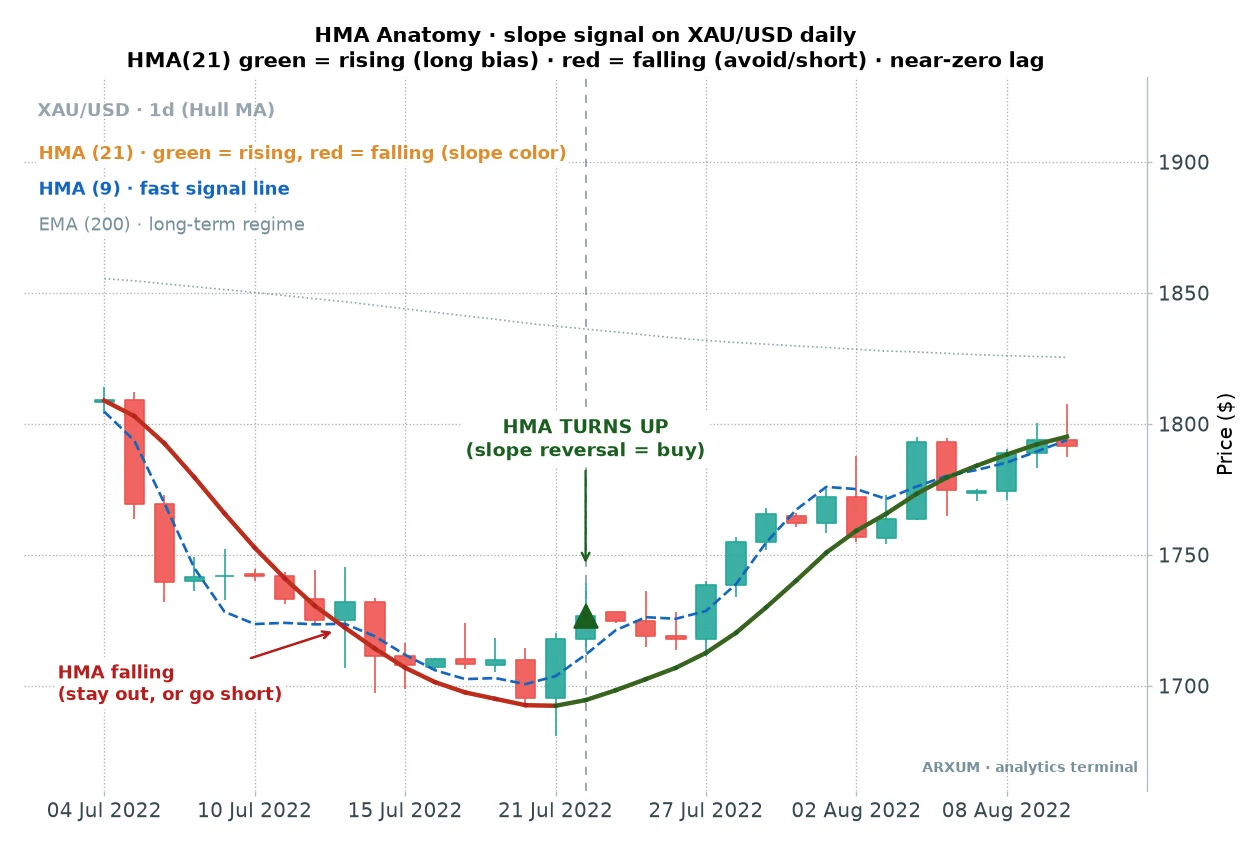
Here is that read on real gold. The line runs red down into the low, then the slope rolls over and it prints green.
That green flip is a buy signal on its own, and because the Hull has so little lag, it arrives days before a normal average would agree.
Two other lines sit on that chart, and you will see them on every example below, so meet them now.
- The 200-day EMA is a slow exponential moving average of the last 200 days. Price above a rising one means the bigger trend is up, and it is the regime filter that keeps you on the right side of the market.
- ADX is a standard trend-strength gauge that runs from zero upward. A reading above about 22 means a real trend is underway rather than chop, and it is free on TradingView. The cleanest Hull signals fire when ADX is already above that line.
Three ways to trade the Hull Moving Average
The Hull gives you the same tool in three flavours, and the data says all three work on gold. They differ in how many signals they give and how jumpy each one is.
Here they are, best to worst by profit factor over the full eight years. Tap a row to jump to its rules.
| Setup | Trades | Profit factor | Net on $1,000 |
|---|---|---|---|
| Fast/slow Hull cross | 89 | 1.92 | +104% |
| Price crosses the Hull | 93 | 1.89 | +88% |
| The slope flip | 93 | 1.88 | +89% |
A word on profit factor, since it carries the table. It is every dollar the strategy won divided by every dollar it lost.
Above 1.0 it makes money; a 1.9 means it won about $1.90 for every $1 given back. Read all three against that.
The three numbers are almost a tie. That is worth more than any single one being high, because it says the edge is in the Hull line itself, not in one lucky variant.
1. The fast/slow Hull cross
This is the strongest of the three, and it works like a classic two-line crossover with the lag stripped out.
You run two Hull lines, a fast one at length 9 and a slow one at length 28. The rules are short:
- Timeframe: the daily chart on gold.
- Buy when the fast Hull crosses up through the slow Hull, and only while price is above the 200-EMA.
- Stop below the recent swing low. Target at twice that risk, a reward-to-risk of 1:2.
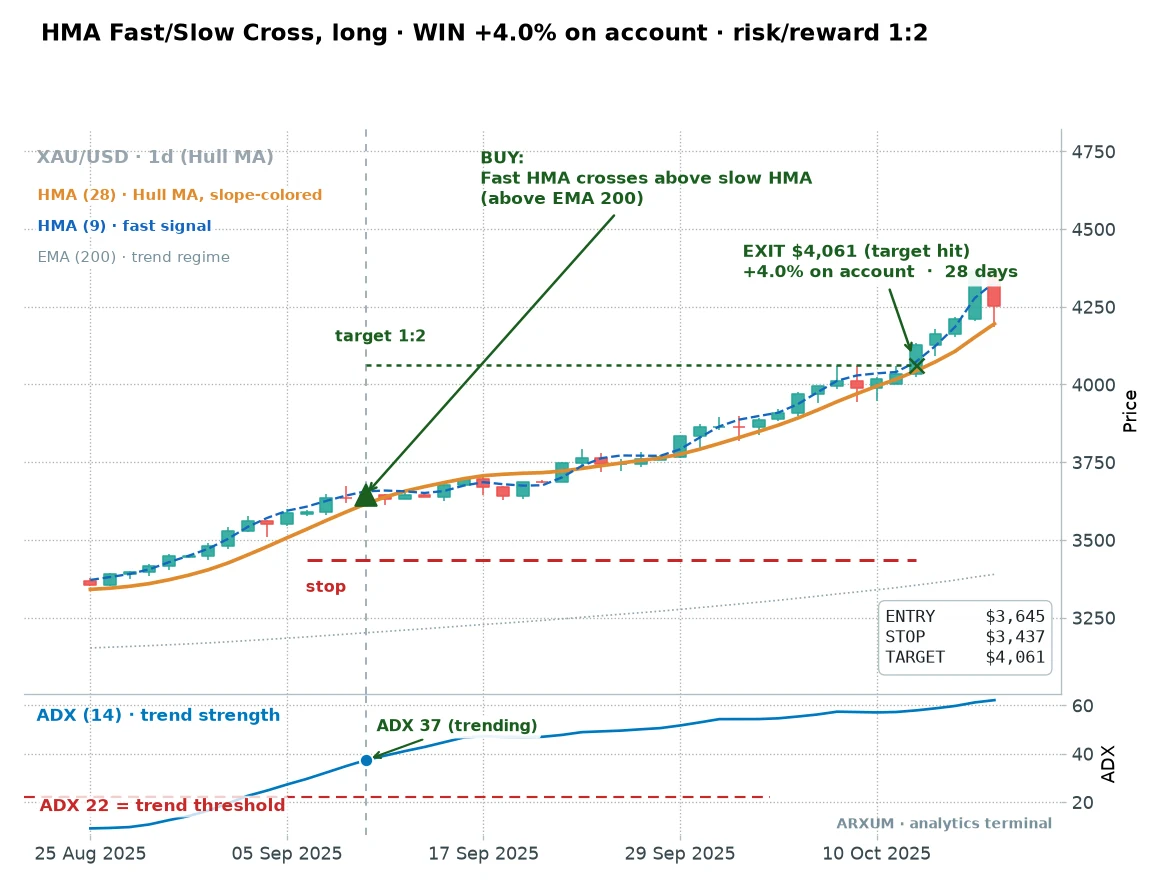
Trace it. The fast line pushed up through the slow line at the marked bar, price was above the 200-EMA, and ADX was already reading above 22.
You bought the cross, set the stop below the swing, and the trend carried it to the target four weeks later.
The 1:2 reward means the winner made twice what the stop risked. At 2% of the account per trade, that is a 4% gain on this one position.
That reward-to-risk, written 1:X, is the risk-reward ratio every setup here is built around.
Now the same trade in plain money, so you can size one yourself. Gold was near $3,645 at entry with the stop at $3,437, a gap of about $208 an ounce.
To risk $20, which is 2% of a $1,000 account, you divide that $20 by the $208 stop and buy roughly 0.096 of an ounce of gold.
That is a fraction of a standard 0.01-lot order, which is one full ounce, so a small account often needs a broker that offers fractional or cent-lot sizing to place the trade at the right risk. The whole position is worth only about $350, roughly a third of the account, so you are well under one-to-one leverage.
A broker’s leverage here is margin headroom that frees up capital, it is not extra risk. Your loss stays pinned at $20 by the stop, whatever leverage the broker offers.
Two trades are anecdotes, though. Here is what the setup did across its whole run.
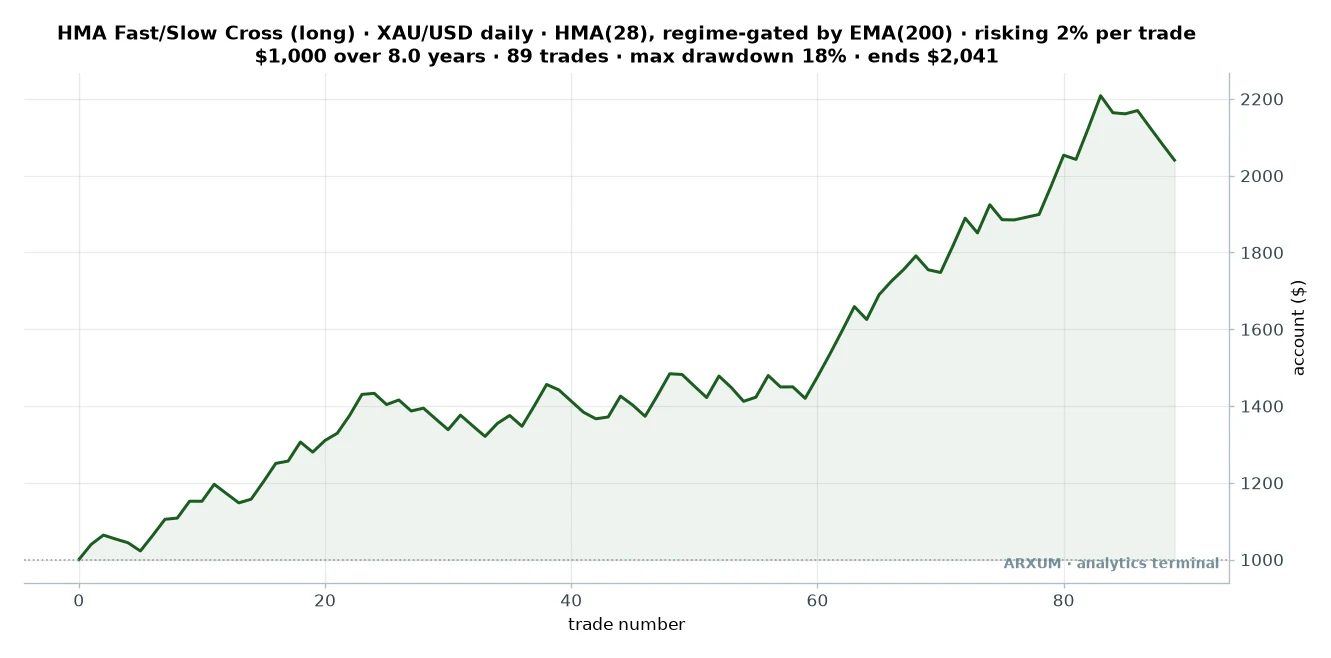
| Trades | 89 |
| Win rate | 56% |
| Reward-to-risk | 1:1.5 |
| Profit factor | 1.92 |
| Max drawdown | 18% |
| Net return on $1,000 | +104% |
Two rows on that table earn a plain word, because they repeat on every setup below.
- Reward-to-risk 1:1.5 is the realised average, not the target. The rules aim for a 1:2 target, but some trades exit before the full double and the losers pull the mean down, so a typical result lands nearer 1.5 times the risk than twice it.
- Max drawdown 18% is the deepest fall from a high point the account took along the way, the worst losing stretch you would have had to sit through to earn the rest.
Read the shape, not just the end. The account grinds sideways through the first half, small wins and losses trading off, then the recent bull run carries the back third.
That is the honest face of a trend setup. A 56% win rate, a lot of nothing, then a handful of runners that pay for the year, at the shallowest drawdown of the three.
2. The price cross
The second setup drops one of the Hull lines. Instead of two Hulls crossing, you watch price itself cross the single Hull line.
- Timeframe: the daily chart on gold.
- Buy when a daily candle closes above the Hull line, while price is above the 200-EMA.
- Stop below the recent swing low, target at 1:2.
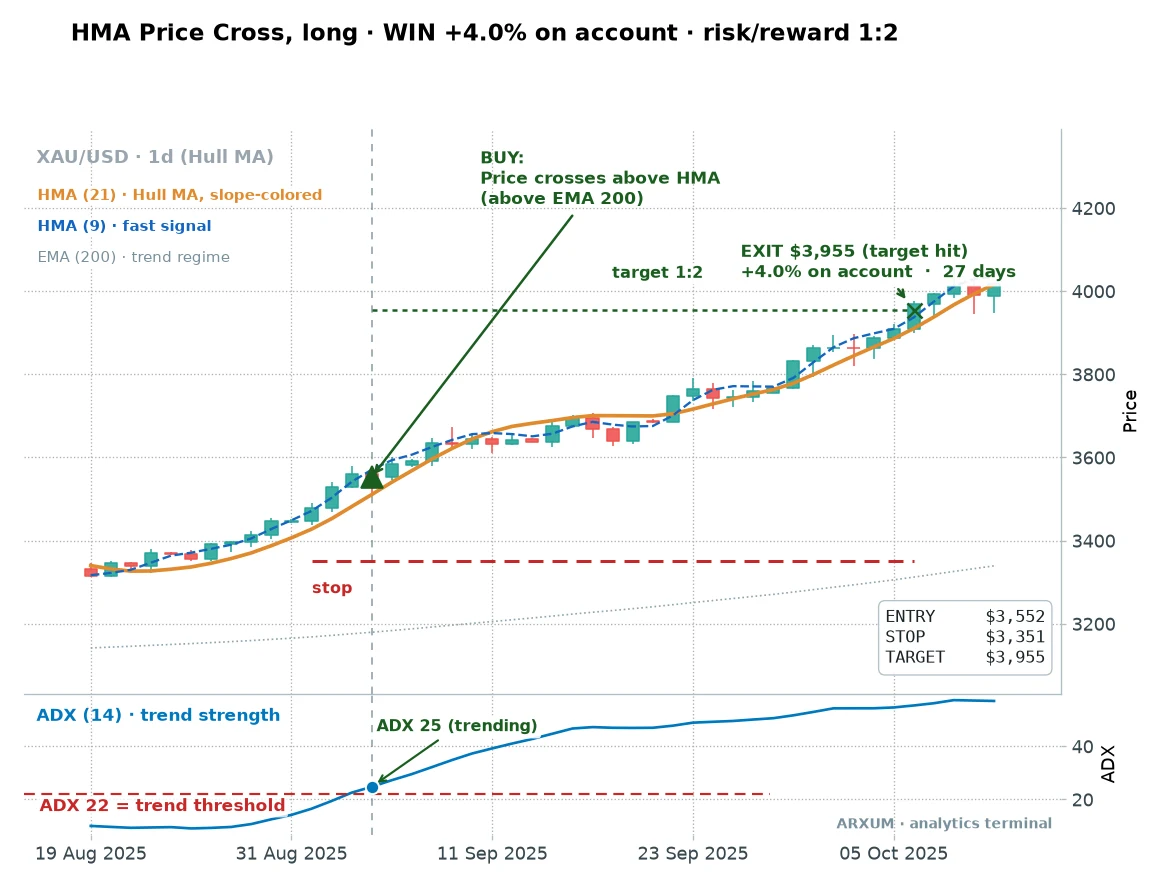
This is a touch quicker to fire than the two-line cross, so it catches trends a little earlier and takes a few more bad ones. The trade above is the clean version: price broke above the line, ADX confirmed a real trend, and the move ran to target in under four weeks.
It still works in the current market, not just the old history. Here is a recent one.
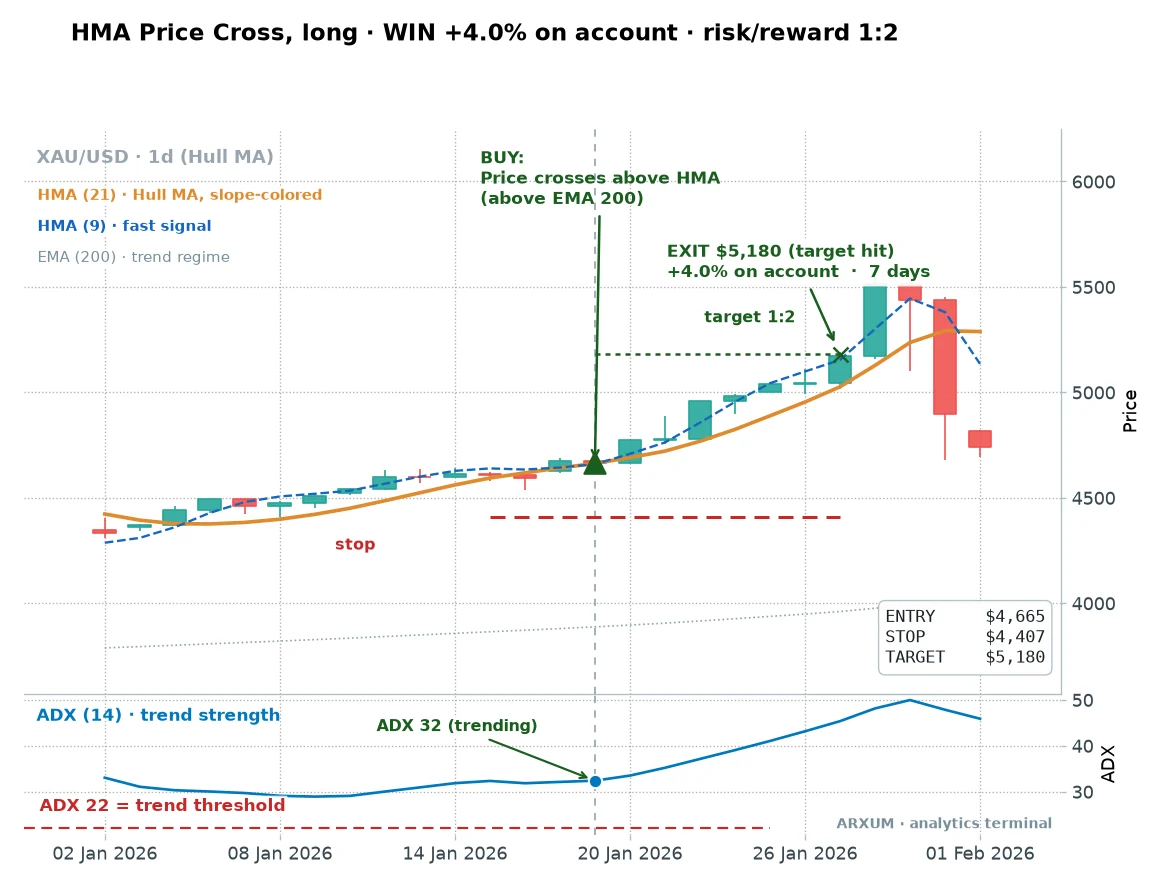
Same rules, faster payoff. The Hull turned up under price, the candle closed above it, and the trend obliged inside a week.
Now the whole run, losers included.
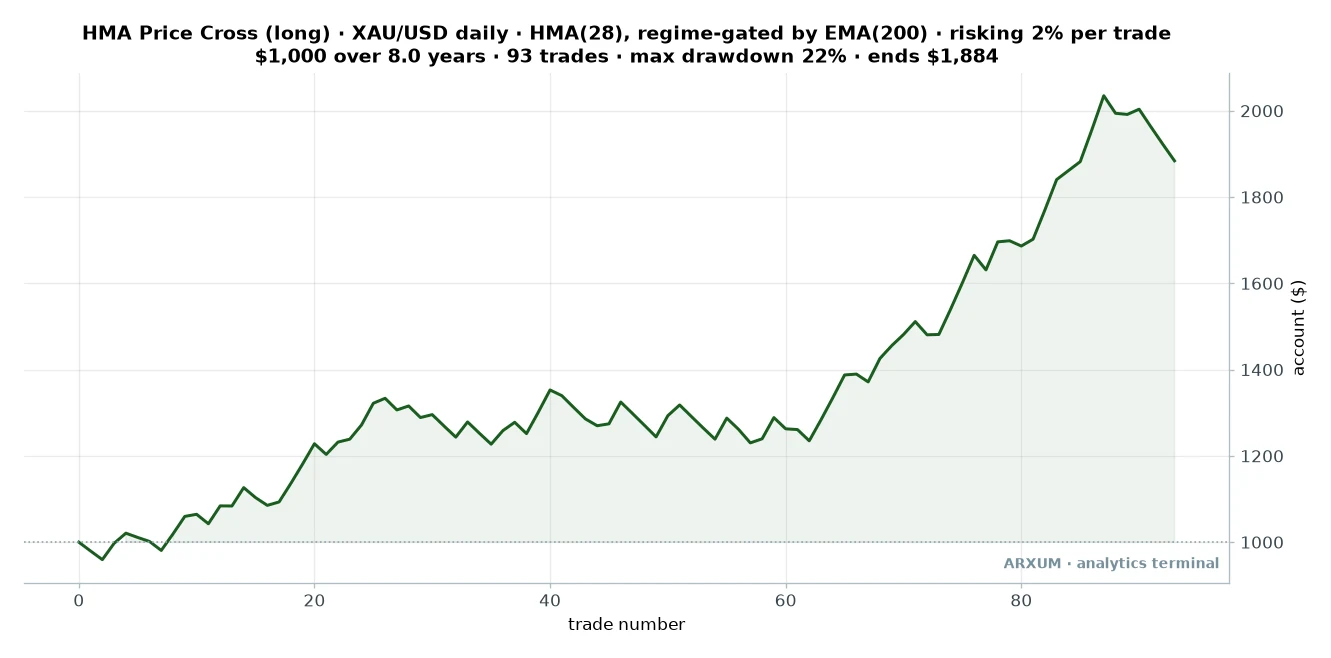
| Trades | 93 |
| Win rate | 56% |
| Reward-to-risk | 1:1.5 |
| Profit factor | 1.89 |
| Max drawdown | 22% |
| Net return on $1,000 | +88% |
Nearly the same profit factor as the two-line cross, at a slightly deeper drawdown. The extra earliness is a fair trade: you get in sooner and eat a few more whipsaws for it.
3. The slope flip
The third setup is the one from the reading section, traded on its own. No second line, no price cross, just the Hull line changing colour.
- Timeframe: the daily chart on gold.
- Buy the bar the Hull slope turns up, from red to green, while price is above the 200-EMA.
- Stop below the swing low, target at 1:2.
This is the earliest and jumpiest of the three, because a slope can flick up for a single bar and roll back over. That is why it needs the 200-EMA gate more than the others do.
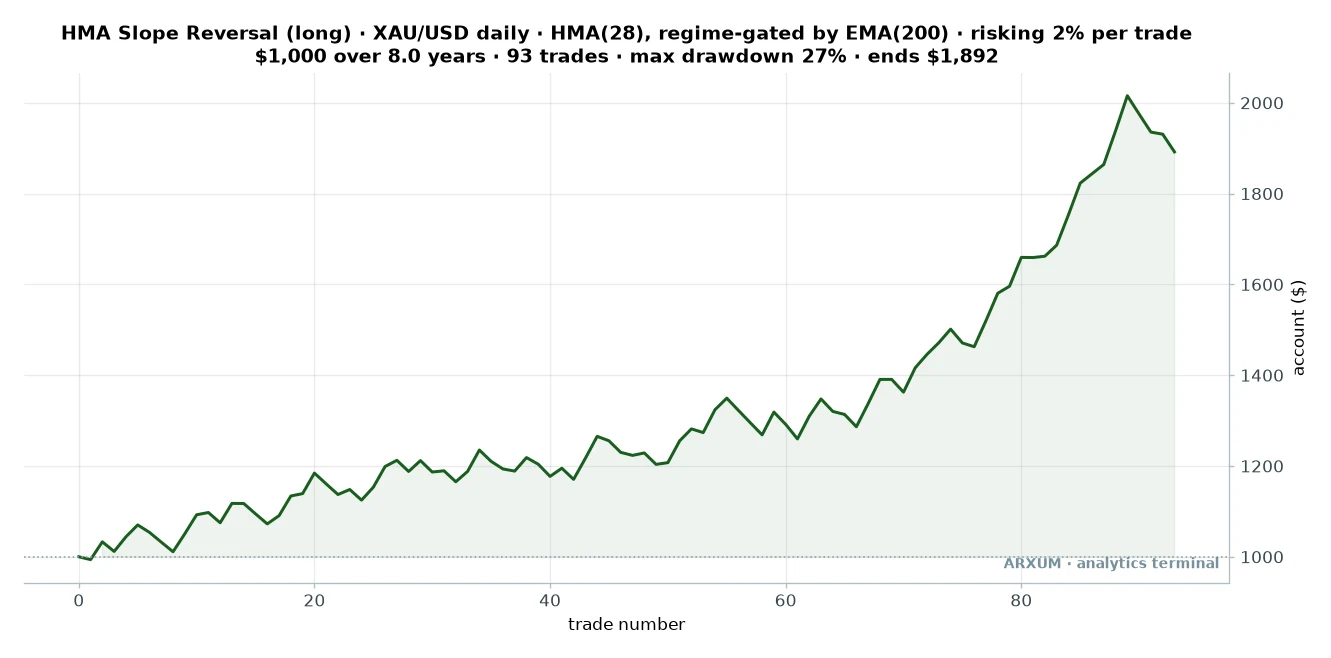
| Trades | 93 |
| Win rate | 54% |
| Reward-to-risk | 1:1.6 |
| Profit factor | 1.88 |
| Max drawdown | 27% |
| Net return on $1,000 | +89% |
It ends in almost the same place as the other two, but the ride is rougher, a 27% drawdown against 18% for the fast/slow cross. Same edge, more stomach required.
The takeaway across all three: pick the fast/slow cross if you want the smoothest ride, the price cross if you want to catch trends a touch earlier. The slope flip is for traders who want the earliest entry and can sit through the deepest dips.
Where the Hull line breaks
Low lag is the selling point and the flaw in one. A line that turns early also turns on moves that never show up.
Here is what that costs you on a real trade.
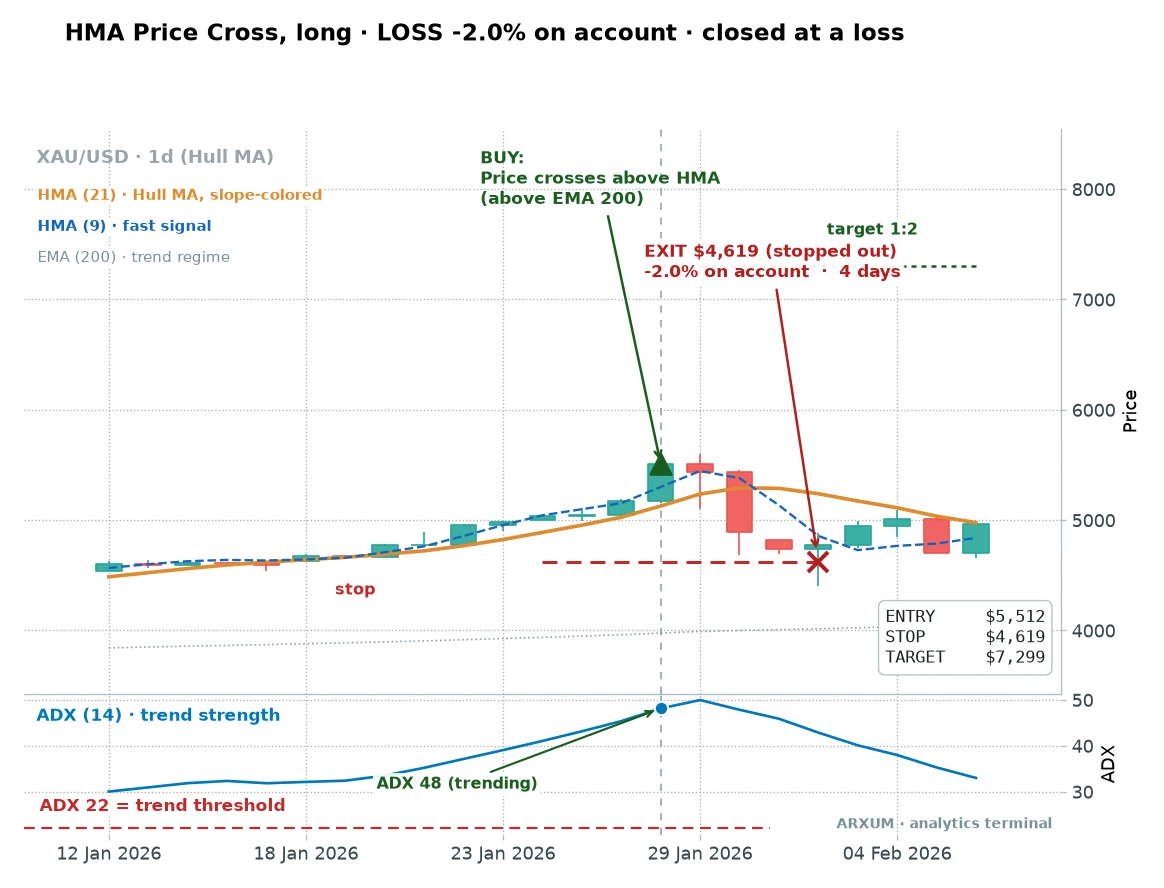
This one had everything the rules asked for. Price crossed the Hull, it was above the 200-EMA, and ADX read 48, a strong trend by any measure.
It still lost.
The problem was that the move was already extended when the cross fired. Price had run a long way, the buy came late in the leg, and it reversed within four days.
The stop did its job and kept the loss to one unit of risk, 2% of the account.
There is no filter that removes these. A trend setup pays for its big winners with a steady drip of small losses like this one, and the only job is to keep each one small.
The second break is the short side, and it is worse. On gold, taking the red flip to sell was a losing strategy across the whole test, a profit factor of 0.52 for the slope-flip short.
The reason is plain: gold has been in a long bull run, and you cannot fade a trend that keeps going. Every red flip bet against a market that climbed anyway.
That is why the 200-EMA gate matters. It keeps you long-only while gold is above the line, and the short side opens up only if the bigger trend genuinely flips.
Match the tool to the market.
An honest look versus just holding gold
One number keeps the whole thing in perspective. Over the same eight years, simply buying and holding gold returned far more than any of these setups on raw percentage, because the metal has been in a historic bull run.
So why trade the line at all? Because buy-and-hold also sat through a drawdown near 45% on the way, and these setups held their worst drop to between 18% and 27%.
They are in the market only when the trend is confirmed, and out of it when it is not.
That is the honest pitch. The Hull setups are not here to beat a raging bull on total return.
They are here to catch trends with far less pain, and to keep working when gold eventually stops going straight up.
Does the edge survive out of sample?
A backtest is easy to fit to the past. The test that matters is whether an edge holds on data it was never tuned to.
We split each setup’s trades into an earlier half and a later half, then checked whether the later, unseen trades paid like the earlier ones.
| Setup | Earlier trades (in-sample) | Later trades (unseen) |
|---|---|---|
| Price cross | 1.76 | 1.99 |
| Slope flip | 1.49 | 2.24 |
| Fast/slow cross | 1.88 | 1.94 |
Read it this way: the left column is the half the setup was checked on, the right column is the later trades it never saw. An edge that survives the unseen half is the trustworthy kind.
All three got better, not worse, on the unseen trades. That is the opposite of a curve-fit, where the number falls apart the moment you leave the data it was tuned to.
The honest caveat is that most of that recent strength rode the gold bull run. If gold spends a year going sideways, expect these setups to grind rather than gallop.
That is a condition to know, not a reason to distrust the line.
How to set it up and trade it
If you want to put this to work, here is the whole method in plain steps.
- Load the lines. On the daily gold chart, add the Hull Moving Average at length 28, a second Hull at length 9 if you want the fast/slow cross, the 200-EMA for regime, and ADX for a trend-strength check.
- Check the regime. Only take longs while price is above the 200-EMA. On a bull chart the short side simply waits.
- Wait for your signal. The fast Hull crossing the slow Hull, price closing above the single Hull, or the slope flipping green, depending on which setup you chose.
- Sanity-check the trend. The cleanest signals fire with ADX already above 22. A cross into a flat, sub-22 market is the one most likely to whipsaw.
- Place the order. A buy at the signal close, a stop-loss in the field below the recent swing low, and a take-profit at twice that distance for the 1:2 target.
- Size to the stop, not the other way round. Risk a fixed slice of the account, around 2% per trade, and let the position size fall out of where your stop sits. Never widen the stop to fit a bigger position.
On the tools, name the exact indicators so you reproduce these charts and not a look-alike. On TradingView, search Hull Moving Average (HMA) for the line, set the length to 28 or 9.
Add Moving Average Exponential at length 200 for the regime, and Average Directional Index (ADX) at length 14 for the trend check.
If you are matching the charts above bar for bar, note that a couple of the single-line examples are drawn at a slightly shorter length to keep the picture clean. The length that tested best on gold is 28, so trade the 28 and read the shorter one as illustration.
One trap worth flagging. TradingView also lists a popular community script called the Hull Suite, which plots several bands and looks nothing like the single line here.
Stick to the plain Hull Moving Average built-in. On MT4 or MT5 the Hull is not a default, so you add it through Insert, then Indicators, then a custom Hull Moving Average file, while ADX and the EMA are already in the standard menu.
A last word on discipline, tied to these exact numbers. At a win rate in the mid-50s, three or four losses in a row is ordinary variance, not a broken system.
If you hit six or more in a row, that is beyond normal, and a signal to check whether gold has stopped trending and slipped into chop. Chop is the one condition that switches this edge off.
Keep a calm eye on your live results against the trade history above, and only ever trade money you can afford to lose. A tool that rides trends is not a machine that prints in every market.
Where to go from here
The natural next steps are the tools this method leans on:
- The difference between an EMA and an SMA explains the lag problem the Hull was designed to fix, and why a faster line is not always a better one.
- The ADX indicator guide covers the trend-strength gauge that separates a clean Hull cross from a whipsaw.
- The Supertrend indicator is a cousin trend-rider with its own calm-market lesson, worth reading beside this one.
FAQ
What is the Hull Moving Average, in plain terms?
Does the Hull Moving Average actually work?
What are the best Hull Moving Average settings?
What is the difference between the Hull and a normal moving average?
Which is the best of the three Hull setups?
Why does the short side lose?
What timeframe and market is it best on?
How do I avoid the whipsaws?
How much money do I need to start?
Is the Hull Moving Average available on TradingView and MT4?
What do the key terms mean?
Real-time trade setups with entry, stop loss and take profit. Daily market analysis. No subscription, no complicated theory.
🌍 Our recommended brokers


Reader Reviews
Be the first to review this — tell other traders what actually helped, or where it fell short.
Leave a Review

Quant Researcher & Systems Builder
Quantitative researcher who builds the automated systems behind Arxum strategy testing. Works in Python and Pine Script, using AI alongside classic backtesting to validate strategies on years of real data.
