
What statistical arbitrage actually is
Most trading picks a direction. Statistical arbitrage does something colder.
It ignores where the market is headed and trades the gap between two prices that have a habit of staying in line.
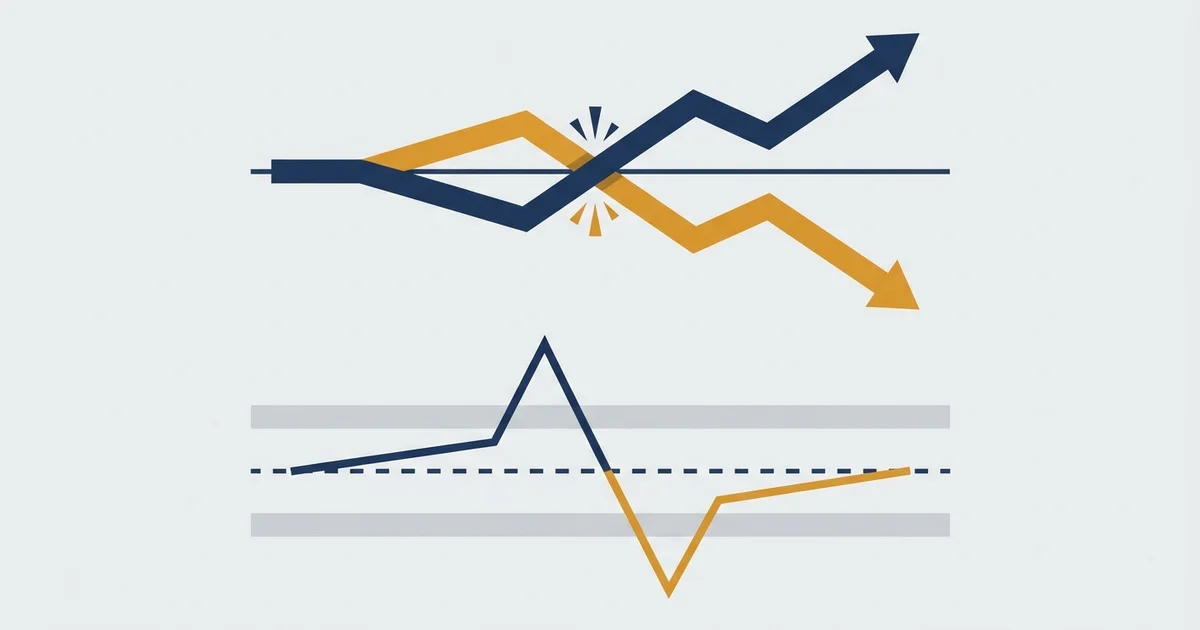
Here is that idea in one picture, before any of the parts.
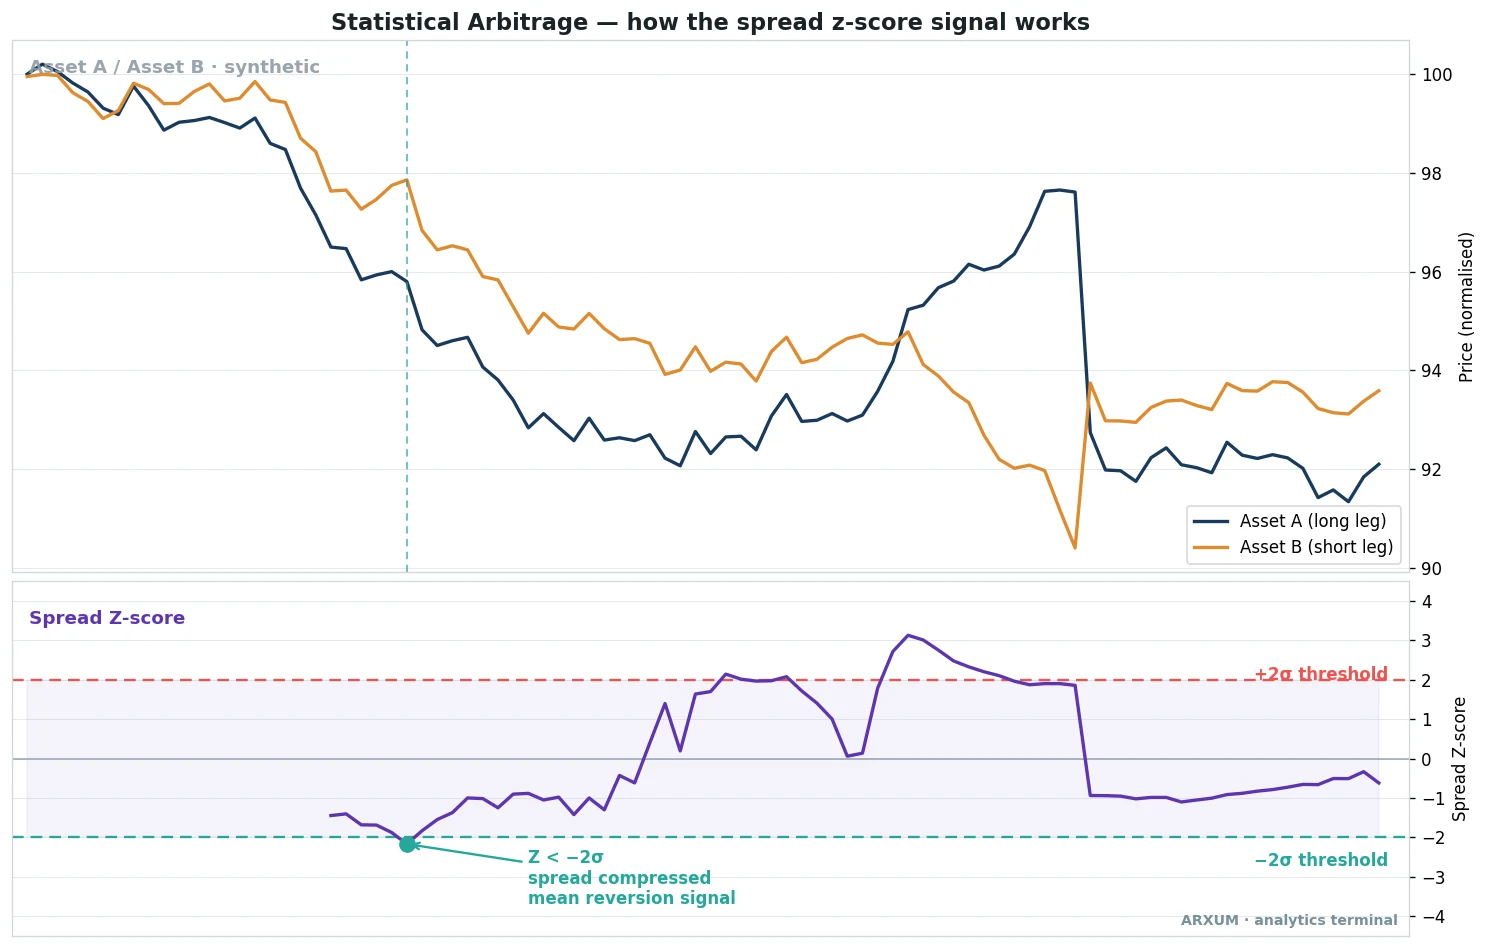
Read the picture with four plain definitions:
- The spread. The gap between the two prices. When the assets drift apart, the spread widens. When they pull back together, it shrinks.
- The mean. The spread’s normal, typical size. Statistical arbitrage assumes the spread keeps returning to this centre.
- Standard deviation (written σ on charts). A measure of how far the spread normally swings. One σ is an ordinary move, two σ is a stretch that does not last.
- The spread z-score (lower panel). The current gap counted in standard deviations. A z-score of zero means the spread sits right on its mean, minus two means unusually compressed, plus two means unusually wide.
How to read it in one line: when the z-score pushes past two in either direction, the relationship is stretched, and the trade bets it snaps back toward zero.
True stat arb versus the version you can actually run
The phrase covers two very different worlds, and it pays to be honest about which one is within reach. A hedge fund running statistical arbitrage is not doing what a retail trader can do at home.
| Feature | True stat arb (funds) | What retail can run |
|---|---|---|
| Number of legs | Hundreds of pairs at once | One pair, or one asset |
| Speed | Sub-second, co-located servers | Hours to days, a laptop |
| Signal | Machine-learned, many factors | A single spread z-score |
| Edge per trade | Tiny, repeated millions of times | Small, repeated by hand |
| Costs | Fractions of a pip, negotiated | Retail spreads and swaps |
The takeaway is blunt. You are not going to out-compute a fund.
What you can borrow is the core idea, applied slowly on a handful of markets where the edge is big enough to survive retail costs.
- The math is the same. A z-score is a z-score whether you run one or a thousand.
- The timescale is different. Retail wins on the slow charts, not the fast ones. The speed race belongs to high-frequency trading firms.
- The honesty is the same. This is a probability bet, not free money. Real arbitrage is risk-free by definition. Statistical arbitrage only tilts the odds.
The three flavours you will meet
Almost every version of stat arb trading fits into one of three buckets. They share the z-score engine, but they differ in what they trade and how hard they are to run.
Timeframes are written short below: H4 is the 4-hour chart, D1 the daily, and TF just means timeframe.
1. Pairs trading, the market-neutral classic
This is the textbook version, and the chart at the top of this page is exactly it. You find two assets that move together, buy the one that has fallen behind, and short (sell in a bet the price falls) the one that has run ahead.
You do not care if the whole market rises or falls. You only care that the gap between the two closes.
How it looks:
- The two price lines drift apart, one leg leading, the other lagging.
- The spread z-score pushes past plus or minus two σ, the stretch that signals a trade.
- You go long the cheap leg and short the rich leg at the same time, then wait for the z-score to fall back toward zero.
| Role | How you use it | Best read |
|---|---|---|
| Entry trigger | Open the pair when the spread z-score crosses past plus or minus 2 | Gold vs silver, EUR/USD vs GBP/USD |
| Direction | Long the leg that lagged, short the leg that led | Any correlated pair |
| Context filter | Only trade pairs whose gap has a long habit of closing | D1 relationship, H4 signal |
| Exit cue | Close both legs as the z-score returns toward zero | Quiet, range-bound conditions |
| Hard stop | Bail if the z-score keeps stretching past 3 and will not revert | When the pair has broken |
Where it breaks: when the two assets stop being a pair. A merger, a policy shift, or a fresh trend in one leg can push the spread wide and keep it there.
Then the “cheap” leg just keeps getting cheaper.
2. Single-asset mean reversion, the simplest version
You do not need two assets to use the z-score idea. The lighter version measures how far a single market has stretched from its own recent average, then fades that stretch.
It is not market-neutral, so it carries more directional risk, but it takes one screen and one instrument.
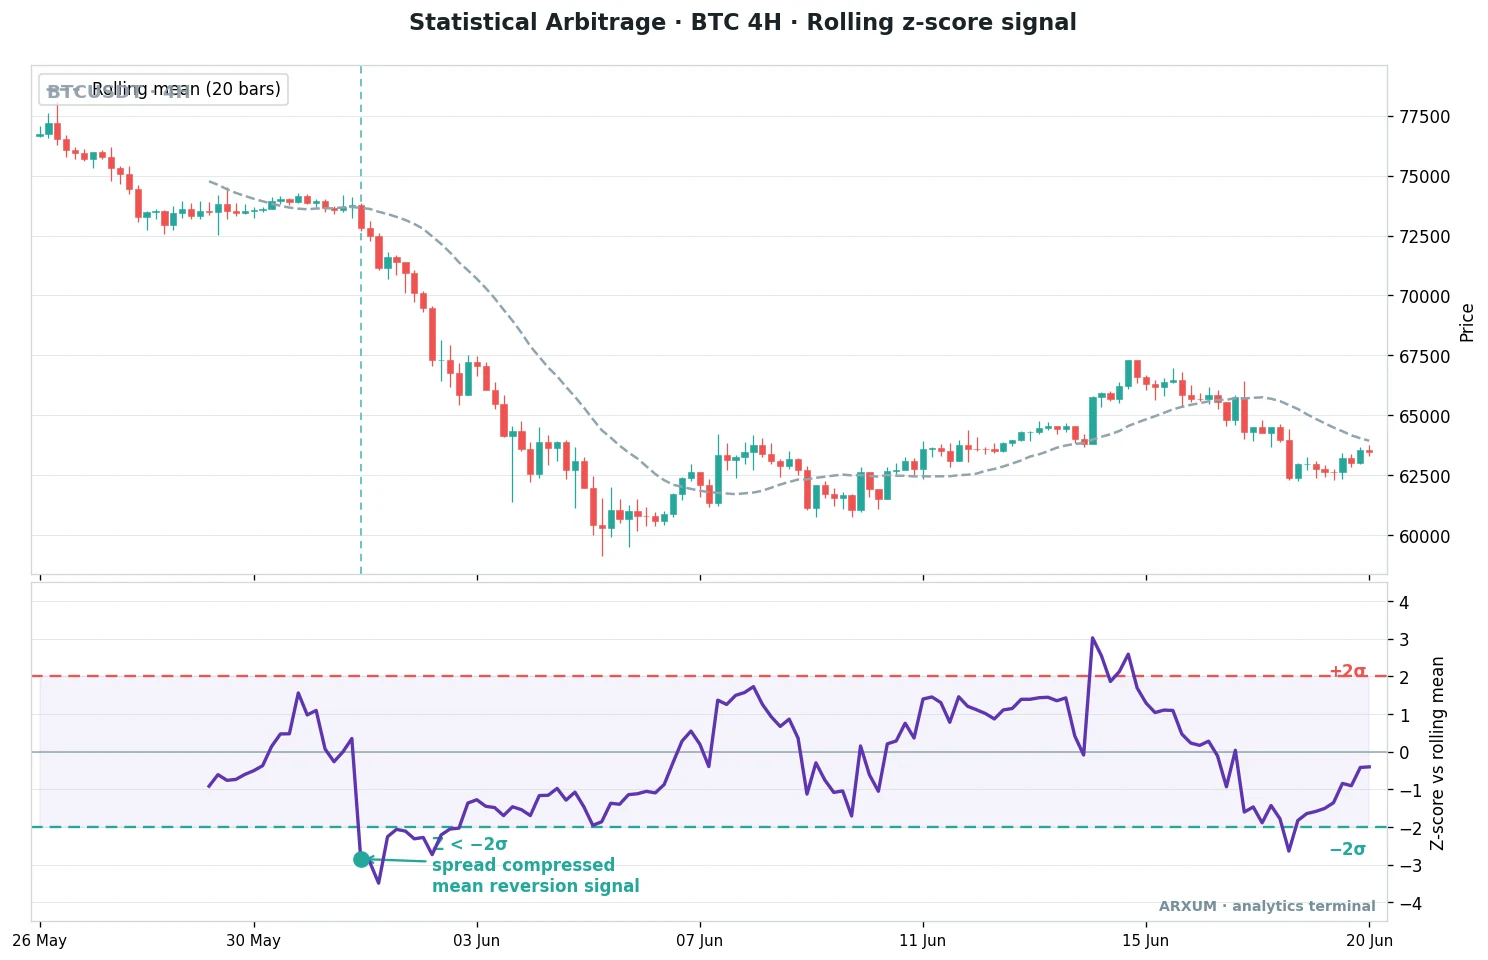
Reading the chart:
- Rolling mean (grey dashed). A moving average over the last 20 bars. It slides forward with price and marks where the market has been sitting lately.
- The z-score (lower panel). Price distance from that rolling mean, counted in standard deviations. Below minus two is unusually low, above plus two is unusually high.
- The signal. A dip past minus two σ says price has run far below its own recent normal, the stretch a mean-reversion buyer fades.
Now the same engine flashing the other way, on Forex.
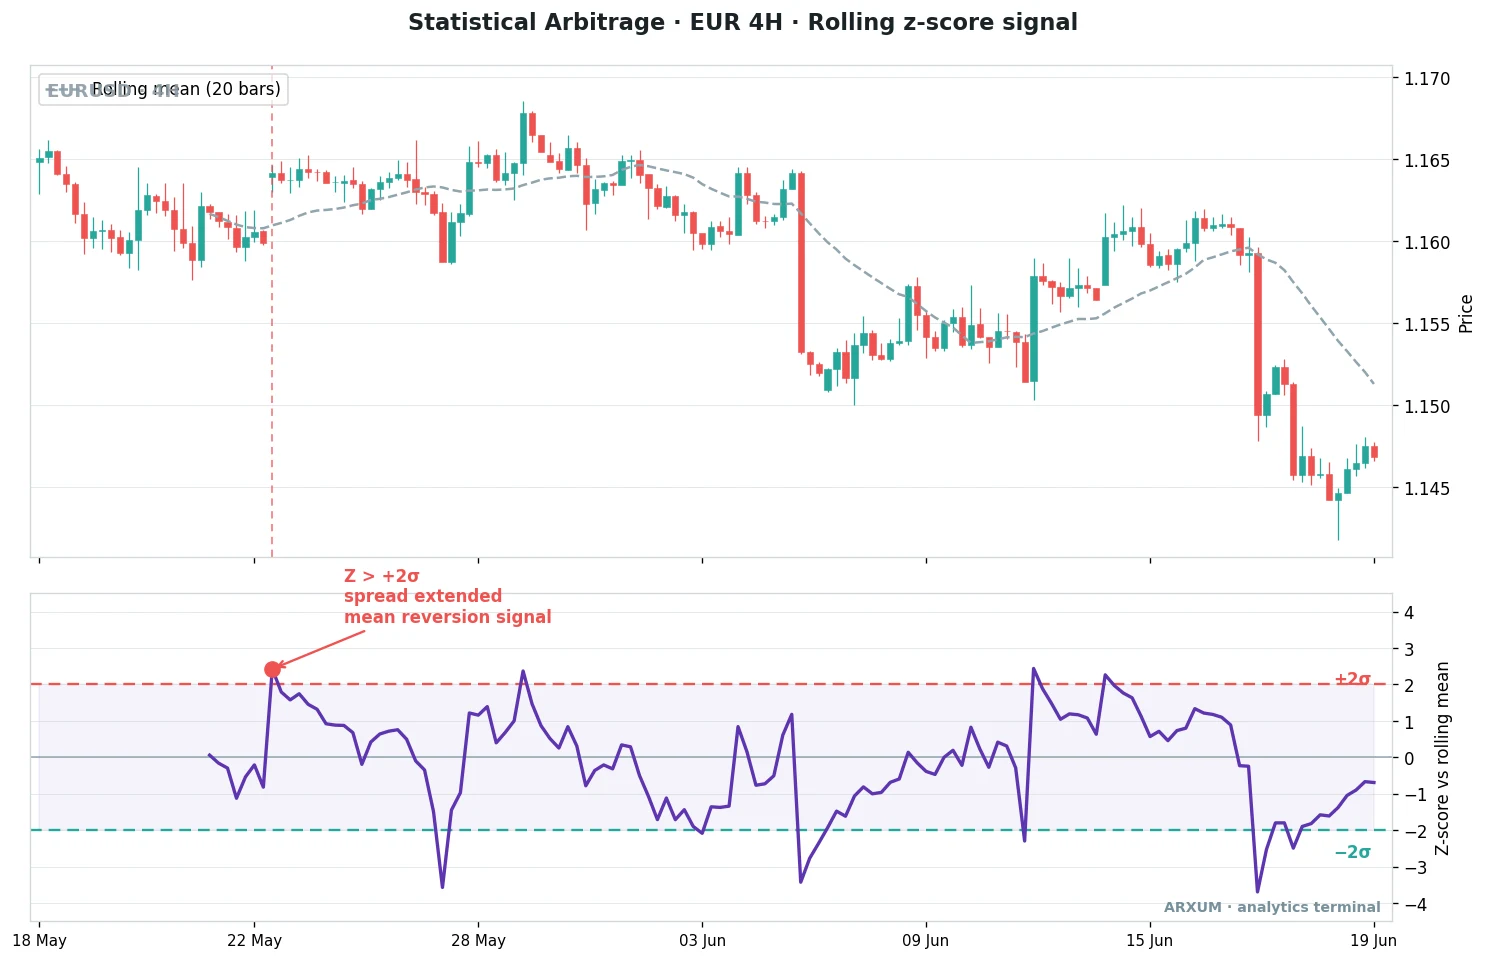
Reading the chart:
- The pattern is symmetric. A push above plus two σ is a sell signal, a dip below minus two σ is a buy signal.
- The 20-bar mean is the target. The trade closes as price drifts back to that line and the z-score falls toward zero.
- The band between plus and minus two σ is the quiet zone where you do nothing.
| Role | How you use it | Best TF / instrument |
|---|---|---|
| Entry trigger | Buy below minus 2 σ, sell above plus 2 σ | BTC H4, EUR/USD H4 |
| Regime filter | Only fade when the market is ranging, never in a strong trend | D1 regime over an H4 signal |
| Confirming tool | Pair the z-score extreme with a reversal candle at the band | Gold H4, EUR/USD H4 |
| Exit cue | Close as price returns to the 20-bar mean, z-score near zero | Any quiet market |
| Cousin setup | The same idea drawn as bands is our Bollinger Bands read | Ranging gold, Forex |
Where it breaks: a one-way trend. Price can ride two σ from its mean for days while the market keeps going, and fading it hands you loss after loss.
This is the classic failure of every mean-reversion tool, and the reason the regime filter matters more than the entry.
3. Basket and index arbitrage, the pro tier
The scaled-up version trades many legs against a benchmark at once. An index fund arbitrage desk might buy a basket of underpriced components and short the index future against them, or trade an ETF against the stocks inside it.
The z-score idea still holds, but now it measures a whole basket’s gap, not a single pair.
| Element | What it means | Who runs it |
|---|---|---|
| The legs | Dozens of components against one index or ETF | Funds and prop desks |
| The signal | The basket's combined gap from fair value | Automated, model-driven |
| The edge | Tiny per trade, harvested at scale and speed | Needs code and cheap costs |
| Retail access | Mostly out of reach on execution and fees | Study it, rarely trade it |
Honest verdict: this tier is where statistical arbitrage started, and it is where most retail traders should stop reading and start borrowing ideas instead. The execution and cost bar is too high without automation.
If code is your angle, our machine learning trading and algorithmic trading guides are the doors in.
Pairs selection, the part that actually decides it
The signal is the easy bit. Picking two assets that truly belong together is where pairs trading lives or dies.
Two ideas do the work, and beginners blur them:
- Correlation measures whether two prices move in the same direction. High correlation is necessary but not enough. Two assets can rise together for a year and still drift apart forever.
- Cointegration is the stronger test. It asks whether the gap between the two is stable and keeps pulling back. A cointegrated pair can wander, but the spread always comes home. That is the property a mean-reversion trade needs.
A workable selection checklist, in plain steps:
| Check | What you want | Why it matters |
|---|---|---|
| Same driver | Both moved by one theme | A shared cause keeps them linked |
| Correlation | Strong and steady over time | They must move together first |
| Stable spread | The gap keeps returning to a mean | This is the reversion you trade |
| Enough moves | The spread stretches often enough | No stretches, no trades |
| Tradeable costs | Spreads and swaps do not eat the edge | Two legs mean double the costs |
Good starting pairs share an obvious driver: gold and silver (both precious metals), EUR/USD and GBP/USD (both weighed against the dollar), or in statistical arbitrage crypto, Bitcoin and Ethereum (both crypto majors that rise and fall as a bloc). The cleaner the shared story, the more stable the spread.
Which version to use, and when
The three flavours are not rivals. Each one fits a different trader and a different market mood.
| If you are | Use this flavour | Why |
|---|---|---|
| New and on one screen | Single-asset mean reversion | One market, one z-score, easy to see |
| A patient swing trader | Pairs trading | Market-neutral, less exposed to a crash |
| A coder with data | Basket arbitrage | Only works at scale and with automation |
| Facing a strong trend | None, stand aside | Every mean-reversion bet gets run over |
Rule of thumb: the market flips between calm and trending over time. The single most useful habit in stat arb is a regime check that decides “is this market ranging?” before any z-score signal is allowed to fire.
What it costs you, honestly
Statistical arbitrage sounds safe because it is market-neutral, and that framing can lull a beginner. The risks are real, they are just different from a directional trade.
- Divergence risk. The spread can widen far past two σ and stay there. “Cheap” is not a floor. A broken pair keeps breaking.
- Correlation breakdown. The relationship you built the trade on can simply end. News, policy, or a structural shift can decouple two assets overnight.
- Double costs. Pairs trading holds two positions, so you pay two spreads and two sets of overnight swaps (the daily fee for holding a leveraged trade overnight). On tight edges, costs quietly eat the profit.
- Crowding. Popular pairs attract many traders doing the same thing, which thins the edge and worsens the exits when everyone runs at once.
- False comfort. Market-neutral does not mean loss-proof. It means you swapped market risk for relationship risk.
The one honest sentence: this is a probability edge that pays over many trades, not a sure thing on any single one. Expect losing streaks, size small, and never let one broken pair define the account.
How to actually try it
A first statistical arbitrage strategy does not need a fund or a physics degree. You need one pair or one market, a z-score, and the discipline to trade only the clean stretches.
A sane first path:
- Pick one flavour and one market. For a beginner, single-asset mean reversion on EUR/USD H4 is the gentlest start. Narrow beats clever.
- Set up the tools. On TradingView, add a moving average (length 20) for the rolling mean, then search the indicator list for a “Z-Score” study to plot the lower panel. MT4 and MT5 have similar community z-score indicators under Insert, then Indicators.
- Write the exact rules. Buy below minus two σ, sell above plus two σ, exit at the mean, and only in a ranging market. Real numbers, no judgement calls.
- Size by risk, not conviction. A common cap is risking about 2% of the account per trade. On a $500 account that is $10 of risk, which you turn into a position size, usually micro lots (the smallest 1,000-unit trade), using our position sizing guide.
- Know your reward-to-risk. Read our reward-to-risk guide so you know what a 1:X trade means: risking $1 to make $2 is 1:2. For a pair, that risk is counted across both legs combined.
- Check it before you trade it. Run the rule over past data first. Our backtesting guide shows how, and it is where most pretty ideas quietly die.
Two warnings worth more than any setup:
- A stretched market can get more stretched. The regime filter, not the entry, is what keeps mean reversion alive. Never fade a strong trend.
- No pair stays a pair forever. Relationships fade, so keep watching the spread, and be ready to drop a pair when it stops reverting. There is no holy grail here, only a small edge traded with discipline. If you want a calmer, non-arbitrage income idea, the carry trade is a different market-neutral flavour worth knowing.
What works, in three lines
- Trade the gap, not the direction. Statistical arbitrage bets a stretched relationship snaps back, whether that is two assets or one asset and its own mean.
- The regime decides. Fade stretches only in ranging markets. In a one-way trend, every mean-reversion signal is a trap.
- Small edge, many trades, tight discipline. Size small, respect the costs, and drop any pair that stops reverting.
FAQ
What is statistical arbitrage, in plain terms?
Statistical arbitrage is a trading method that bets on price relationships returning to normal. Instead of guessing market direction, it measures the gap between two assets that usually move together, or the gap between one asset and its own recent average, and it fades that gap when it stretches too far. The core tool is the spread z-score, which counts how many standard deviations the current gap sits from its typical size. When the gap stretches past about two standard deviations, the trade bets it snaps back toward the middle.
How does statistical arbitrage work?
It works in three steps. First you measure a relationship, either the spread between two correlated assets or one asset's distance from its rolling mean. Second you convert that gap into a z-score, a single number in standard deviations. Third you trade the extremes: when the z-score pushes past plus or minus two, you fade the stretch and wait for it to return toward zero. The bet is not on where the market goes, but on the gap closing back to normal.
Is statistical arbitrage the same as pairs trading?
Pairs trading is the most common flavour of statistical arbitrage, but the terms are not identical. Pairs trading buys one asset and shorts a second correlated one, trading the spread between them. Statistical arbitrage is the wider family, which also covers single-asset mean reversion and large basket or index arbitrage. Think of pairs trading as the simplest market-neutral version of the broader statistical arbitrage idea.
Does statistical arbitrage work in crypto?
Yes, and the majors are the natural home for it. Bitcoin and Ethereum move as a bloc, so their spread often stretches and snaps back, which suits a pairs approach. Single-asset mean reversion also works on Bitcoin in ranging periods, as the 4-hour chart in this guide shows. The catch is that crypto trends hard and often, so the regime filter matters even more. Fading a strong crypto trend is a fast way to lose.
Is statistical arbitrage risk-free?
No. True arbitrage is risk-free by definition, but statistical arbitrage only tilts the odds. It carries divergence risk, where a stretched spread keeps stretching, and correlation risk, where the relationship you traded simply ends. Being market-neutral removes broad market risk but replaces it with relationship risk. It is a probability edge that pays over many trades, never a guaranteed win on any single one.
What is the spread z-score?
The spread z-score is a single number that says how far the current gap sits from its normal size, counted in standard deviations. A z-score of zero means the spread is right on its average. Plus two means it is unusually wide, and minus two means unusually compressed. Traders treat the plus and minus two levels as thresholds: past them, the relationship is stretched and a mean-reversion trade becomes attractive.
What is cointegration and why does it matter?
Cointegration is a statistical test for whether the gap between two assets is stable and keeps pulling back to a mean. It is stronger than correlation, which only checks that two prices move in the same direction. A correlated pair can drift apart permanently, but a cointegrated pair always brings the spread home. That homing property is exactly what a mean-reversion trade needs, which is why cointegration is the real test for selecting a pair.
How much money do you need to start?
For single-asset mean reversion you can start with a few hundred dollars using micro lots, the smallest 1,000-unit position, because size scales to the account. Pairs trading is a little more demanding, since you hold two positions and pay two sets of costs, so a slightly larger account is more comfortable. The real constraint is not capital, it is having tested rules and the discipline to risk only a small percent per trade.
Which timeframe is best for statistical arbitrage?
For retail traders, the slower charts win. The 4-hour and daily timeframes give the spread room to stretch and revert without drowning you in costs and noise, and they keep you out of the speed race that professional firms dominate. The 1-hour chart can work on very liquid markets, but it whipsaws more. Anything faster belongs to high-frequency firms with infrastructure you cannot match.
What are the key statistical arbitrage terms?
Spread: the gap between two prices, or a price and its mean. Z-score: how many standard deviations that gap sits from normal. Standard deviation: a measure of how far a value usually swings, written as the symbol sigma. Correlation: whether two prices move in the same direction. Cointegration: whether their gap is stable and reverts. Market-neutral: a position with no net bet on the whole market rising or falling. Mean reversion: the assumption that a stretched value returns to its average.
🌍 Our recommended brokers


Reader Reviews
Be the first to review this — tell other traders what actually helped, or where it fell short.
Leave a Review

Quant Researcher & Systems Builder
Quantitative researcher who builds the automated systems behind Arxum strategy testing. Works in Python and Pine Script, using AI alongside classic backtesting to validate strategies on years of real data.