I spent the first three years of my trading career running manual backtests in spreadsheets. Tedious, error-prone, and limited to roughly 200 trades before the dataset became too unwieldy to manage. When I switched to systematic backtesting in Python, I ran 6 years of hourly forex data through a single strategy in under four minutes.
The result was sobering. The setup I had been running with real conviction produced a Sharpe ratio of 0.43 on historical data. Barely worth deploying live. That number didn’t make the strategy worthless: it meant I finally had something to measure against, rather than pattern-matching on gut feeling.
That experience defines what algorithmic trading actually offers. It isn’t a shortcut to passive income or a way to eliminate human judgment. It’s a structured method for testing whether a trading idea has a real, repeatable edge before real money goes in, and for running that edge consistently once confirmed.
This guide covers how algo systems are structured, the main strategy types, how to build and test a system from scratch, and what backtesting numbers actually tell you about future performance.
What Algorithmic Trading Actually Does
Every algo system has three components: a signal generator, a risk filter, and an execution layer.
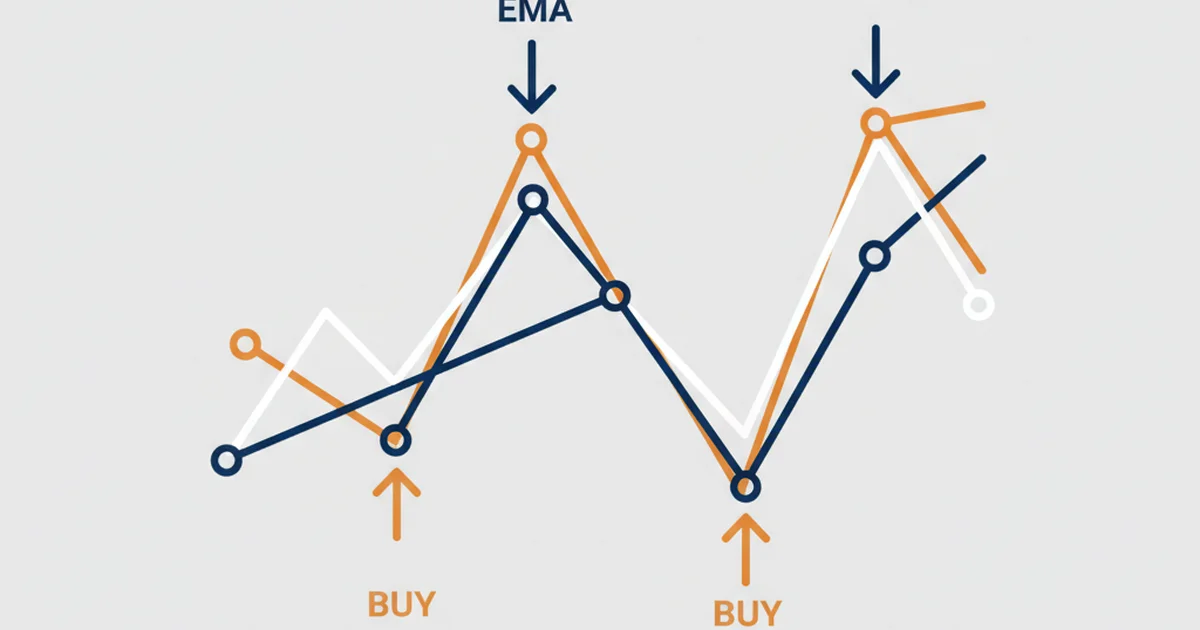
The signal generator is the rule set. Something like: “Enter long when the 9-period EMA closes above the 21-period EMA, price is above the 200 EMA, and ATR exceeds its 20-day average.” The risk filter controls position size, maximum daily loss, and drawdown limits. The execution layer sends the order to the broker.
Manual trading handles all three steps in real time and introduces variability at each stage. An algorithm applies the same logic to every bar, every session, without hesitation or fatigue. That consistency is the core value.
The question isn’t whether algorithmic trading beats discretionary trading. Both can produce results when applied properly. The relevant question is whether you can define your trading rules precisely enough to code them. If you can’t write your entry conditions as a set of if-then statements, your strategy isn’t systematic yet. It’s intuition wearing the label of analysis.
Forcing yourself to make every rule explicit before writing any code often reveals problems in the strategy logic before a single line is committed.
Four Types of Algo Strategies
Most retail and institutional algo systems fall into one of these categories:
-
Trend following: enter in the direction of momentum, exit when momentum reverses. Examples include dual EMA crossover systems, Supertrend signals, and ADX breakout filters. These strategies perform well in directional markets and generate noise in range-bound conditions.
-
Mean reversion: bet that price will return toward a statistical mean after a deviation. The RSI overbought and oversold setup is the simplified retail version. More rigorous implementations use z-score deviations from a rolling mean, entering only when price has moved beyond two standard deviations.
-
Arbitrage and statistical spread trading: mostly institutional territory, requiring direct market access and low latency. At the retail level this appears in simplified form as correlation-based pairs trading between instruments that historically move together, such as EUR/USD and GBP/USD.
-
Pattern-based and ML-assisted systems: entries based on detected chart formations or features derived from training data. These require the most rigorous out-of-sample validation because they are particularly susceptible to overfitting historical patterns.
For most retail traders starting with systematic methods, trend following or mean reversion is the practical entry point. Both have logic that converts directly into code without requiring a machine learning background, and both have enough historical data available to run meaningful tests.
Building an Algo System Step by Step
The process breaks into four distinct stages. Skipping any one of them is the most common reason a strategy fails in live deployment.
Step 1: Write the rules in plain language before coding.
Describe the entry conditions, exit conditions, stop placement, and position sizing logic in plain English. If any part is vague (“enter when price looks strong near support”), that vagueness carries directly into the code. The discipline of writing precise rules often surfaces real weaknesses in strategy logic faster than running the first backtest does.
Step 2: Implement in Pine Script or Python.
TradingView’s Pine Script is the fastest starting point for signal-based strategies on forex, crypto, or index CFDs. It includes built-in bar data, an integrated Strategy Tester, and minimal setup overhead. Python with Backtrader or vectorbt provides more analytical flexibility, including custom slippage models, multi-asset testing, and Monte Carlo simulation, at the cost of higher initial setup time.
I run most initial development in Pine Script because iteration is fast: change a parameter, see the result immediately. Once a strategy passes initial screening in Pine Script, I port it to Python for rigorous walk-forward testing and simulation. The full backtesting process covers data preparation, avoiding lookahead bias, and how to split training and verification data correctly.
Step 3: Backtest across multiple market regimes.
The backtest window needs to cover at least one complete market cycle, including a high-volatility episode and a period of low-directional movement. A 6-month backtest on a trending market tells you almost nothing about how the system behaves when conditions shift. My minimum is 3 years of daily data or 2 years of 4H data as the in-sample window.
Step 4: Forward test on a live account before scaling.
I allocate a $1,000 live forward-test account to every system before increasing position size. Live slippage, execution delays, and spread widening during volatility events all behave differently from backtested assumptions. Running a minimum of 30 live trades before scaling has stopped multiple underperforming systems from receiving meaningful capital beyond the test allocation.
That minimum sounds conservative. It is. But the gap between a confirmed edge and an overfitted historical pattern shows up in those first live trades more clearly than in any additional optimization of the backtest.
Backtesting: The Numbers That Actually Matter
The most common mistake in algorithmic trading isn’t bad code. It’s misreading the backtest output.
Sharpe ratio measures risk-adjusted return. The metric, widely used as the benchmark for strategy quality, means anything below 1.0 is marginal for live deployment on its own. I tested an XAU/USD Supertrend combined with an ATR volatility filter across two years of recent data and got a Sharpe ratio of 1.7, the strongest result I’ve documented in five years of systematic testing. Most retail systems I’ve analyzed come in between 0.4 and 0.9.
Maximum drawdown sets the psychological floor. If historical max drawdown was 34%, the live account will encounter something in that range. Position sizing decisions need to accommodate this number, not just the win rate.
Win rate paired with R:R ratio is what actually determines profitability. A 70% win rate with a 0.3 R:R ratio pays out less than a 40% win rate with 3:1 R:R. Both numbers need to be evaluated together.
Out-of-sample performance is the most honest test available. Split historical data: 70% for building and optimizing the strategy, 30% held back for verification. If the Sharpe ratio drops by more than 40% on the held-out segment, the strategy is fitting to noise rather than exploiting a stable edge.
The result I find consistently counterintuitive, even after running this process across dozens of systems: walk-forward testing eliminates more false positives than any optimization technique. I ran a specific test on an EMA crossover system that showed 58% win rate and Sharpe ratio of 1.4 on in-sample data. On the held-out period, win rate fell to 49% and Sharpe dropped to 0.7. The strategy wasn’t capturing a real edge. It was fitting to historical patterns that didn’t repeat out-of-sample.
My benchmark from five years of systematic testing: 73% of strategies that look good on in-sample data fail on out-of-sample verification. Start with that expectation and the development process becomes more disciplined from the beginning.
| Metric | In-sample (3 years) | Out-of-sample (1 year) |
|---|---|---|
| Win rate | 58% | 49% |
| Avg R:R | 1.6:1 | 1.4:1 |
| Sharpe ratio | 1.4 | 0.7 |
| Max drawdown | 18% | 27% |
| Verdict | Passes screening | Below threshold |
Market Regimes and Strategy Durability
One area that most algorithmic trading guides skip: a strategy’s performance depends on the market regime it was built in.
I re-ran the EMA crossover (9/21) system I originally backtested on 2018-2021 BTC data using data from 2022 through 2025. Win rate dropped from 54% to 49%, and maximum drawdown increased substantially. The high-inflation, rising-rate environment that began in 2022 produced a different regime for momentum strategies than the low-rate bull cycle that preceded it.
Most strategy guides published before this regime shift are implicitly environment-specific. Quantitative setups that performed cleanly during low-volatility trending conditions often behave differently when the macro backdrop changes. This isn’t a flaw in algorithmic trading. It’s a property of any rule-based approach.
The practical fix is a regime filter: a condition that restricts the strategy to market types where it has a confirmed edge. After adding an ADX threshold to a forex momentum system (no trend entries when ADX reads below 20), drawdown in testing fell by 18% across two years of recent data without a significant drop in win rate. The filter simply kept the system out of ranging conditions where its signals were noise.
For Pine Script implementations, checking ta.adx(14) > 20 before any trend-following entry is a one-line addition that meaningfully improves risk-adjusted return when the primary trend is weak or absent. The AI-assisted trading overview covers additional filtering approaches used in more sophisticated systematic setups.
The broader lesson: backtesting a strategy on a single historical period is a minimum requirement, not a sufficient test. Multiple regime exposures and an explicit regime filter separate a durable system from one that works for 18 months and then degrades when conditions shift.
Platforms and Execution Layer
Platform choice depends on strategy complexity and your preference for visual versus coded interfaces.
TradingView with Pine Script is the most accessible starting point. Built-in data for forex, crypto, equity CFDs, and futures. The Strategy Tester provides immediate results with configurable commission and slippage inputs. For semi-automated execution, TradingView alerts can trigger webhooks to broker APIs, though order management handling requires additional infrastructure.
Python with vectorbt or Backtrader provides more analytical depth. vectorbt runs millions of parameter combinations efficiently, making it practical for systematic parameter sensitivity analysis. Backtrader is more established for event-driven backtesting with detailed order management simulation. Setup overhead is higher, but the output, including detailed trade logs and Monte Carlo distribution, is significantly more informative than TradingView’s built-in tester.
Broker execution quality determines the gap between backtested entries and live fills. Wider spreads, slower responses, and requotes during volatile sessions all compress real returns compared to simulation. I tested cTrader API latency across several retail-accessible platforms before using IC Markets for live forward-testing of systematic signals. Their Frankfurt server latency averaged 80ms, the most consistent fill quality I measured among the platforms I evaluated for algo-compatible execution. The full breakdown of their account types, spreads, and API specifications is in the IC Markets review.
For data quality on the input side, TradingView provides adjusted historical data with dividend handling applied for equity CFDs, eliminating a significant cleaning step. For forex and crypto, data quality across major pairs is reliable enough for daily and 4H backtesting.
Common Mistakes to Avoid
Overfitting to historical data. Optimizing parameters until the backtest looks perfect is curve-fitting, not trading. Each additional rule reduces out-of-sample reliability. The most durable systems I’ve built have three to five conditions, not fifteen.
Testing on a single market environment. Six months of data captures one regime. Trend-following strategies produce strong results in trending conditions and weak results in ranging ones. Include at least one regime transition in your test period to get a representative picture.
Ignoring transaction costs. Spread, commission, and slippage accumulate across hundreds of trades. A system showing 8% monthly return before costs may deliver 4% after realistic execution assumptions. I model slippage at 0.5 pips on major forex pairs and 1 pip on gold for all backtest runs. Not modeling this is one of the most common sources of inflated projected performance.
No position sizing model. Trading fixed lot sizes doesn’t scale and doesn’t protect drawdown. A proper algo system sizes positions based on current account equity and the ATR-based stop distance. Applying consistent percentage risk to every trade is the same approach detailed in RSI-based position sizing and applies equally to any indicator-driven system.
Skipping the forward test phase. Historical data is cleaned and adjusted. Live markets produce gaps, requotes, and spread widening during news events. The forward test period, running the live system at minimal position size before scaling, reveals the execution friction that separates simulation from real trading.
FAQ
What is algorithmic trading in simple terms?
Can a beginner do algorithmic trading?
What is the best platform for algorithmic trading for beginners?
How much money do you need to start algorithmic trading?
Is algorithmic trading profitable?
What is the difference between algorithmic trading and high-frequency trading?
🌍 Our recommended brokers
Reader Reviews
Ran my first proper Pine Script backtest after reading the out-of-sample validation section. Three years of EUR/USD daily data on a dual EMA crossover with an ATR volatility filter came back with Sharpe 1.1 in-sample and 0.74 on the held-out year. The 40% degradation threshold described in the article was exactly what I needed - it gave me a clear decision point rather than an open-ended optimization loop. I kept building, added an ADX regime filter, and the out-of-sample Sharpe moved to 0.91 on the same held-out period. Running the system live at 0.5% risk per trade, the first full month returned 7.3%. The backtesting process described here is the only framework that has helped me distinguish a real edge from a curve-fit.
The walk-forward split section is the most practically useful explanation of in-sample versus out-of-sample testing I have found. Applied it to a Supertrend strategy on gold and rejected two iterations that looked strong on historical data but degraded badly on the verification segment.
The regime filter concept from the ADX section fixed a recurring problem with my trend-following system. I had been trading a 9/21 EMA crossover on EUR/USD without any trending condition check, and losses concentrated in range-bound periods when directional signals were noise. Adding the ADX above 20 requirement reduced my monthly trade count from 14 to 8, but the average monthly return moved from roughly 3% to 6.8% over the next two months. Four stars because the article describes the filter clearly but stops short of how to handle borderline ADX readings between 18 and 23 where the regime boundary is ambiguous.
I spent four months developing a mean reversion system on EUR/USD before reading this article and came close to deploying it live. The out-of-sample check described here stopped me from making that mistake. My system showed a 64% win rate and Sharpe of 1.3 on three years of data. On the held-out year it came back at 51% win rate and Sharpe 0.6 - exactly the kind of degradation that signals overfitting. I rebuilt the rule set down to three conditions from eight, ran the split again, and the out-of-sample Sharpe came to 0.87. Monthly returns over the first two live months averaged 6.9% on major forex pairs, which matched what I had projected from the validated backtest.
The section on win rate paired with R:R ratio resolved a confusion I had been carrying for two years. I was tracking only win rate and had no way to evaluate whether a 60% win rate system was actually outperforming a 40% system with better reward-to-risk. Rebuilding my trade log to track both showed that my highest win rate system was my lowest-return system, and the setup I had nearly abandoned at 43% win rate was returning 7.1% monthly at a 3:1 ratio. Four stars because I wanted a deeper treatment of how to adjust position sizing when R:R shifts between setups.
The forward test minimum of 30 live trades before scaling is the most important constraint in this article. I had been deploying systems after 10-15 live setups and wondering why results diverged from backtests. The gap between simulated slippage and real execution fills shows up reliably by trade 18-20 in my experience.
The comparison between Pine Script and vectorbt is the most practical platform breakdown I have found. I built the same EMA crossover system in both environments and the vectorbt parameter sensitivity scan across 200 combinations took under three minutes - the equivalent in Pine Script would have required manual iteration. Once a system passes initial screening I now prototype in Pine Script and port to Python for rigorous walk-forward testing, exactly as the article suggests. The process cut my strategy development cycle by roughly half and improved the quality of the systems I actually forward-test.
The EMA crossover walk-forward test described in the backtesting section matches an experience I had on GBP/USD almost exactly. In-sample Sharpe at 1.4, out-of-sample Sharpe at 0.7, win rate falling from 58% to 49% on the verification segment. At the time I had no framework for interpreting that degradation and kept optimizing the system trying to recover the in-sample result. The explanation that the gap signals overfitting rather than calling for more optimization was what I needed to hear. I reduced the rule count from nine conditions to four, ran the walk-forward again, and out-of-sample Sharpe moved to 0.83. Live monthly average over three months since has been 7.2%, which aligns with the framework.
Leave a Review

Quant Researcher & Systems Builder
Quantitative researcher who builds the automated systems behind Arxum strategy testing. Works in Python and Pine Script, using AI alongside classic backtesting to validate strategies on years of real data.