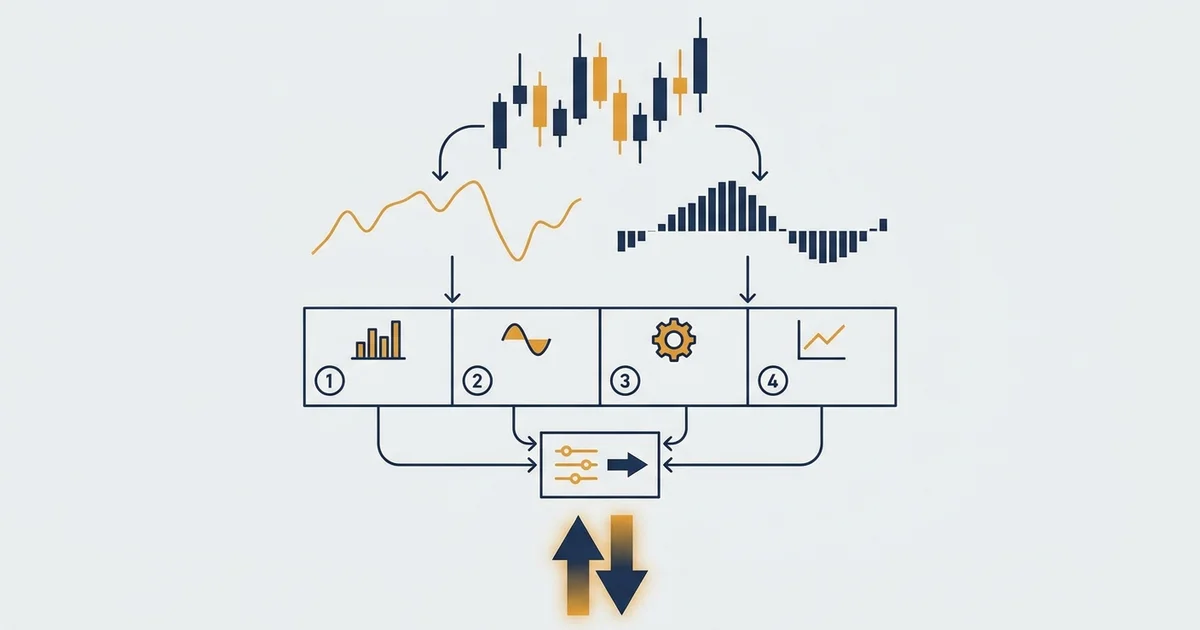

What machine learning trading actually is
Most retail trading is a story. You see a setup, you feel it, you click.
It swaps the feeling for a colder question. Across thousands of past bars, which mix of readings actually came before the move you wanted?
Here is what that question looks like on spot gold (XAU/USD).
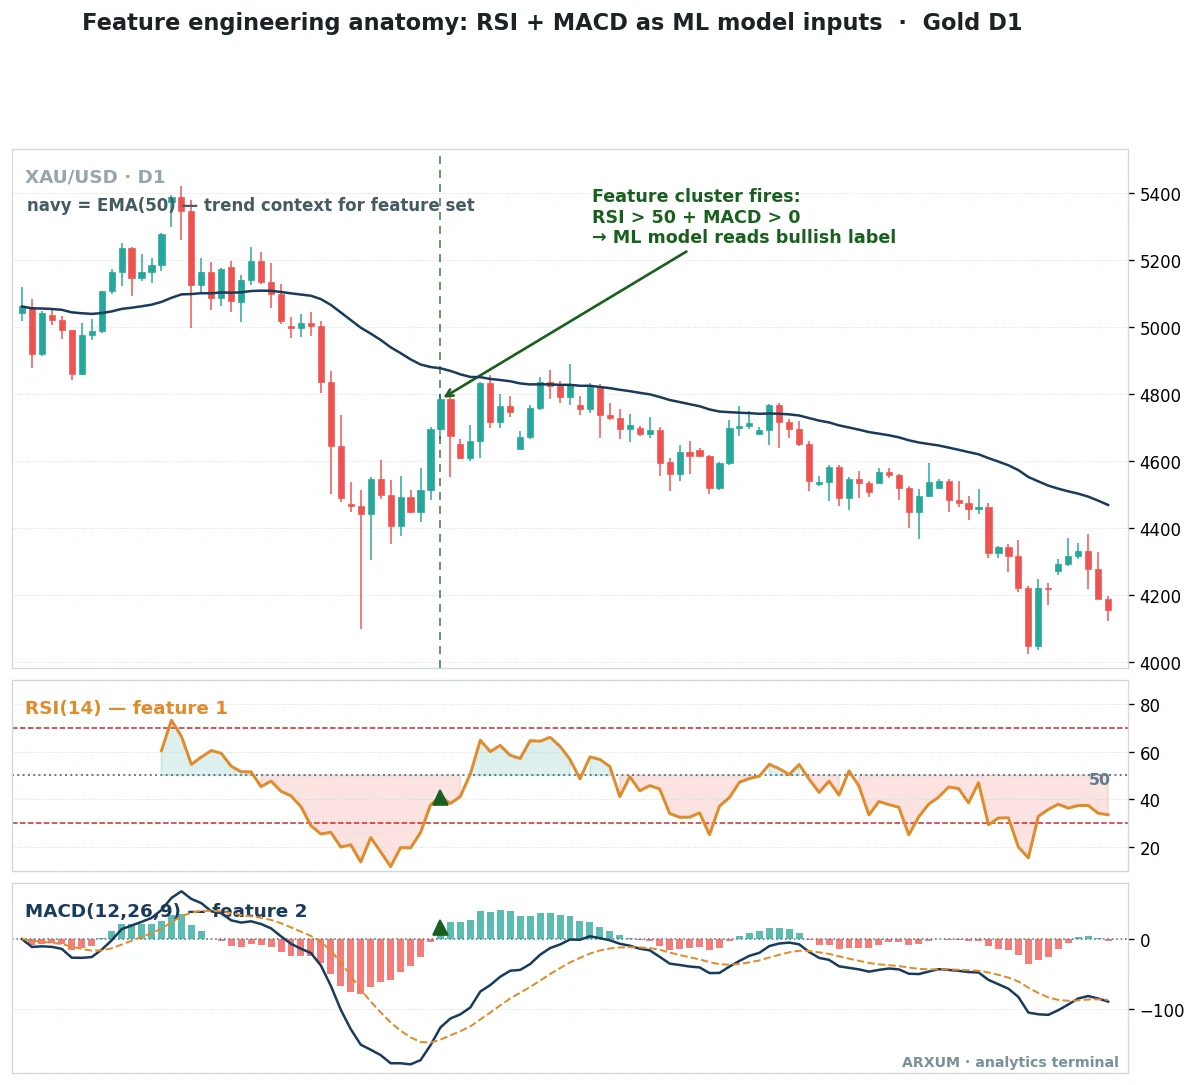
The picture holds four words that carry the whole idea:
- Feature. A raw reading turned into a number the model can weigh, like RSI at 58, MACD above zero, or price sitting 1.2% above its average.
- Label. The answer the model is trained to predict, usually did the next bar close up or down.
- Training. Showing the model thousands of past pairs of features and their label, so it learns which combinations tend to precede which move.
- The model. Not a new indicator. A weighting machine that decides how much each feature should count.
How to read it in one line: the model never sees candles. It sees a row of numbers per bar and guesses the label.
That is the whole trick, and it is far less glamorous than the thumbnails suggest. A machine learning model in trading is mostly a careful way of asking old indicators a new question.
How price becomes features (the real work)
Ninety percent of the job is not the model. It is feature engineering, turning raw price and volume into clean numbers that carry information.
Get this wrong and the fanciest model on earth learns nothing.
| Raw input | Feature the model reads | What it tells the model |
|---|---|---|
| Momentum | RSI(14), rate of change | Is the push stretched or still building |
| Trend | MACD, the gap between two EMAs | Which way price is drifting, and how hard |
| Stretch | Bollinger z-score | How far price sits from its average, in σ |
| Volatility | ATR, rolling standard deviation | How wide the swings are right now |
| Location | Price versus the 200 EMA | Which side of the long trend price is on |
| Time | Hour of day, trading session | When in the day the bar printed |
Two of those readings, RSI and MACD, are the ones in the gold chart above. If you want the tools themselves before you turn them into features, our RSI guide and MACD guide cover each one plainly.
A few rules decide whether a feature helps or just adds noise:
- Only use past data. A feature that quietly peeks at the current or future bar looks brilliant in testing and dies live. This is look-ahead bias, and it is the single most common way beginners fool themselves.
- Do not stack near-copies. RSI, Stochastic and Williams %R mostly say the same thing. Feeding all three tells the model one idea three times and drowns the rest.
- Scale everything. A price of 4,700 and an RSI of 58 live on wildly different scales. Most models need features squeezed onto a comparable range first.
- Fewer is safer. Five clean features usually beat fifty noisy ones. Each extra input is another chance to fit history that will never repeat.
The bottom line: the model is the easy part. The edge, if there is one, lives in the features and in the honesty of how they were built.
The three model families you will actually meet
Almost every retail machine learning model in trading does one of three jobs. Each bets on a different market behaviour, and each reads cleanest on a different kind of chart.
1. Classification: guess the next direction
A classifier answers a yes or no question. Will the next bar, or the next few, close higher or lower?
It takes momentum features and outputs a label, up or down, often with a probability attached.
The gold chart at the top of this page is a textbook classifier setup. RSI and MACD readings become features, and when both point the same way the model leans bullish.
Our momentum trading guide covers the raw signals underneath it.
How it looks in practice:
- The inputs are momentum readings: RSI, MACD, rate of change, distance from a moving average.
- The output is a class, up or down, not a price target.
- A probability near 50% means the model has no opinion, which is a signal in itself: stand aside.
This family is where the phrase machine learning stock trading usually shows up, because stock indices and single names carry clean daily data that classifiers like.
| Role | How you use it | Best TF / instrument |
|---|---|---|
| Directional bias | Trade only in the model's predicted direction | Gold D1, index CFDs D1 |
| Trade filter | Skip setups the model labels the opposite way | Any manual system, H4 and up |
| Confidence gate | Take only labels above a set probability | Stocks, gold, slower charts |
| Confirmation | Pair the label with a chart trigger you already trust | Gold, EUR/USD D1 |
Where it breaks: thin data. A classifier needs thousands of clean examples, and on a fast intraday chart with a handful of real setups it learns noise and calls it an edge.
2. Trend-direction models
The second family does not predict a turn. It reads the current drift and stays with it until the drift changes.
The classic feature is a crossover of a fast and a slow moving average, and it reads cleanest on the slower Forex charts.
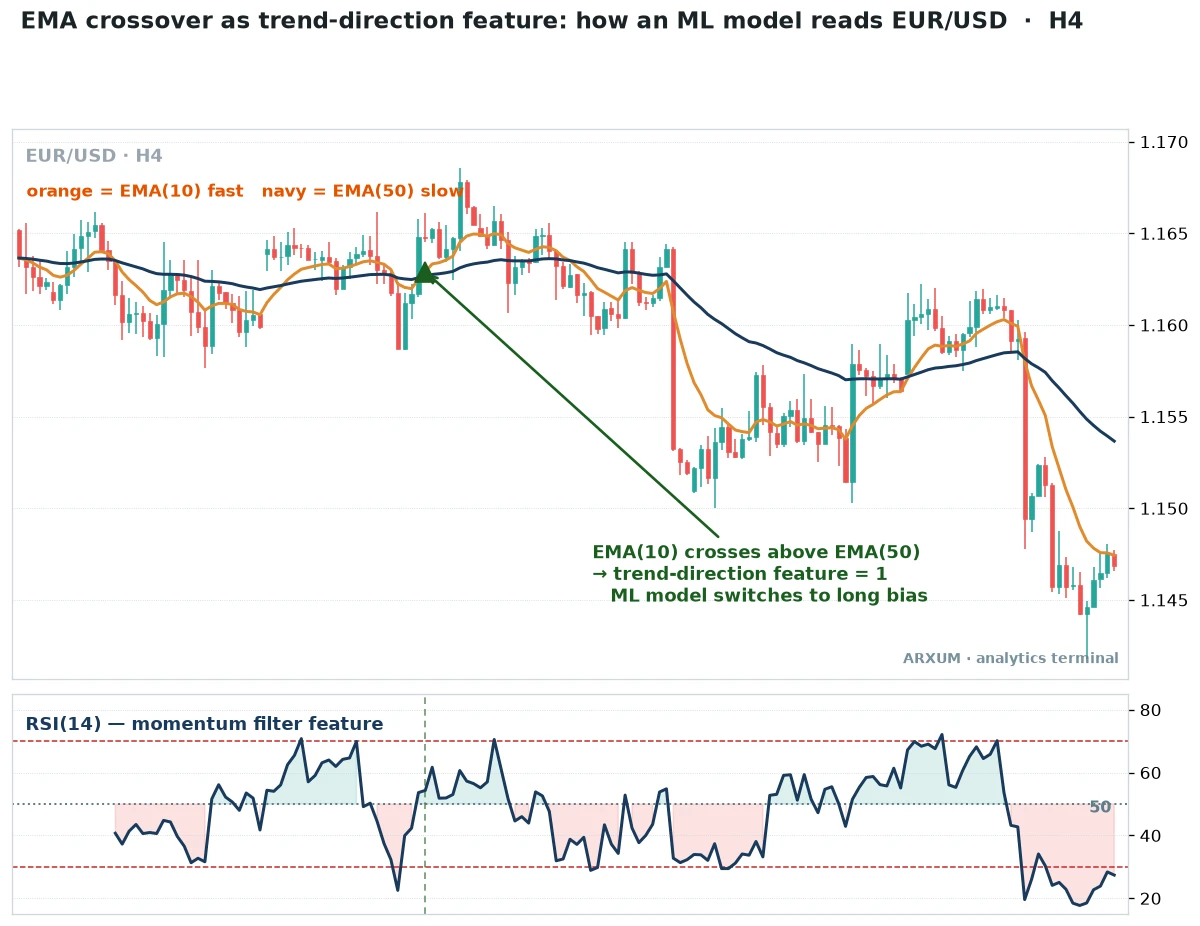
Reading the chart:
- Fast versus slow EMA. The EMA(10) reacts quickly, the EMA(50) slowly. When the fast line pulls above the slow one, the short-term drift has turned up. Our EMA guide explains the tool itself.
- The cross is the feature. The model reads it as a single number: 1 for up-drift, 0 for down. The wider the gap between the lines, the stronger the trend.
- RSI as a filter feature. The lower panel is not a signal here. It is a gate. A cross that fires while RSI sits limp near the midline gets ignored.
| Role | How you use it | Best TF / instrument |
|---|---|---|
| Trend feature | Feed the fast-over-slow state as a 1 or 0 input | EUR/USD H4, gold D1 |
| Regime read | Price above both EMAs is an up regime, below both is down | All markets, D1 |
| Filter | Take signals only in the direction of the slow EMA slope | H4 signal, D1 context |
| Exit cue | Flatten on the opposite cross or a close back through the slow EMA | Trending Forex, gold |
Where it breaks: a sideways market. The two lines tangle and cross over and over, and the model gets chopped up waiting for a trend that never arrives.
3. Mean-reversion models
The third family bets the other way. Instead of joining a move, it fades a stretch, betting that a market pulled far from its average snaps back.
The natural feature is a z-score, and Bitcoin gives a clean example.
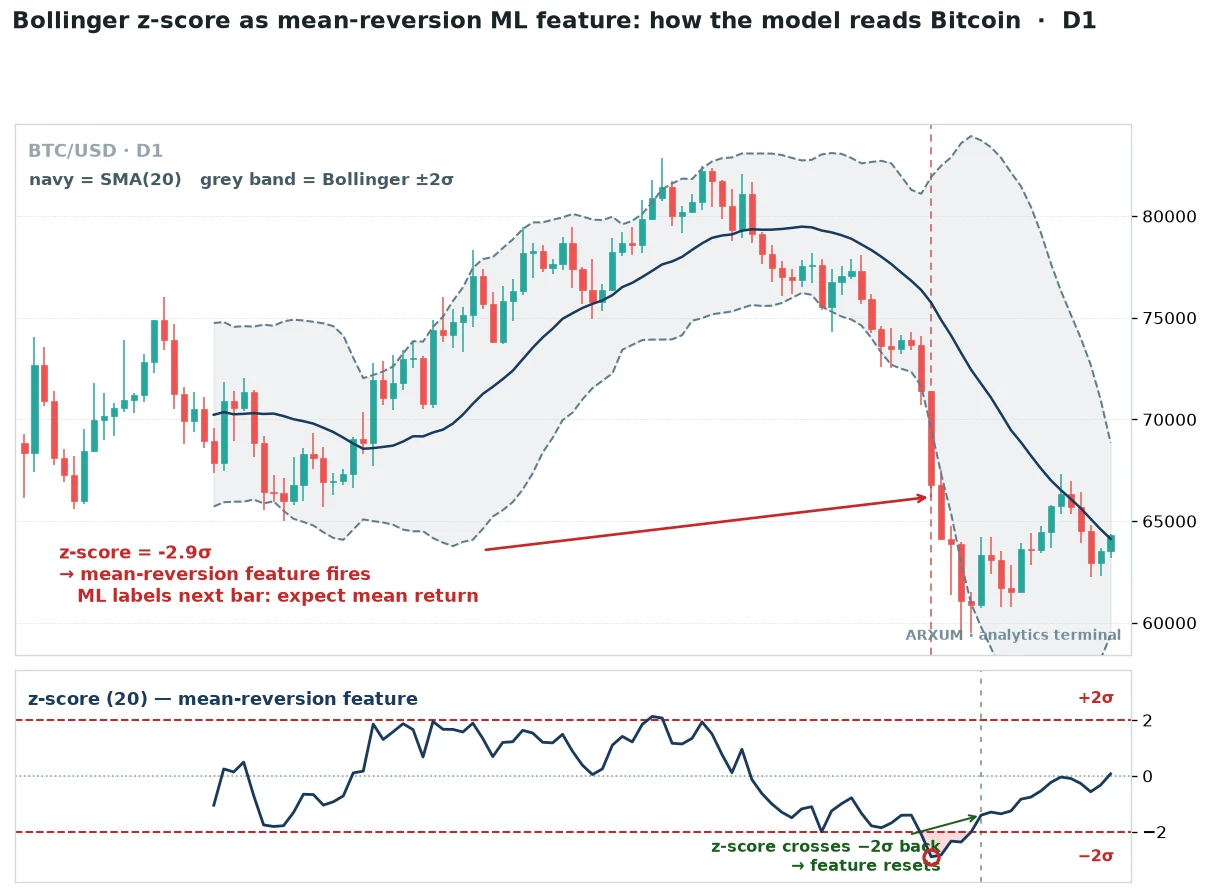
Reading the chart:
- Standard deviation (σ). A measure of how far price normally swings. One σ is a normal-sized move, three σ is a rare stretch.
- The z-score. Price distance from the average, counted in σ. A z-score of zero sits on the average, minus two is unusually low, minus three is very unusually low.
- The Bollinger band. The average plus and minus two σ, drawn on the price panel so you can see the stretch without the extra window. Our Bollinger Bands guide and the wider mean-reversion guide go deeper.
| Role | How you use it | Best TF / instrument |
|---|---|---|
| Stretch feature | Feed the z-score straight in, buy deep negatives, sell deep positives | BTC D1, gold D1 |
| Context filter | Only fade when the higher timeframe is ranging, not trending | D1 regime over an H4 signal |
| Exit cue | Close as the z-score climbs back toward zero | Quiet, range-bound markets |
| Confirming tool | Pair the extreme with a reversal candle for a cleaner entry | Gold, silver D1 |
Where it breaks: a strong trend. In a one-way market the z-score rides the extreme for weeks, and fading it just hands the model a string of losses.
Which family fits which market
The three families are not rivals. Each is built for a different market mood, and a big part of the work is matching the model to the conditions before you trust its output.
| If the market is | Use this family | Why | Good example |
|---|---|---|---|
| Trending steadily | Trend-direction | Rides the whole leg and ignores the noise | EUR/USD H4 |
| Quiet and ranging | Mean-reversion | Price keeps snapping back to the average | Bitcoin D1 in a range |
| Clean and data-rich | Classification | Enough examples for a label to mean something | Gold D1, index CFDs |
| Choppy, no direction | None, stand aside | Every model whipsaws in a directionless market | Any pair in a tight range |
Rule of thumb: the same market flips between these moods over time. The most useful machine learning setups run a regime feature first, decide the mood, then pick the family that fits it.
Machine learning vs algorithmic vs rule-based trading
These three terms get used as if they mean the same thing. They overlap, but they answer different questions.
| Question | Rule-based | Algorithmic | Machine learning |
|---|---|---|---|
| Who sets the weights | You do, by hand | You do, in code | The model learns them |
| Built from | A fixed if-then rule | Any rule, run automatically | Features and past labels |
| Adapts on its own | No | No | Within limits, if retrained |
| Main risk | Too rigid | Bad rule, fast | Overfitting history |
The short version:
- Rule-based is you deciding “buy when RSI drops below 30.”
- Algorithmic is the same rule, executed by code so you do not sit and watch. Our algorithmic trading guide covers that execution side.
- Machine learning hands the weighting to a model instead of picking the 30 yourself.
Most machine learning strategies are run as algos, and plenty of algos carry no learning at all. It is worth keeping them apart, because the AI tools sold to retail traders blur the line hard.
If you are weighing those, our review of AI trading bots is the honest starting point.
The Python toolkit for machine learning models
You do not need a finance degree, but you do need to read and write a little Python. It is the standard because the data and model libraries are free and everywhere.
A working kit for a python trading bot is small.
| Library | Its job | You use it for |
|---|---|---|
| pandas | Data handling | Loading and cleaning the price series |
| NumPy | Fast math | Vectorised feature calculations |
| pandas-ta / TA-Lib | Indicators | Building RSI, MACD and z-score features |
| scikit-learn | Machine learning | Training classifiers and splitting data |
| vectorbt / backtrader | Backtesting | Running the model across history |
| Matplotlib | Charts | Plotting features and the equity curve |
Start with the first four. pandas, NumPy, an indicator library and scikit-learn are enough to build and test every model in this guide. The learning tools you hear about, random forests and gradient boosting, are single lines of scikit-learn once the features are clean.
That is the part beginners get backwards: the algorithm is the quick bit, the data prep is the slog.
For anyone coming from the pure code side, algo trading python is really the same toolkit with the model swapped in where a fixed rule used to be. The plumbing does not change.
Why most machine learning trading models fail
This is the part the courses skip, and it is the part that matters most. A model that looks perfect on history is the default outcome, not the win.
Most retail models fail for a short list of reasons, and every one is avoidable.
- Overfitting. With enough features and tuning, a model memorises the exact past instead of learning a general pattern. It scores beautifully on the data it was built on and falls apart on anything new.
- Look-ahead bias. A feature accidentally uses information that was not available yet at that bar. The backtest glows, live results collapse, and it takes weeks to notice why.
- Data snooping. Try two hundred model variants and one will look great by pure luck. Picking that one and calling it an edge is testing yourself, not the market.
- Regime change. Markets are not stationary. A model trained on a calm trending stretch can be useless the moment volatility or the macro backdrop shifts. See what that damage looks like in our drawdown explainer.
- Costs eat the edge. Spreads, slippage and fees are small per trade and lethal over thousands. A model that ignores them prints paper money.
- The signal is tiny. Price is mostly noise. Even a good model is right a little more than half the time, not most of the time. Anyone promising 90% accuracy is selling something.
The one defence that works: test on data the model never saw while it was built, an out-of-sample slice. Our backtesting guide walks the honest version.
An edge that cannot survive unseen data was never an edge.
How to use machine learning for trading, step by step
You do not need a lab or a physics PhD. Your first ML trading strategy should do one job on one market, and the discipline to check it honestly matters more than the model. A sane first path:
- Pick one market and one job. A direction classifier on gold D1, or a trend feature on EUR/USD H4. Narrow beats clever every time.
- Define the label first. Decide exactly what you are predicting, for example “does the close in three days beat today’s close.” A fuzzy label makes a useless model.
- Build five clean features. Momentum, trend, stretch, volatility, location. Resist the urge to add more.
- Split the data properly. Train on the older slice, test on the newer slice the model never saw. Never shuffle time series randomly.
- Size small and fixed. A common cap is risking about 2% of the account per trade, so no losing streak wrecks you. Turn that risk budget into a position size with our position sizing guide, and know your per-trade math from the risk-to-reward guide.
- Paper trade, then go live tiny. Confirm the live fills and costs match the test before you scale a cent.
Two honest warnings before you commit money:
- A simpler model that you understand beats a complex one you do not. When a black box loses, and it will, you need to know whether to trust it or kill it.
- No edge lasts forever. Retrain on a schedule, watch for the edge fading, and be ready to retire a model when the market moves on. There is no holy grail here, only a small edge repeated with discipline.
What works, in three lines
- The features are the edge, not the algorithm. Clean, past-only, non-redundant inputs decide everything downstream.
- Validate out-of-sample or do not trade it. A model that cannot survive unseen data is a curve-fit, not a strategy.
- Match the model to the mood. Trend-direction in a trend, mean-reversion in a range, classification where the data is deep and clean.
FAQ
What is machine learning trading, in plain terms?
Machine learning trading is trading where a model learns to weight signals instead of a person hard-coding one fixed rule. You turn indicators like RSI, MACD and a Bollinger z-score into numbers called features, show the model thousands of past examples paired with what happened next, and it learns which combinations tend to come before an up move or a down one. The output is a label or a probability, not a prediction of the exact price. It is far less magical than it sounds, mostly a careful way of asking familiar indicators a new question.
How do you use machine learning for trading?
Pick one market and one clear job, like predicting whether gold closes higher in three days. Turn price into a handful of clean features using only past data, label each past bar with what actually happened, then train a model on the older slice of history and test it on a newer slice it never saw. Size trades by a small fixed risk, paper trade the result, and only then go live with tiny size. The discipline of validation and risk sizing matters far more than which algorithm you choose.
Does machine learning trading actually work for retail traders?
It can, within tight limits. Retail traders cannot compete on speed, so high-frequency machine learning is off the table. Slower models on daily and 4-hour charts are genuinely accessible, but the edge is usually small, price is mostly noise, and most models fail from overfitting or look-ahead bias rather than a bad algorithm. Treat any promise of high accuracy as a warning sign. A simple, well-validated model beats a complex black box almost every time.
What is feature engineering in machine learning trading?
Feature engineering is turning raw price and volume into clean numbers, called features, that carry information a model can weigh. An RSI value, a MACD reading, a Bollinger z-score and the distance from the 200-period average are all features. This is where most of the real work and most of the real edge lives. The rules that matter: only use data available at that bar, avoid stacking near-identical indicators, scale everything onto a comparable range, and keep the feature list short.
What is the difference between machine learning and algorithmic trading?
Algorithmic trading is executing any rule automatically with code, and that rule can be simple with no learning behind it. Machine learning trading hands the weighting of the signals to a model that learns from past data, rather than you picking the thresholds by hand. Most machine learning strategies are run as algos, but plenty of algos carry no learning at all. One is about how you execute, the other about how the decision gets made.
What is the best programming language for machine learning trading?
Python, by a wide margin. Its libraries cover the whole job and are free: pandas and NumPy for data, pandas-ta or TA-Lib for indicators, scikit-learn for the models, and vectorbt or backtrader for testing. C++ appears at high-frequency firms where raw speed rules, and R shows up in academic statistics, but Python is the standard place for a retail trader to start and to stay.
Can machine learning predict the stock market?
Not the way people hope. No model reliably predicts exact prices, because markets are noisy and adapt to any edge that gets crowded. What machine learning can sometimes do is tilt the odds slightly, labelling the next move as a little more likely up than down. That small, honest edge, repeated with strict risk control, is the realistic goal. Anyone claiming a model that predicts the market with high accuracy is describing an overfit backtest, not live results.
How much data do you need for a machine learning trading model?
Enough clean examples that the model learns a pattern rather than memorising history, which usually means thousands of bars. That is why daily and 4-hour charts on liquid markets like gold, EUR/USD and Bitcoin suit retail machine learning better than a fast intraday chart with only a handful of real setups. Deep, clean, gap-free data matters more than a long history full of errors, and bad data quietly ruins every result downstream.
Why do most machine learning trading models fail?
Overfitting is the number one killer: a model with too many features memorises the past and falls apart live. Close behind are look-ahead bias, where a feature peeks at data it should not have, and data snooping, where testing hundreds of variants throws up one that looks great by luck. Regime change, trading costs and the tiny signal-to-noise ratio of price finish the job. The single defence that works is honest out-of-sample testing on data the model never saw.
What are the key machine learning trading terms?
Feature: a raw reading turned into a number the model weighs. Label: the answer the model is trained to predict, such as up or down. Training: showing the model past features and their labels so it learns. Overfitting: tuning a model so tightly to history that it fails live. Look-ahead bias: a feature using information not available yet. Out-of-sample: testing on data the model never saw. Classification: predicting a category like direction rather than an exact price.
Real-time trade setups with entry, stop loss and take profit. Daily market analysis. No subscription, no complicated theory.
🌍 Our recommended brokers


Reader Reviews
Be the first to review this — tell other traders what actually helped, or where it fell short.
Leave a Review

Quant Researcher & Systems Builder
Quantitative researcher who builds the automated systems behind Arxum strategy testing. Works in Python and Pine Script, using AI alongside classic backtesting to validate strategies on years of real data.
