
What quantitative trading actually is
Most retail trading is a story. You see a chart, you feel a setup, you click.
Quantitative trading throws the story out and asks a colder question. Over hundreds of past cases, did this exact rule make money, and how badly did it hurt along the way?
The job splits into five plain habits:
- It turns price into a number. A raw candle becomes a signal you can measure, like how many standard deviations price sits from its average.
- It writes a rule, not a hunch. Every entry and exit is spelled out so precisely that a computer can follow it with no judgement calls.
- It tests before it trades. The rule runs across years of history first. See our guide to backtesting a strategy for how that step works.
- It sizes by risk, not conviction. Position size comes from a fixed risk budget, covered in position sizing, never from how sure you feel.
- It automates the boring part. Once the rule is validated, code watches the market and places the orders without you.
The bottom line: a quant does not predict the future. A quant finds a small statistical edge and repeats it enough times that the math wins.
What a quantitative model actually looks like
Here is a quant model reading spot gold (XAU/USD). It is a mean-reversion system, one of the three families below, and it shows the core trick in a single picture.
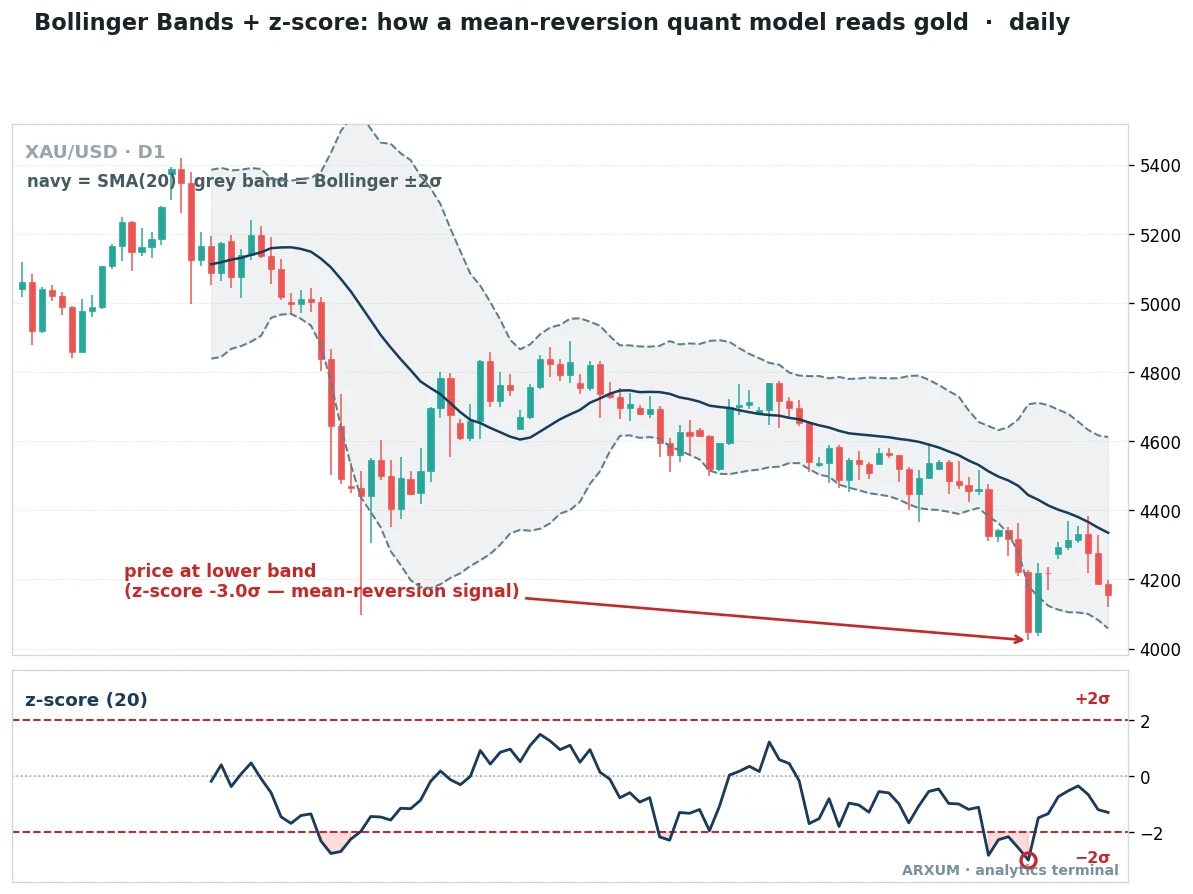
Read the picture with three plain definitions:
- The average (navy line). The 20-day simple moving average, the market’s recent centre of gravity. Price tends to wander away from it and then drift back.
- Standard deviation (written σ on charts). A measure of how far price normally swings. One standard deviation is a normal-sized move, three is a rare stretch.
- The z-score (lower panel). Price distance from the average, counted in standard deviations. A z-score of zero means price sits on its average, minus two means it is unusually low, minus three means very unusually low.
- The Bollinger band (grey). The average plus and minus two standard deviations, drawn on the price panel so you can see the stretch without the extra window.
How to read it in one line: when the z-score dives toward the bottom, the market is stretched thin and a mean-reversion model bets it snaps back toward the average.
The quantitative research workflow
A quant does not start with a chart. They start with a question, then run it through the same loop every time:
- Hypothesis. Write down a specific, testable idea. “Gold snaps back after a three-sigma drop on the daily” is testable. “Gold looks weak” is not.
- Data. Gather clean historical price. Bad data (gaps, spikes, wrong prices) quietly ruins every result that follows.
- Signal. Turn the idea into an exact math rule with numbers, so the same input always gives the same output.
- Backtest. Run the rule across years of history and see how it would have done. This is where most pretty ideas quietly die.
- Validation. Test it on a slice of data the model never saw while it was being built. An edge that only works on the data it was tuned to is a mirage.
- Risk sizing. Decide how much of the account each trade risks before the first live order, usually a small fixed percent.
- Paper, then live small. Trade it on a demo, then with tiny size, and check the live behaviour matches the test.
- Monitor. Watch for the edge fading. Markets change, and no rule prints money forever.
The single most important step is number five. Skipping out-of-sample validation is how a quant fools themselves into trading a curve-fit that never had an edge.
The quantitative analysis that separates edge from luck
Two strategies can both look green on a chart while one is far safer to trade. Quantitative analysis in finance is mostly about measuring that difference. These are the metrics a quant lives by:
| Metric | What it measures, in plain words | Rule of thumb |
|---|---|---|
| Sharpe ratio | Return earned per unit of total price swing | Above 1 is acceptable, above 2 is strong |
| Sortino ratio | Return per unit of downside swing only | Higher is better, ignores upside jumps |
| Max drawdown | Worst drop from a peak to the next valley | Smaller is safer, know it before you trade |
| Profit factor | Total wins divided by total losses | Above 1 makes money, 1.5 is healthy |
| Win rate | Share of trades that close in profit | High is nice, not required if wins are big |
| Exposure | How much of the time you hold a position | Less time in market for the same return is better |
A few of these trip up beginners, so read them plainly:
- Sharpe and Sortino both reward smooth returns over jumpy ones. Sortino is the fairer of the two, because it only punishes downside swings, not the big up days you actually want.
- Max drawdown is the number that decides whether you can stick with a strategy. A model that made money but dropped a third of the account along the way will get abandoned in real life. Our explainer on drawdown goes deeper.
- Profit factor is not the same as reward-to-risk. Profit factor grades the whole strategy, while reward-to-risk (the 1:X on a single trade, for example risking $1 to make $2 is 1:2) grades one setup. See the risk-to-reward guide for the per-trade version.
Takeaway: raw return is the least useful number here. A quant judges a strategy by how much pain it took to earn that return.
The three quant trading strategies you will meet
Almost every quant model belongs to one of three families. Each one bets on a different market behaviour, and each one shines on a different kind of chart.
These are the quant trading strategies to know first.
1. Mean-reversion
Mean-reversion bets that a stretched market snaps back toward its average. It looks for price far from the mean, then fades the move.
The gold chart at the top of this page is a textbook mean-reversion model. Our mean-reversion guide and the Bollinger Bands guide cover the setup in depth.
How it looks on a chart:
- Price pokes well outside the Bollinger band while the z-score spikes past two standard deviations.
- The move looks exhausted, a long wick or a climax candle at the extreme.
- The average sits flat, not steeply sloped, which means the market is ranging rather than trending.
| Role | How you use it | Best TF / instrument |
|---|---|---|
| Entry trigger | Buy when the z-score dips past minus 2, sell when it spikes past plus 2 | Gold D1, EUR/USD H4 |
| Context filter | Only fade when the higher timeframe is ranging, not trending | D1 regime over an H4 signal |
| Exit cue | Close as price returns to the average and the z-score falls back to zero | Any quiet, range-bound market |
| Confirming tool | Pair the band touch with a reversal candle for a cleaner entry | Gold, silver D1 |
Where it breaks: a strong trend. In a one-way market price rides the band for weeks, and fading it just hands you a string of losses.
2. Momentum
Momentum is the opposite bet. Instead of fading a move, it joins one that is accelerating.
The tool here is the Rate of Change, which measures how fast price is moving, not just which way. Our momentum trading guide covers the wider family.
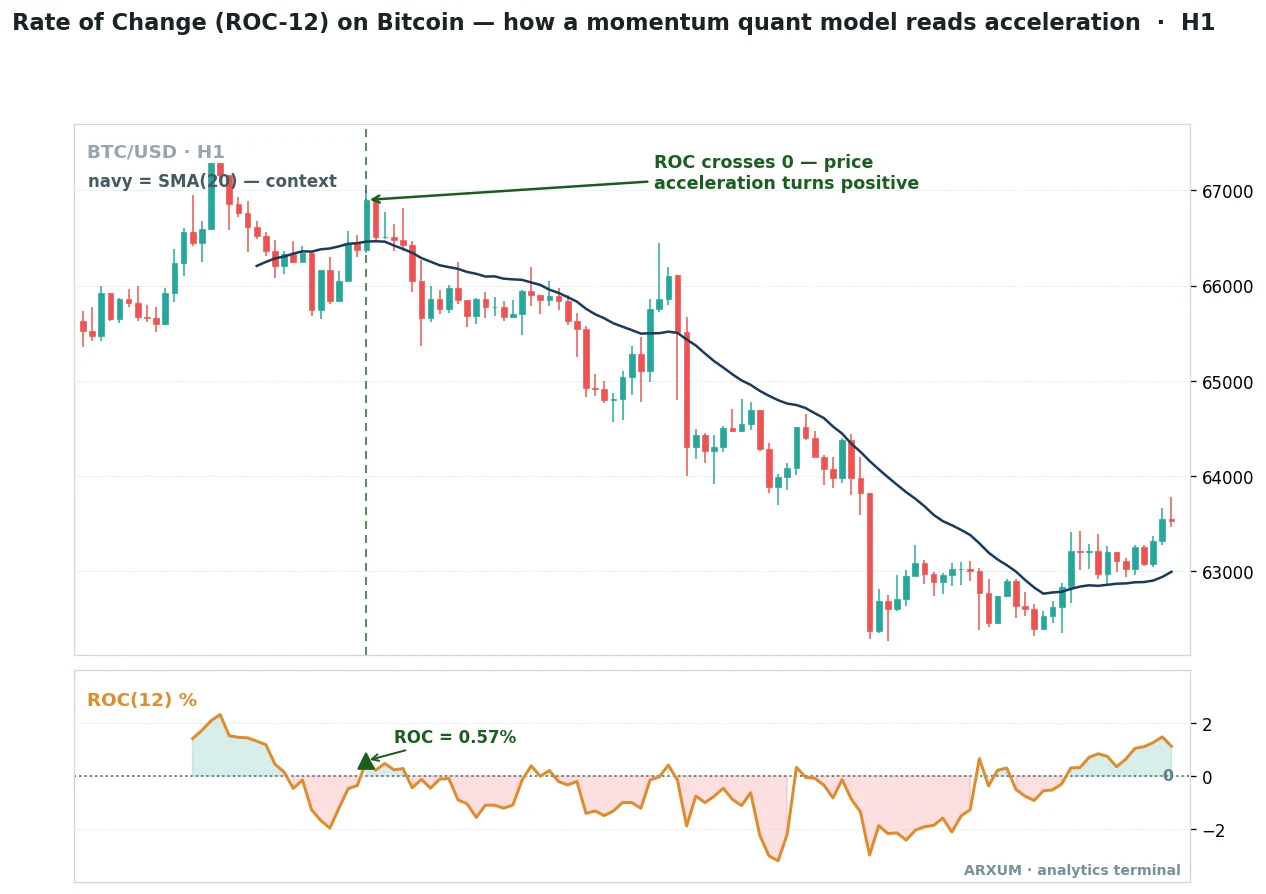
Reading the chart:
- Rate of Change (ROC). The percent change in price over a set number of bars. Above zero means price is higher than it was N bars ago, so momentum is positive.
- The zero cross. ROC crossing up through zero is the signal. It says the recent drift has flipped from down to up.
- The dashed vertical line ties the price bar, the average and the ROC cross to one instant, so you see the signal fire in sync.
| Role | How you use it | Best TF / instrument |
|---|---|---|
| Entry trigger | Buy when ROC crosses above zero, sell when it crosses below | BTC H1, gold H4 |
| Trend determination | ROC holding above zero means the up move is still intact | Bitcoin, stock indices |
| Second indicator | Confirm a breakout only if ROC is rising into it | Any breakout system |
| Exit cue | Step out when ROC rolls back toward zero and momentum fades | Fast markets, crypto |
Where it breaks: a choppy range. ROC flips back and forth across zero, and each false cross is a small loss.
3. Trend-following
Trend-following ignores exact tops and bottoms and just rides the middle of a move. The classic quant version is a two-average crossover, and it reads cleanest on the slower Forex charts.
Our exponential moving average guide explains the tool itself.
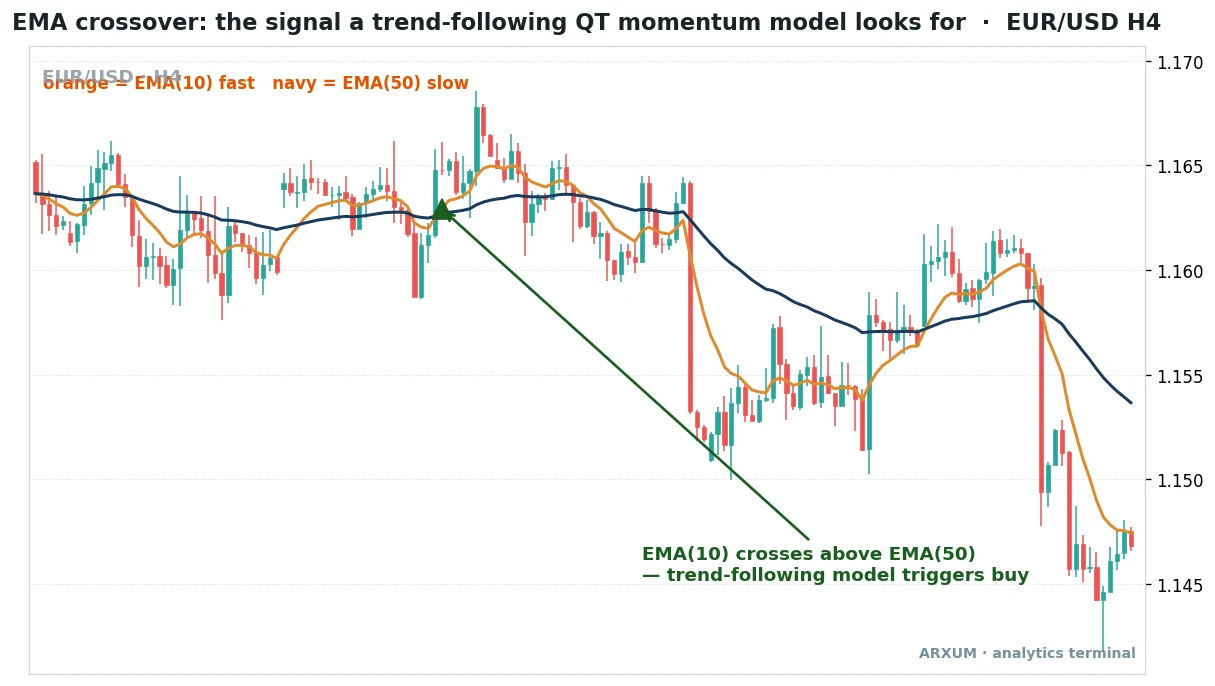
Reading the chart:
- EMA. An exponential moving average, a smoothed line of recent price that weights the latest bars more heavily than old ones.
- Fast versus slow. The EMA(10) reacts quickly, the EMA(50) slowly. When the fast line pulls above the slow line, the short-term drift has turned up.
- The cross is the signal, and the gap between the two lines is a rough gauge of how strong the trend is.
| Role | How you use it | Best TF / instrument |
|---|---|---|
| Entry trigger | Buy the fast-over-slow cross, sell the slow-over-fast cross | EUR/USD H4, gold D1 |
| Trend determination | Price above both EMAs is an up regime, below both is a down regime | All markets, D1 |
| Filter | Take signals only in the direction of the slow EMA slope | H4 signal, D1 filter |
| Exit cue | Exit on the opposite cross or a close back through the slow EMA | Trending Forex, gold |
Where it breaks: a sideways market. The two lines tangle and cross constantly, so a trend-follower gets chopped up waiting for a trend that never arrives.
Which family to use, and when
The families are not rivals. Each one is built for a different market mood, and a big part of quantitative trading is matching the tool to the conditions:
| If the market is | Use this family | Why | Good example |
|---|---|---|---|
| Quiet and ranging | Mean-reversion | Price keeps snapping back to the average | Gold D1 in a range |
| Accelerating hard | Momentum | Catches the burst early, before the crowd | Bitcoin H1 |
| Trending steadily | Trend-following | Rides the whole leg and ignores the noise | EUR/USD H4 |
| Choppy, no direction | None, stand aside | Every model whipsaws in a directionless market | Any pair in a tight range |
Rule of thumb: the same market flips between these moods over time. Serious quants run a filter that first decides the regime, then picks the family that fits it.
Quantitative trading vs algorithmic trading
People use the two terms as if they mean the same thing. They overlap, but they answer different questions:
| Question | Quantitative trading | Algorithmic trading |
|---|---|---|
| Core focus | Is there a real, measurable edge? | How do I execute a rule automatically? |
| Built from | Statistics, probability, data research | Any rule, even a simple one |
| Needs a backtest | Yes, always | Not necessarily |
| The output | A validated statistical model | Automated order flow |
The short version. Quant is about finding an edge with math.
Algo is about executing a rule with code.
Most quant strategies are run as algos, but plenty of algos (a basic moving-average bot) carry no quant research behind them. Our algorithmic trading guide covers the execution side.
The Python toolkit
You do not need a finance degree, but you do need to read and write a little code. Python is the standard because its data tools are free and everywhere. The working kit is small:
| Library | Its job | You use it for |
|---|---|---|
| pandas | Data handling | Loading and cleaning price series |
| NumPy | Fast math | Vectorised signal calculations |
| vectorbt / backtrader | Backtesting | Running a rule across history |
| statsmodels / SciPy | Statistics | Checking whether an edge is real |
| scikit-learn | Machine learning | Optional pattern and forecast models |
| Matplotlib | Charts | Plotting signals and the equity curve |
Start with the first three. pandas, NumPy and a backtesting library are enough to build and validate every strategy in this guide. The rest is optional depth.
How to actually start
You do not need a trading floor or a physics PhD. You need one testable idea and the discipline to check it honestly. A sane first path:
- Pick one family and one market. For example, an EMA crossover on EUR/USD H4. Narrow beats clever.
- Write the exact rules. Entry, exit, and the risk per trade, with real numbers, so a computer could follow it.
- Backtest it, then validate out-of-sample. If it only works on the data you tuned it to, it has no edge.
- Size small and fixed. A common cap is risking about 2% of the account per trade, so no losing streak wrecks you. On a $700 account that is $14 of risk per trade, which you turn into a position size (often micro lots, the smallest 1,000-unit trade size) using our position sizing guide. The Kelly criterion is the more advanced version once you have real numbers.
- Paper trade, then go live tiny. Confirm the live fills and slippage match the test before you scale. Run it on a broker built for automation; our best brokers for algorithmic trading comparison ranks eight on API, latency and cost.
Two honest warnings before you commit money:
- Over-fitting is the number one killer. A model with a dozen tuned settings will look perfect on history and fall apart live. Fewer rules survive better.
- No edge lasts forever. Markets adapt, so expect losing streaks, keep monitoring, and be ready to retire a model when the edge quietly fades. There is no holy grail here, only a small edge repeated with discipline.
What works, in three lines
- Match the model to the mood. Mean-reversion in a range, momentum in an acceleration, trend-following in a steady trend.
- Validate out-of-sample or do not trade it. An edge that cannot survive unseen data is not an edge.
- Judge by drawdown, not by return. The strategy you can actually hold through the pain is the one that pays.
FAQ
What is quantitative trading, in plain terms?
What is the difference between quantitative trading and algorithmic trading?
Do you need a maths degree to trade quantitatively?
Does quantitative trading actually work for retail traders?
How much money do you need to start quantitative trading?
What is the best programming language for quant trading?
Which quant strategy is best for a beginner?
What markets suit quantitative trading?
Is quantitative trading the same as high-frequency trading?
What are the key quantitative trading terms?
Real-time trade setups with entry, stop loss and take profit. Daily market analysis. No subscription, no complicated theory.
🌍 Our recommended brokers


Reader Reviews
Be the first to review this — tell other traders what actually helped, or where it fell short.
Leave a Review

Quant Researcher & Systems Builder
Quantitative researcher who builds the automated systems behind Arxum strategy testing. Works in Python and Pine Script, using AI alongside classic backtesting to validate strategies on years of real data.
