
What a finished Pine Script signal looks like
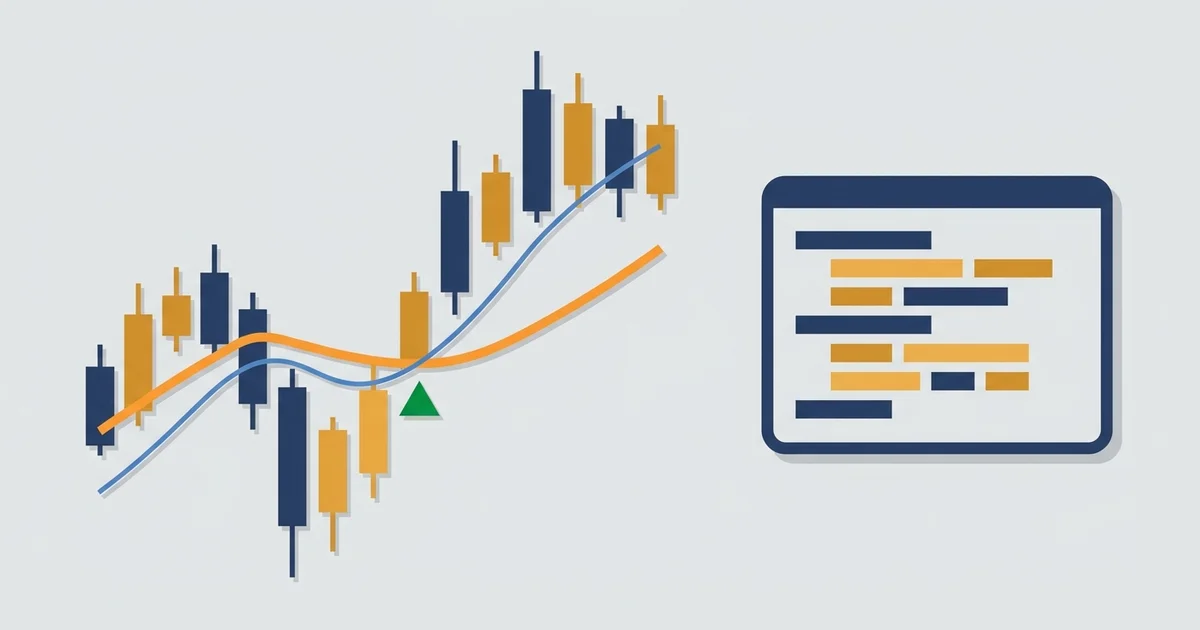
Before any syntax, look at the payoff. A working script watches your rule and marks the exact bar it fires on.
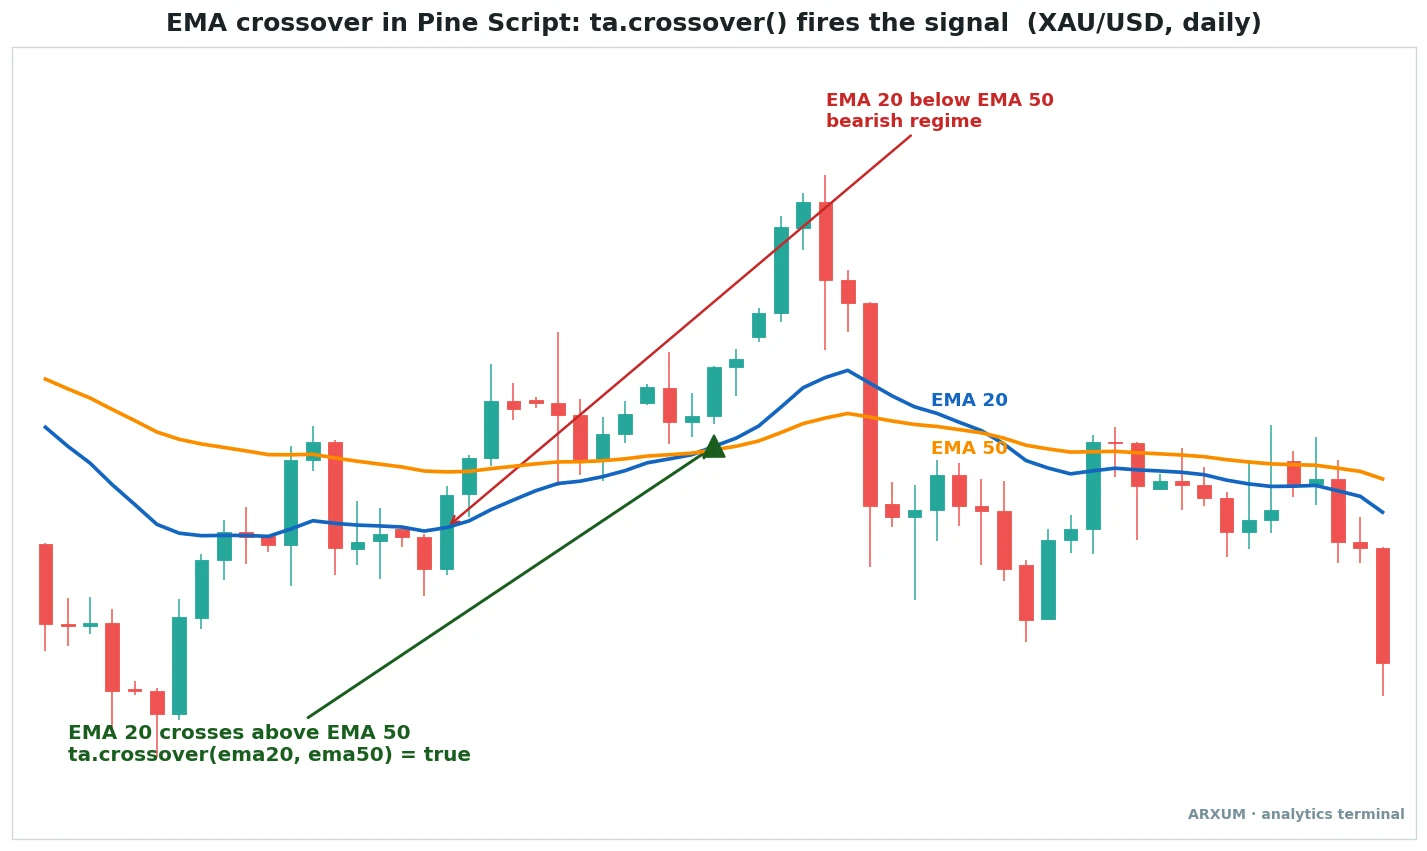
Read that gold chart as three states, left to right.
- The blue EMA 20 crosses up through the orange EMA 50. That single event is
ta.crossover(ema20, ema50), and the green triangle is where the script printed the signal. - While EMA 20 stays above EMA 50, the fast average leads, so the script treats the market as trending up.
- When EMA 20 drops back below EMA 50, the regime flips bearish and a long-only script simply does nothing.
That is the whole appeal. You wrote the rule once, and the script watches every bar for you, on every market, without you staring at the screen.
What TradingView Pine Script is, and why chart traders use it
Most trading languages assume you are a developer. Pine Script assumes you are a trader who wants a custom tool by tonight.
It is built around the chart. A script runs once per bar, reads the values on that bar, and draws or signals from them.
- It lives inside TradingView. No install, no server, no separate app. You open the Pine Editor tab at the bottom of any chart and write there.
- It is free to start. The free plan lets you write, save, and run scripts on your charts, with paid tiers adding more alerts and history.
- The syntax is small. A handful of keywords, a big library of built-in functions, and trading words like
close,highandvolumebaked in. - It ports across markets. The same script runs on gold, a Forex pair, a stock or Bitcoin, because it only reads price and volume.
The one-line version: if you can say the rule out loud, Pine Script is usually a short hop from there to a working alert.
What you can actually build with it
Pine Script covers three jobs. Most traders start with the first and rarely need the third.
| Build type | What it does | Best for |
|---|---|---|
| Custom indicator | Plots a line or shape on the chart | Seeing your own signal live |
| Alert script | Pings your phone when the rule fires | Trading without watching |
| Strategy backtest | Simulates the rule over past bars | Sanity-checking an idea |
The line between them is one keyword, covered further down. For the wider picture of rules-based and automated systems, the algorithmic trading guide sets the context this fits into.
How a Pine Script is put together
Every v5 script has the same four parts, in the same order. Learn these once and you can read most scripts you find online.
| Part | What it is | Example |
|---|---|---|
| Version tag | Tells TradingView which Pine version | //@version=5 |
| Declaration | Names it, sets indicator or strategy | indicator("My Signal") |
| Inputs | Settings you can change in the panel | input.int(20, "EMA length") |
| Logic and plot | The rules, then what to draw or fire | ta.ema(close, 20), plot() |
A few plain notes on that table:
- The version tag is not optional. Leave off
//@version=5and the editor guesses an old version, which changes how functions behave. indicator()versusstrategy()is the single choice that decides whether the script plots or backtests. More on that below.- Inputs are what make a script reusable. Instead of hard-coding 20, an
input.intputs a box in the settings so you change the length without editing code. ta.is the built-in library.ta.ema,ta.rsi,ta.macdand dozens more do the maths, so you never build an indicator from scratch.
The built-ins you will use most
You do not memorise these. You reach for them and check the exact spelling in the editor, which auto-completes as you type.
| Function | What it returns | Typical use |
|---|---|---|
| ta.ema(close, 20) | An exponential moving average | Trend direction |
| ta.sma(close, 50) | A simple moving average | Slower trend line |
| ta.rsi(close, 14) | The RSI, 0 to 100 | Overbought and oversold |
| ta.macd(close, 12, 26, 9) | MACD, signal, histogram | Momentum shifts |
| ta.crossover(a, b) | True the bar a crosses above b | Buy triggers |
| ta.crossunder(a, b) | True the bar a crosses below b | Sell and exit triggers |
| ta.highest(high, 20) | The highest high in 20 bars | Breakout levels |
The two crossover functions matter most. They turn a vague “when the lines cross” into an exact, single bar the script can act on.
Build one in twenty lines
Pine Script for beginners really comes down to this next block. Here is a complete, working Pine Script indicator.
It plots two moving averages and marks a long signal when the fast one crosses up, but only while momentum agrees.
//@version=5
indicator("EMA cross with RSI filter", overlay=true)

fastLen = input.int(20, "Fast EMA")
slowLen = input.int(50, "Slow EMA")
rsiLen  = input.int(14, "RSI length")

emaFast = ta.ema(close, fastLen)
emaSlow = ta.ema(close, slowLen)
rsi     = ta.rsi(close, rsiLen)

plot(emaFast, "Fast EMA", color=color.blue)
plot(emaSlow, "Slow EMA", color=color.orange)

longSignal = ta.crossover(emaFast, emaSlow) and rsi > 50

plotshape(longSignal, "Long", shape.triangleup, location.belowbar, color.green, size=size.small)
alertcondition(longSignal, "Long alert", "Long setup on {{ticker}}")
Read it block by block, and the jargon melts away.
- The version and declaration name the script and set
overlay=trueso it draws on price, not in a panel below. - The three inputs give you settings boxes for the two EMA lengths and the RSI length.
- The
ta.lines compute the fast EMA, the slow EMA and the RSI on every bar. - The two
plotlines draw the blue and orange averages you saw on the gold chart. - The
longSignalline is the whole idea: a fresh cross up, filtered so it only counts when RSI is above the midline. plotshapeandalertconditiondraw the green triangle and let you attach a phone alert to the exact event.
The takeaway: the rule is one readable line. Everything around it is just wiring the inputs, the maths and the output.
Indicator or strategy: the one keyword that changes everything
Swap indicator() for strategy() and the same rules stop drawing and start simulating trades over history. That is how a Pine Script strategy backtests itself.
| Feature | indicator() | strategy() |
|---|---|---|
| Main job | Plot and alert live | Simulate trades on past bars |
| Entries and exits | You trade manually | strategy.entry, strategy.close |
| Output | Lines, shapes, alerts | A Strategy Tester report |
| Costs | Not modelled | Commission and slippage settings |
The strategy version of the same idea is short:
//@version=5
strategy("EMA cross test", overlay=true, commission_type=strategy.commission.percent, commission_value=0.05, slippage=2)

emaFast = ta.ema(close, 20)
emaSlow = ta.ema(close, 50)

if ta.crossover(emaFast, emaSlow)
    strategy.entry("Long", strategy.long)
if ta.crossunder(emaFast, emaSlow)
    strategy.close("Long")
Two honest cautions on the Strategy Tester, because this is where beginners fool themselves.
- Set commission and slippage. The two settings above tell the tester to charge a fee and assume you fill a couple of ticks worse than the ideal price. Leave them at zero and every result flatters you.
- A pretty backtest is not an edge. A rule tuned to look perfect on old bars often falls apart on new ones. The backtesting guide covers why, and how to test honestly.
Pine Script makes it trivial to run a test. It does not make the result trustworthy, and those are very different things.
Two more built-ins worth scripting
The crossover on the gold chart is one built-in. Two others cover most of what retail traders script, and each reads best on a different market and speed.
MACD momentum with ta.macd()
The ta.macd() function returns three values at once: the MACD line, the signal line and the histogram. Most scripts watch the histogram flip across zero.
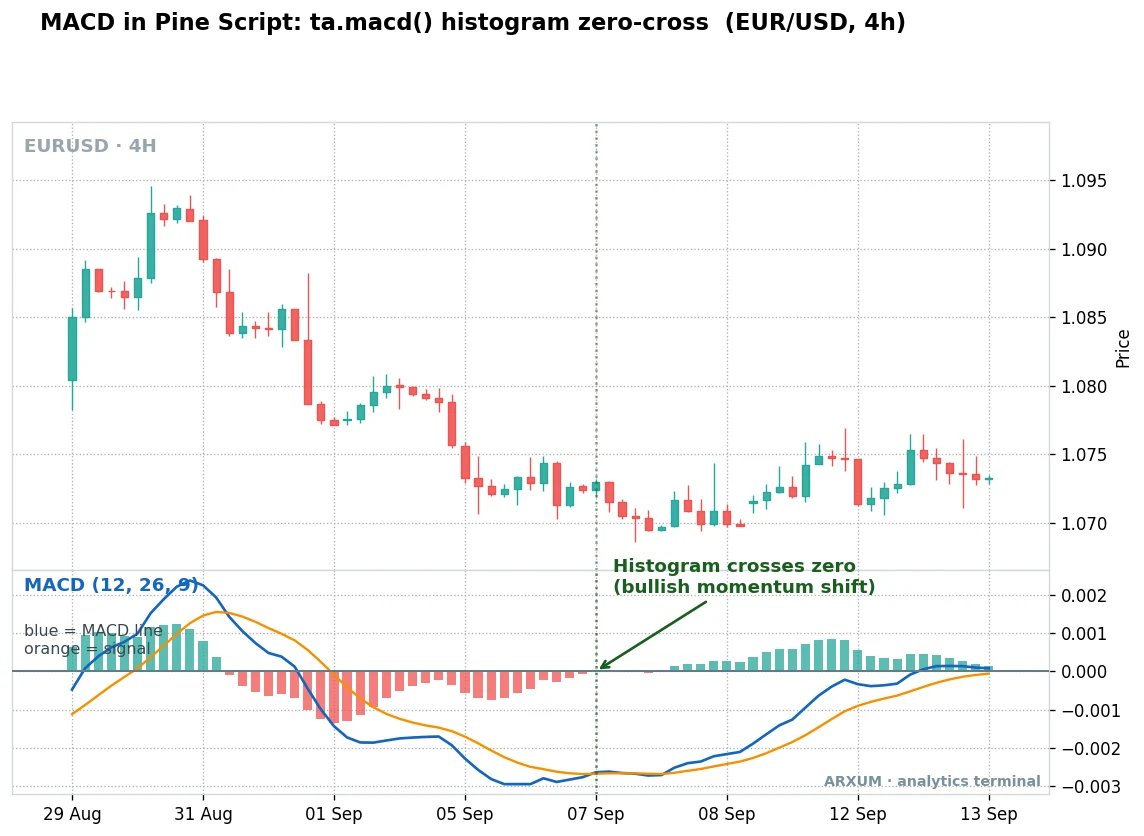
How it looks in a script:
[macdLine, signalLine, hist] = ta.macd(close, 12, 26, 9)hands you all three parts in one line.- Histogram above zero means the MACD line is above its signal line, so momentum leans up.
- Histogram crossing zero, as the dashed line marks, is the moment the balance tips, and the usual trigger.
- A cross while the histogram bars are tiny is weak. The strong shifts come with the bars already growing.
Application table: scripting MACD
| Role | How you use it | Best TF and market |
|---|---|---|
| Momentum trigger | Enter on the zero cross | H4 on EUR/USD, GBP/USD |
| Trend confirm | Take signals that match the trend | D1 on gold and Bitcoin |
| Second gauge | Confirm a price break has push | H1 and H4 on Forex majors |
| Avoid | Skip crosses in a flat range | Quiet mid-week sessions |
For the full mechanics of the indicator itself, the MACD indicator guide breaks down the three lines and their settings.
RSI thresholds with ta.rsi()
ta.rsi(close, 14) returns one number between 0 and 100. Scripts act when it crosses a level you set, usually 70 or 30.
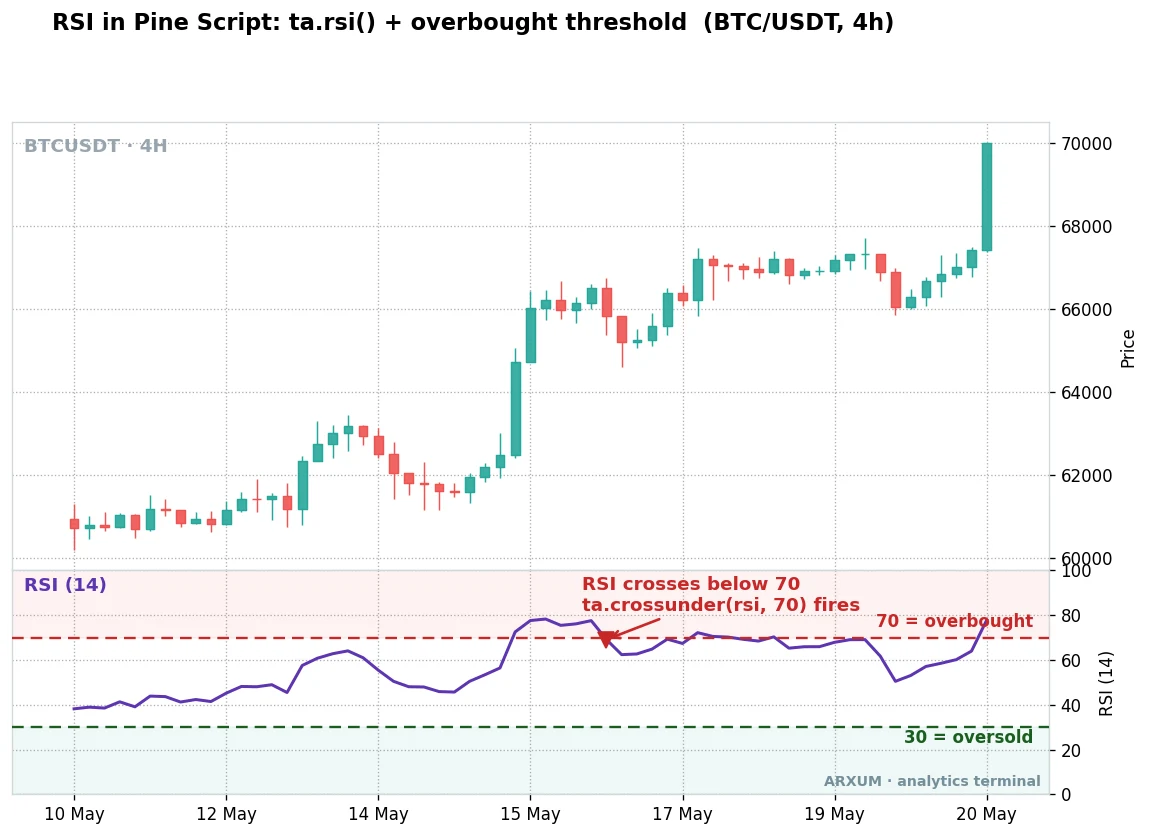
How it looks in a script:
overbought = ta.crossunder(rsi, 70)fires the exact bar RSI falls back under 70, not while it merely sits high.- The two dashed lines are just numbers you chose. 70 and 30 are the common defaults, and you set them as inputs.
- A cross under 70 is a momentum-cooling signal, not an automatic short. In a strong uptrend RSI can stay high for a long time.
- Use the crossunder, not the level. Acting the instant RSI touches 70 fires constantly in a trend, and that is the classic beginner bug.
Application table: scripting RSI
| Role | How you use it | Best TF and market |
|---|---|---|
| Exit cue | Trim longs when RSI crosses under 70 | H4 on Bitcoin, gold |
| Mean reversion | Fade a cross up from 30 in a range | H1 on ranging Forex |
| Filter | Only take longs while RSI above 50 | Any market, any TF |
| Avoid | Do not short a strong trend on 70 alone | Trending gold or Bitcoin |
The RSI indicator guide covers the settings and why the thresholds are a starting point, not a rule.
Which built-in to reach for
The three functions are not rivals. You pick by what you are trying to catch and how fast you trade.
| Built-in | Catches | Reads best on | Weakness |
|---|---|---|---|
| ta.crossover | Trend changes | D1 gold, H4 Forex | Whipsaws in a range |
| ta.macd | Momentum shifts | H4 Forex, D1 crypto | Lags fast reversals |
| ta.rsi | Stretched moves | H4 crypto, H1 Forex | Stays pinned in trends |
A few rules of thumb from that table:
- Slower timeframes are kinder to all three. The same script that reads clean on the 4-hour churns out false signals on the 5-minute.
- Trend tools want trending markets. The moving-average crossover shines on gold’s long legs and drowns in a quiet range.
- Combine, do not stack blindly. The twenty-line script above pairs a crossover with an RSI filter for a reason: one catches the turn, the other throws out the weak ones.
- The ADX makes a good regime filter. Add one line to skip signals when a trend gauge reads flat, and most range whipsaws vanish.
Common Pine Script mistakes
Every beginner hits the same handful of traps. None are hard to fix once you know the name.
- Repainting. A signal that looks perfect on history but moves after the bar closes. Reference confirmed bars, and test with bar-replay before you trust an alert.
- Using the level instead of the cross.
rsi > 70is true on many bars in a row.ta.crossunder(rsi, 70)is true on exactly one. Use the cross for a clean trigger. - Forgetting the version tag. No
//@version=5and functions silently behave like an old version. Always start with it. - Plotting on the wrong scale. An indicator with
overlay=truedraws on price. An oscillator like RSI needs its own panel, so leave overlay off. - Off-by-one on entries. A strategy that enters on the same bar it signals can fill at a price you never saw live. Enter on the next bar to stay honest.
The debugging habit: when a script misbehaves, print the value. plot() the number you are testing and watch it against the chart.
Nine times out of ten the bug is obvious once you can see it.
What works: three things to remember
If you keep only three points from this Pine Script tutorial, keep these.
- Say the rule, then wire it. The logic is one line. Inputs, maths and plotting are just the wiring around it.
- One keyword splits plotting from testing.
indicator()draws and alerts.strategy()backtests, but only trust it with fees and slippage switched on. - The built-ins do the heavy lifting.
ta.crossover,ta.macdandta.rsicover most retail ideas, so start there before writing anything from scratch.
Pine Script will not hand you an edge. What it hands you is speed: an idea becomes a live alert in an evening, and a bad idea gets exposed just as fast.
For traders who would rather test a claim than argue about it, that is the whole point. From here, the same logic scales up into automated systems once a rule has earned your trust.
FAQ
What is TradingView Pine Script, in plain terms?
Is Pine Script hard to learn?
Do you need to know how to code to use Pine Script?
How do I write my first Pine Script?
Can you backtest a strategy in Pine Script?
Is Pine Script free?
What is the difference between an indicator and a strategy in Pine Script?
Which version of Pine Script should I use?
What are the most useful built-in functions to learn first?
What do the key Pine Script terms mean?
Real-time trade setups with entry, stop loss and take profit. Daily market analysis. No subscription, no complicated theory.
🌍 Our recommended brokers


Reader Reviews
Be the first to review this — tell other traders what actually helped, or where it fell short.
Leave a Review

Quant Researcher & Systems Builder
Quantitative researcher who builds the automated systems behind Arxum strategy testing. Works in Python and Pine Script, using AI alongside classic backtesting to validate strategies on years of real data.
