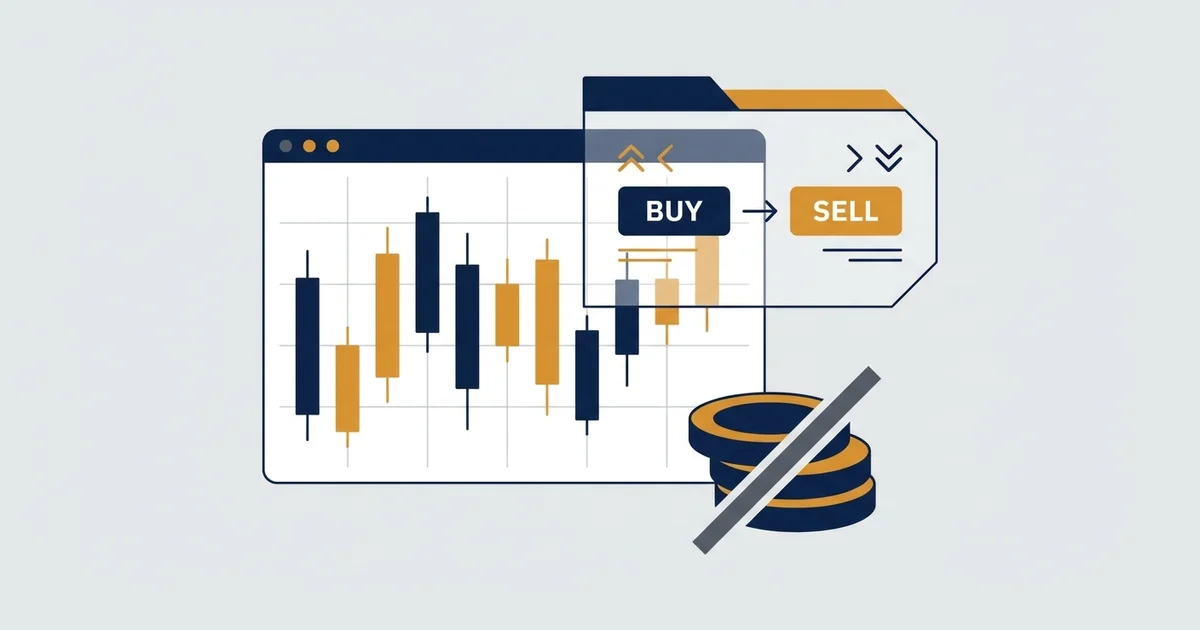

What TradingView paper trading actually is
The tool is a practice account that clicks real buy and sell orders against live prices, but settles them in fake money. You see the same chart, the same order ticket, and the same running profit and loss a funded account would show.
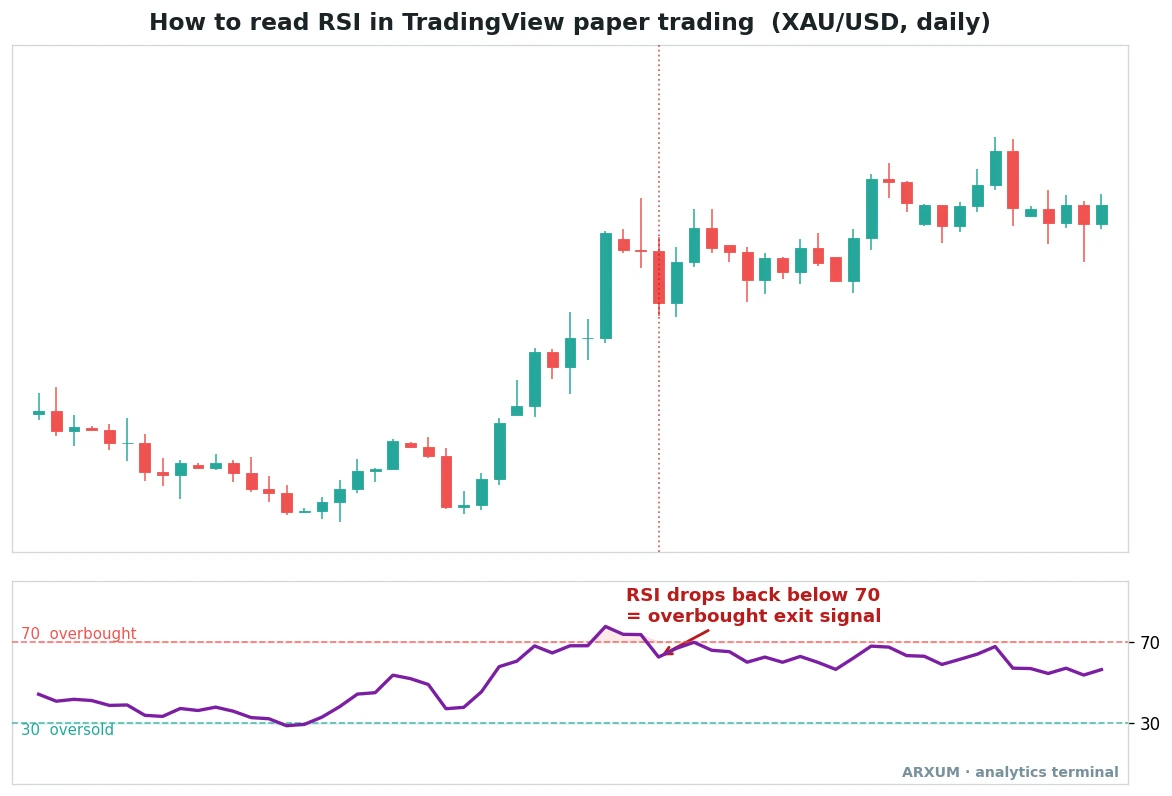
That gold chart is the whole idea in one picture. A live market on top, a signal you can read, and a button you press, except the account behind it is virtual.
- The candle chart is the real, live market. Paper trading does not use old or fake prices, it uses the same feed as everyone else.
- The indicator panel (RSI here) is the signal you are practising to read and act on.
- The dotted line marks the moment of the signal, the bar where you would place or close a trade.
- The order ticket (not drawn here, it opens on the chart) is where you set the size, then hit Buy or Sell.
The one thing that is not real is the balance. Every fill, every profit, every loss is simulated, which is exactly the point.
The parts of the screen
| Part | What it is | Plain read |
|---|---|---|
| Live chart | Real prices, same feed as live trading | The market you are practising on |
| Trading Panel | The bar at the bottom of the chart | Where you connect Paper Trading |
| Order ticket | The buy and sell window | Set size, then place the order |
| Positions tab | Your open trades and running P&L | What you are holding right now |
| Virtual balance | The fake account cash | Resettable, nothing at risk |
Because the prices are live, the only difference from a real account is the money. That makes it an honest rehearsal of the mechanics, if not the emotions.
Why rehearse on paper first
New traders lose money to two things: a strategy that never worked, and fumbling the mechanics of a strategy that does. Paper trading is where you catch both, for free.
- You learn the buttons. Market order versus limit, how to set a stop, how to close half a position. Getting this wrong with real money is an expensive way to learn.
- You test the idea in real time. A setup that looks obvious on a static chart feels very different when the candle is still forming and you have to decide now.
- You build a routine. Same markets, same session, same checklist, repeated until it is automatic.
- You fail cheaply. A blown virtual account costs nothing but a reset, and it teaches the same lesson a blown real account does.
| It is good at | It cannot fix |
|---|---|
| Learning the order tickets | The fear of real losses |
| Testing a setup in real time | Slippage on fast markets |
| Building a repeatable routine | Real fills in thin liquidity |
| Reading signals under a moving candle | The greed after a winning streak |
The honest summary: paper trading rehearses the process perfectly and the psychology barely at all. That gap is the whole reason for the honesty section further down.
How to turn on TradingView paper trading
You do not need a paid plan or a real broker. The paper trading TradingView offers is a built-in broker, connected from the chart itself.
Here is the sequence.
| Step | What to do | Result |
|---|---|---|
| 1 | Open any chart, click the Trading Panel tab at the bottom | The broker bar opens |
| 2 | Choose "Paper Trading" from the broker list | Connects the simulator |
| 3 | Accept the virtual account | You get a fake balance |
| 4 | Click Buy or Sell to open the order ticket | Set size and place the trade |
| 5 | Use the Positions tab to manage and close | Track running P&L |
A few setup notes that trip people up:
- It is on the free plan. Paper Trading does not cost anything and works without linking a real broker.
- You can reset the balance. Blown the virtual account, or want a clean slate for a new test, reset it in the account settings and start again.
- It works in the mobile app too. The Trading Panel is on the phone app, so you can rehearse on the same account from your desk or your pocket.
- Orders sit on the chart. Your entry, stop and target show as lines you can drag, which is the same muscle memory a live account needs.
Set a realistic starting balance. A fake million teaches nothing, because you will size like a maniac.
Pick a number close to what you would actually fund.
Three signals worth drilling on paper
Paper trading is only as useful as what you practise on it. The point is not to click at random, it is to rehearse a specific setup until you can spot and place it fast.
Here are three, each a different tool on a different market and timeframe.
1. An RSI overbought exit, gold on the daily
The first drill is timing an exit, not an entry, which is the skill most beginners skip. The gold chart at the top of this guide is the drill: an RSI read that flags when a run is stretched.
RSI, the relative strength index, is a momentum gauge that runs from 0 to 100. Above 70 is called overbought, below 30 oversold.
- How it looks: price pushes up, RSI climbs above the 70 line, then curls back under it.
- The cue: RSI crossing back below 70 is the overbought exit signal, the market losing its upward steam.
- What to rehearse: holding a long into strength, then trimming or closing when RSI drops back under 70 rather than guessing the top.
- Why gold, daily: a strong trending market on a slow timeframe gives clean, readable RSI swings, ideal for a first drill.
| Role | How you use it | Best read |
|---|---|---|
| Exit cue | Trim or close when RSI falls back under 70 | D1 on gold, trending markets |
| Overheat gauge | Above 70 warns the move is stretched | Any instrument, slower TFs |
| Practice focus | Rehearse exiting into strength, not at the top | Paper account, repeat 20 times |
Overbought does not mean sell, it means stretched. In a raging trend RSI can sit above 70 for a long time, so the drill is the cross back down, not the first touch.
2. A MACD zero-line cross, Bitcoin on the 4-hour
The second drill is reading momentum shift on a faster, wilder market. Bitcoin on the 4-hour is a good sparring partner, because crypto moves enough to make the signal obvious.
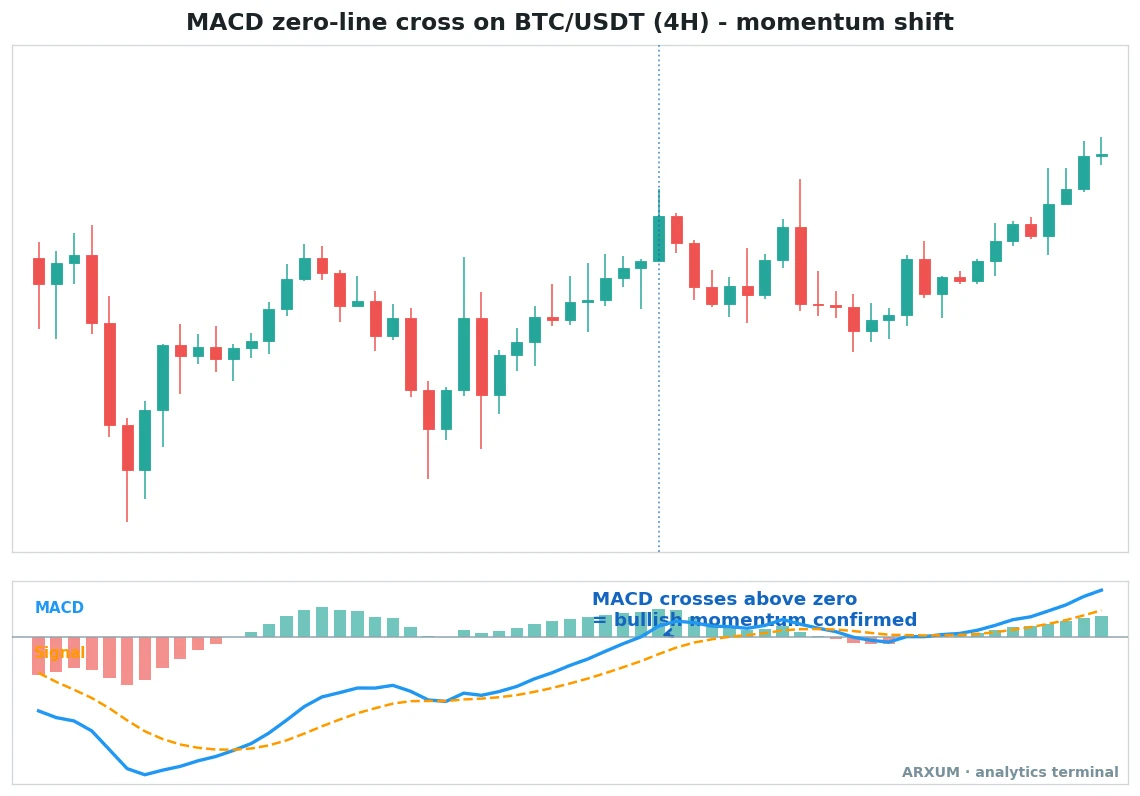
MACD is a momentum indicator built from two moving averages. The MACD line crossing the zero level tells you which way momentum has tipped.
- How it looks: the blue MACD line climbs from below zero and closes above it, with the histogram bars flipping green.
- The cue: MACD crossing above zero is bullish momentum confirmed, the shift from falling to rising.
- What to rehearse: waiting for the cross to complete rather than front-running it, then placing the entry with the order ticket.
- Why Bitcoin, 4-hour: the 4-hour filters out a lot of intraday noise while still giving several signals a week to practise on.
| Role | How you use it | Best read |
|---|---|---|
| Entry trigger | Go long when MACD closes above zero | H4 on BTC, trending phases |
| Momentum read | Above zero is bullish, below is bearish | H4 and D1, any instrument |
| Filter | Skip the cross when the market is chopping sideways | Low-volatility ranges |
The trap to rehearse away is the fake-out. In a range MACD flips across zero constantly, so pair it with a look at whether Bitcoin is actually trending before you act.
3. An EMA golden cross, EUR/USD on the 4-hour
The third drill is the classic trend-follow signal, two moving averages crossing. It is slow, it lags, and it is one of the calmest setups to learn on, which makes it perfect for paper practice.
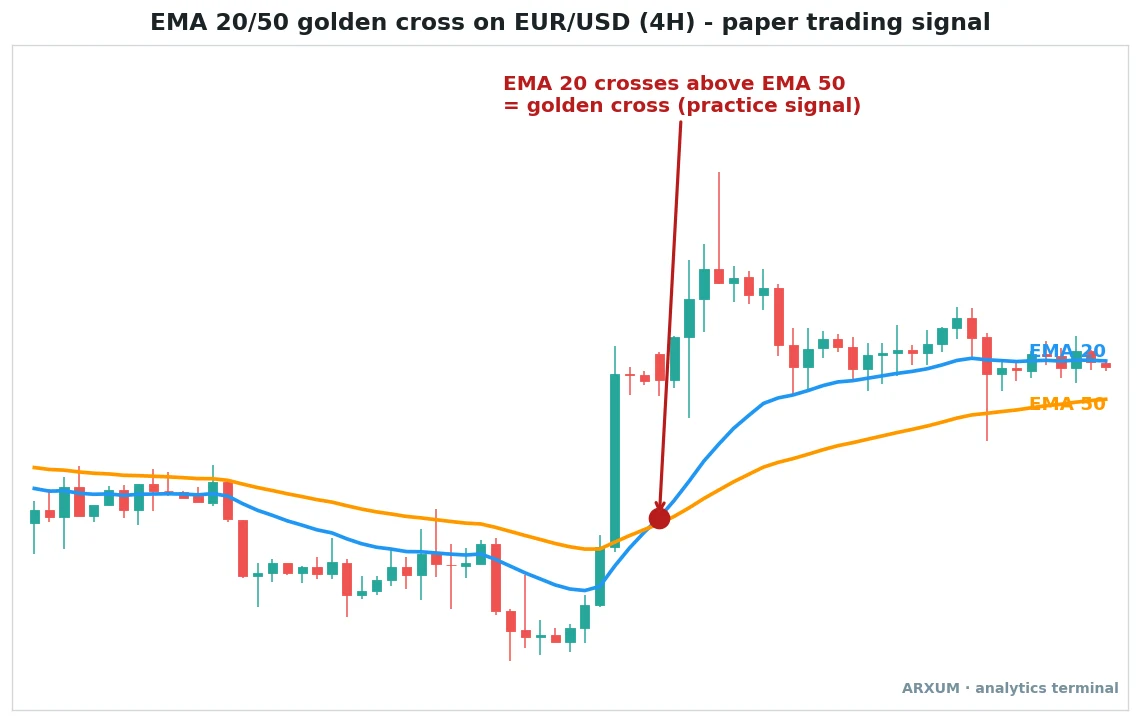
An EMA, or exponential moving average, is a line that smooths price and reacts faster to recent bars than a plain average. When a faster EMA crosses above a slower one, traders call it a golden cross.
- How it looks: the blue EMA 20 sits below the orange EMA 50 in a downtrend, then curls up and crosses above it.
- The cue: the golden cross, EMA 20 over EMA 50, is the shift from down to up.
- What to rehearse: entering after the cross confirms, then holding while the fast line stays above the slow one.
- Why EUR/USD, 4-hour: the most liquid Forex pair on a swing timeframe gives smooth, textbook crosses without wild gaps.
| Role | How you use it | Best read |
|---|---|---|
| Trend entry | Go long on the EMA 20 over EMA 50 cross | H4 and D1 on EUR/USD |
| Trend read | Fast EMA above slow EMA is an uptrend | Any instrument, swing TFs |
| Exit cue | Consider closing when the lines cross back down | H4 and D1, trending markets |
The honest weakness of a moving-average cross is that it lags. It confirms a trend late and whipsaws in a range, so the drill teaches patience and trend selection more than speed.
A simple paper-trading practice plan
Random clicking teaches random lessons. Give the practice a shape, the same way a funded trader runs a plan.
| Focus | What to drill | Goal |
|---|---|---|
| Mechanics | Place, size, stop and close orders | No fumbled tickets |
| One setup | Trade only the RSI exit or one cross | Spot it fast, act clean |
| Journaling | Log every trade and the reason | See your real patterns |
| Consistency | Same market, same session daily | A repeatable process |
The rules of thumb that make paper time count:
- Trade one setup at a time. Master the RSI exit before adding the MACD cross. A screen full of signals teaches nothing.
- Size like it is real. Use the account balance you would actually fund, and risk a small, fixed slice per trade, so the habit transfers.
- Keep a journal. A trading journal of entry, reason, exit and outcome turns fake trades into real feedback.
- Take losses seriously. A virtual stop-out still teaches the lesson if you treat it as if the money were yours.
Practice is only useful if it is honest. Sizing a fake account like a casino and shrugging off the losses builds habits you will pay for later.
Paper trading, demo accounts and backtesting
These three get muddled, and they answer different questions. Paper trading and a demo account are close cousins, backtesting is a different beast.
| Method | What it is | Best for |
|---|---|---|
| Paper trading | Live prices, fake money, in real time | Rehearsing the process now |
| Demo account | A broker's simulated live account | Testing a specific broker platform |
| Backtesting | Running a rule over past data | Checking if an idea ever worked |
- Paper trading versus a demo account. They overlap heavily. Paper trading on TradingView lives inside your charting platform, while a broker demo account mirrors one broker’s own trading software. Use paper trading to rehearse setups, use a demo to learn the exact platform you will fund.
- Paper trading versus backtesting. Backtesting answers “did this rule make money over years of history”, in seconds. Paper trading answers “can I actually execute it live”, in real time. You backtest to find an edge, then paper trade to learn to pull the trigger.
- The order that works: backtest the idea, paper trade the execution, then go live small. Each stage fixes a different weakness.
What paper trading cannot teach you
This is the part most guides skip, and it is the most important. Paper money is a perfect rehearsal of the mechanics and a poor imitation of the pressure.
- No real fear. Losing fake money does not trigger the panic that makes you close a good trade early or freeze on a bad one. The psychology of trading only shows up when the money is yours.
- No slippage. Paper fills are often cleaner than real ones. In a fast market your real entry can be worse than the price you clicked, and paper trading rarely models that.
- Perfect liquidity. The simulator assumes your order fills instantly at a fair price. In thin markets or big size, a real order can move the price against you.
- Easy discipline. It is simple to follow a plan when nothing is at stake. The test is whether you keep following it when a real losing streak hits your real balance.
| On paper | In a live account |
|---|---|
| Losses do not sting | Losses trigger fear and revenge trades |
| Fills are clean | Slippage on fast or thin markets |
| Instant, fair execution | Your size can move the price |
| Discipline is easy | Discipline is the whole game |
None of this makes paper trading useless. It makes it stage one.
It gets the mechanics and the setup right, so that when you go live, the only new variable is the emotion.
When you are ready for real money
Paper trading has an exit point. Stay too long and you drill habits in a consequence-free world that does not carry over.
Here is a rough readiness checklist.
| Check | What good looks like |
|---|---|
| Mechanics | No fumbled orders in weeks |
| One setup | You spot and place it cleanly |
| A plan | Written rules you actually follow |
| Risk math | You size every trade to a fixed risk |
Before the first real trade, lock down two numbers:
- Your risk per trade. Decide the fixed slice of the account you will lose if a trade hits its stop, and match it to a sensible risk-reward ratio so the winners outweigh the losers.
- Your position size. Work the trade size from that risk and your stop distance, the same position sizing math every time, so no single trade can hurt you.
Then go live with the smallest size your broker allows. The step from paper to real is a step down in size, not up, precisely because the emotions are new.
A written trading plan is what carries the discipline across that gap.
What works: three things to remember
If you keep only three points from this guide, keep these.
- Rehearse the mechanics, not just the theory. Paper trading exists to make the order tickets, the sizing and the exits automatic before real money is on the line.
- Drill one setup at a time. Pick the RSI exit, the MACD cross or the EMA golden cross, and repeat it on the same market until you can spot and place it without thinking.
- Know what it cannot teach. Slippage and fear only arrive with a live account, so treat paper trading as stage one, then go live small and let the psychology be the only new thing.
TradingView paper trading will not make you profitable on its own. Used for what it is good at, a free, repeatable rehearsal of the process, it is the cheapest trading education you will ever get.
Glossary: the key paper trading terms
- Paper trading: placing simulated trades with fake money on live prices, to practise without financial risk.
- TradingView paper trading: the Paper Trading broker built into TradingView, connected from the Trading Panel at the bottom of the chart.
- Demo account: a broker’s own simulated live account, used to practise on that broker’s specific platform.
- Backtesting: running a set of trading rules over past price data to see how they would have performed.
- Order ticket: the buy and sell window where you set trade size and place an order.
- RSI: the relative strength index, a momentum gauge from 0 to 100, with 70 called overbought and 30 oversold.
- MACD: a momentum indicator built from two moving averages, with a cross of the zero line marking a momentum shift.
- EMA: an exponential moving average, a line that smooths price and reacts faster to recent bars than a plain average.
- Golden cross: a faster moving average crossing above a slower one, read as a shift to an uptrend.
- Slippage: the gap between the price you expected and the price your order actually fills at, common in fast or thin markets.
FAQ
What is TradingView paper trading, in plain terms?
Is TradingView paper trading free?
How do I turn on paper trading in TradingView?
Is paper trading on TradingView realistic?
What is the difference between paper trading and a demo account?
How long should I paper trade before going live?
Can I paper trade on my phone with the TradingView app?
What are the downsides of paper trading?
Real-time trade setups with entry, stop loss and take profit. Daily market analysis. No subscription, no complicated theory.
🌍 Our recommended brokers


Reader Reviews
Be the first to review this — tell other traders what actually helped, or where it fell short.
Leave a Review

Momentum Trader & Technical Analyst
Trades momentum across crypto and forex since 2019, built around RSI, MACD, and volume. Turns discretionary setups into rule-based, systematic entries and validates them on data before they go live.
