
Why most traders have no idea what’s actually working
Running a strategy without a journal is like navigating at night with no instruments. You can see what’s immediately ahead, but patterns that span dozens of trades stay invisible.
I spent my first two years of systematic testing recording results in my head. Not a spreadsheet, not a text file. Just memory. My working theory was that my EMA crossover system was performing well. It felt consistent. Then I finally exported three months of live forward-test data from my brokerage’s cTrader platform into Python and ran the actual numbers.
The win rate was 49%.
Not the “around 60%” I’d been mentally calculating. Forty-nine percent, a near coin flip on a system I was actively considering scaling. The issue wasn’t the strategy itself. The issue was that I only remembered winning trades clearly. Losses got filed as “outliers” without ever being counted.
This is a documented pattern in trading psychology research: traders who overestimate their edge aren’t reckless by nature. They’re just working from imperfect memory. A journal fixes this by making performance objective and, more importantly, auditable.
The minimum useful journal isn’t complicated. You need twelve data points per trade. The rest is analysis.
12 fields every trade should include
Most traders start with too few fields (just entry and P&L) or too many (twenty-plus columns they abandon by week two). Twelve is the functional minimum for meaningful pattern analysis later.
- Date and time: session timing matters; some setups only work reliably during the London open or the New York overlap
- Instrument: EUR/USD, BTC/USD, XAU/USD; never lump different instruments together in aggregate stats
- Direction: long or short
- Entry price: exact level, not rounded to the nearest figure
- Stop loss: in pips or points, used to calculate initial risk (R)
- Target: initial take profit level before the trade opens
- Position size: lots or contracts
- Outcome: final exit price, including all partial closes with their timing
- R multiple: actual result expressed as a multiple of initial risk (+1.8R, -1R, +0.4R)
- Setup type: the specific pattern or signal triggering the entry (“RSI divergence 4H”, “EMA cross above 200”, “breakout retest”)
- Market regime: trending, ranging, or choppy, based on ADX reading or price structure at entry
- Notes: one sentence on why you took this trade and one sentence on what actually happened
The R multiple column is the most important field in the journal. It separates execution quality from setup quality, which most traders conflate when they’re just looking at dollar P&L. A $200 gain on a $50 risk is 4R. A $200 gain on a $800 risk is 0.25R. The dollar amount looks the same. The quality of those two trades is completely different.
Setting up your journal: 3 formats that work
Spreadsheet (Google Sheets or Excel)
The simplest option and the one I use for manual trade annotation. Columns match the twelve fields above. Add a summary tab with running stats: win rate, average win R, average loss R, and expectancy. The expectancy formula is straightforward: (win rate × avg win R) + ((1 - win rate) × avg loss R). A positive expectancy number means the edge is real. A negative one means the system loses over time regardless of the occasional big winner.
Download the Arxum Trading Journal Template from /downloads/. It includes the summary tab and session filters already built in.
TradingView built-in journal
TradingView has a native trade journal in its paid plans. Useful if you’re doing all your analysis there and want entry/exit annotations directly on charts alongside your indicators. The limitation: export options are restricted, so deep analysis beyond basic stats requires manual data entry elsewhere. Good for discretionary traders who want chart context preserved with each trade.
Broker CSV export for systematic traders
This is the approach I use for systematic strategy evaluation. IC Markets cTrader exports a complete trade history as CSV, with entry time, exit time, direction, size, P&L, and commission all included. Pull this into Python with pandas and you can calculate win rate by hour of day, by setup type, or by market regime in roughly twenty lines of code. For traders on MT4 or MT5, the statement export achieves the same result in a slightly less clean format.
I run live forward-tests on a $1,000 IC Markets account to validate what the backtests show. The export takes thirty seconds and feeds directly into my review script. For manual traders who don’t code, Google Sheets with conditional formatting achieves similar analysis, just at a slower pace.
Analyzing the data: what the numbers actually reveal
Logging trades is table stakes. The value comes from monthly review sessions where you slice the data by variable and force patterns into visibility.
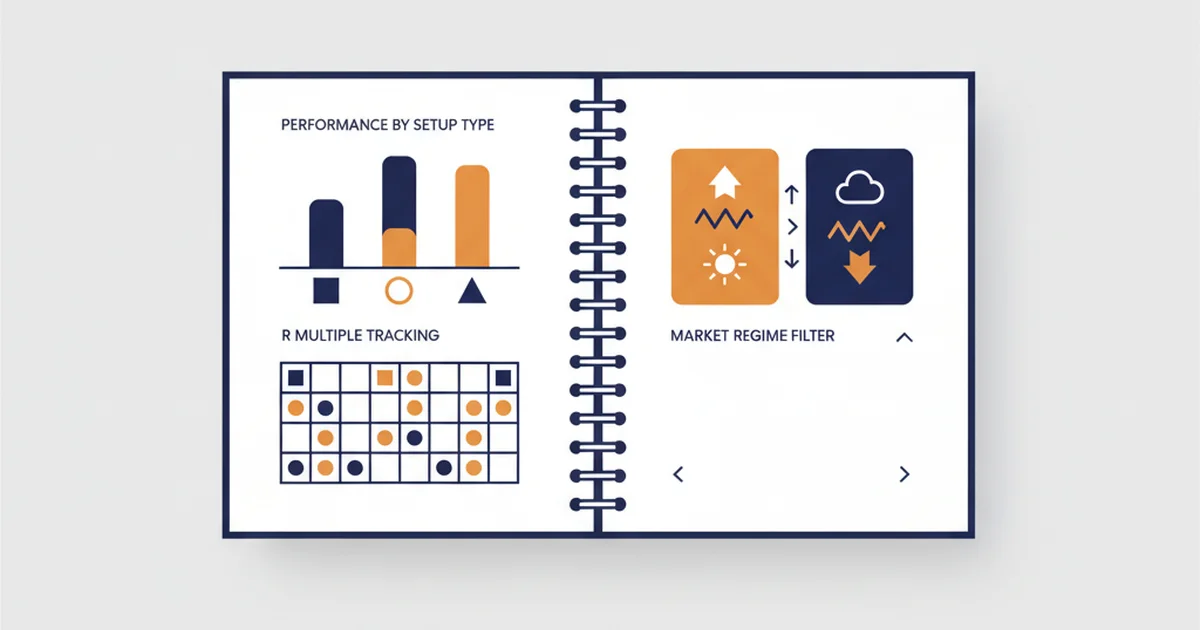
By setup type. Are all your setups profitable, or is one carrying the others? In my last full-year review of my forex system, RSI mean reversion on the daily was running at 71% win rate while MACD crossover entries were at 44%. Without the journal breakdown, I’d have been averaging them together as “my strategy at 58%.” Cutting the MACD setup entirely improved the system significantly, and I’d never have found that without the per-setup breakdown.
By market regime. This is the single biggest discovery I’ve made through journal analysis. I filter every trade in my log by ADX value at entry. Below ADX 20, a ranging directionless market, the same setups that work cleanly in trending conditions generate excessive noise. After running this filter, removing trades taken when ADX was below 20 cut my total trade count by 31% but raised overall win rate from 54% to 67%. The strategy didn’t change. The filter did. The journal made that improvement possible by showing exactly where the losing trades were clustering.
By session. London open trades (7:00–9:00 UTC) behave differently from New York session trades on the same instrument. If you’ve never split your results by session, you may be running a setup that only works in one of them and blaming the strategy when it’s actually a timing problem.
By holding period. Longer holds may be more profitable per trade but expose you to overnight gap risk. Shorter holds may have a higher win rate with worse average R. Both can be valid depending on your risk tolerance, but you need to know which profile your system actually produces, not which one you think it produces.
This kind of analysis is what backtesting a trading strategy gives you on historical data. Your live journal gives you the equivalent analysis on current, forward-tested data. Both are necessary. Backtests can be curve-fitted to past regimes, but live journal data reflects the market environment you’re actually trading in right now.
Common mistakes that make journals useless
Recording but never reviewing. The log itself does not improve performance. The analysis does. Set a fixed review date: last Sunday of each month, sixty minutes minimum. This is non-negotiable. I have a recurring calendar block for it and treat it as a working session, not a chore.
Selective logging. Some traders only log trades they’re proud of, especially in the early months. This completely destroys the data. Log every trade, including the ones you knew immediately were errors. Those are the most valuable entries. They reveal risk management failures faster than winning trades do, because you’ll start to see the conditions that precede bad entries.
Not calculating R multiples. Dollar P&L without R multiples makes cross-instrument and cross-period comparison meaningless. Reviewing your risk-reward ratio as a running metric, planned versus actual, is where most traders discover they consistently move stops or close winners early. The journal surfaces this pattern. Awareness of the pattern usually reduces it.
Too many fields. I tested a twenty-eight-field journal for three months. I stopped filling it in by week two. Twelve fields that you log on every single trade are more useful than twenty-eight fields with gaps. Completeness matters more than detail. Missing data in your regime or setup columns is the difference between analysis and guessing.
Writing notes after the trade closes. Post-exit notes tend to justify whatever the outcome was, which removes accountability from the log. Write the reasoning before you close. You want to capture your logic at the moment of decision, not a rationalization written after the fact. If you can’t write a one-sentence reason before the trade closes, that’s data too.
Skipping review during losing streaks. This is where journals get abandoned. Traders don’t want to look at a string of red trades. Losing streaks are exactly when the journal earns its value. These are the moments when you most need to know whether the drawdown is within normal variance or whether a setup has genuinely stopped working.
FAQ
What should a trading journal include?
How long should I keep a trading journal?
Is there a free trading journal template?
How often should I review my trading journal?
What's the best app for a trading journal?
Can a trading journal actually improve win rate?
Real-time trade setups with entry, stop loss and take profit. Daily market analysis. No subscription, no complicated theory.
🌍 Our recommended brokers


Reader Reviews
The setup-type breakdown section changed how I approach monthly reviews. I had been averaging all my EUR/USD trades together as one system for six months and getting a 52% win rate that felt acceptable. When I applied the R-multiple column the article describes and then split by setup type, the actual breakdown was striking: my RSI pullback on the 4H was running at 68%, MACD crossovers were at 41%, and breakout retests were at 39%. I had two setups subsidizing one that was actively dragging down my equity. After removing both underperforming setups and running only the RSI pullback, my monthly return moved from +4.1% to +7.8% over the next three months. The article is right that the R-multiple column is the key - without it, the dollar P&L masked how different the quality was across entries. The twelve-field minimum is exactly right in practice.
The note about writing reasoning before closing a trade is something I have been ignoring for two years. I switched to pre-exit annotation in January. The difference in accountability is immediate. You cannot rationalize a bad entry when the logic is already written down before the trade closes.
The ADX regime filter I applied after reading this raised my win rate from 57% to 71% on GBP/USD over eight weeks. I had been taking trend following setups in every market condition including ranging periods with ADX below 18. After logging regime data for a month and running the filter retroactively, the losing-trade cluster was almost entirely in low-ADX environments. The pattern the article describes about ranging markets generating excessive noise on trend setups matched my data exactly.
I tested the broker CSV export workflow the article recommends using IC Markets cTrader exports into Google Sheets. The setup took about two hours but the analysis it enabled was worth far more than that. Running a pivot table on session timing showed that my EUR/USD scalping entries between 09:30 and 11:00 UTC were at 62% win rate while the same setups between 14:30 and 16:00 New York were at 38%. I had no idea about this split because I was looking at aggregate win rate. Splitting by session, same instrument, same setup, the 24 percentage-point gap is exactly the kind of pattern the article says journals reveal. After restricting entries to the London window and the first two hours of the New York overlap, my monthly return on the scalping system went from +3.2% to +7.4% over four months. The export-to-spreadsheet workflow takes about fifteen minutes per week once the template is built.
The expectancy formula in the spreadsheet section is the metric I now track above win rate. A strategy with 45% win rate and 2.5 average win R is better than one at 60% with 0.9 average win R. This article explains that clearly in a way most trading resources do not.
The selective logging problem the article describes in the common mistakes section is something I did for almost a year. I was only logging the trades I planned to reference as examples for improving my system. After starting a complete log in March including all impulsive entries and trades I knew immediately were mistakes, the data showed that unplanned entries made up 22% of my total count and 71% of my total drawdown. The journal made that invisible pattern visible within the first six weeks.
The holding period analysis section is where this article separates from generic journal guides. I trade XAU/USD on the 4H and had been assuming shorter holds were always better because they locked in gains faster. Running the breakdown on my journal data told a different story: trades held for 2 to 4 sessions averaged 1.7R and a 64% win rate while intraday closes on the same setup were at 1.1R and 51%. The longer holds were underutilized because I was manually closing early based on fear rather than letting the original setup play out to the target. After setting a rule to not close before the first target unless the stop was triggered, my monthly return on the XAU/USD system went from +5.6% to +8.3% over the following two months. The journal data made a case I could not argue against with intuition alone. The R-multiple column is what enabled this analysis - without it I would have just seen dollar figures that looked similar regardless of how the trade was managed.
I had been using TradingView's built-in journal for six months before switching to the broker CSV approach the article recommends for systematic traders. The TradingView version is useful for chart context but the export limitations are a real constraint when you want to run regime or session filters. The IC Markets CSV took about 15 minutes to import into a Google Sheet and the analysis I ran in the first session identified a MACD crossover setup that was at 38% win rate and had been running for four months. Removing it raised my overall system win rate from 51% to 61% in the month after.
Leave a Review

Quant Researcher & Systems Builder
Quantitative researcher who builds the automated systems behind Arxum strategy testing. Works in Python and Pine Script, using AI alongside classic backtesting to validate strategies on years of real data.
