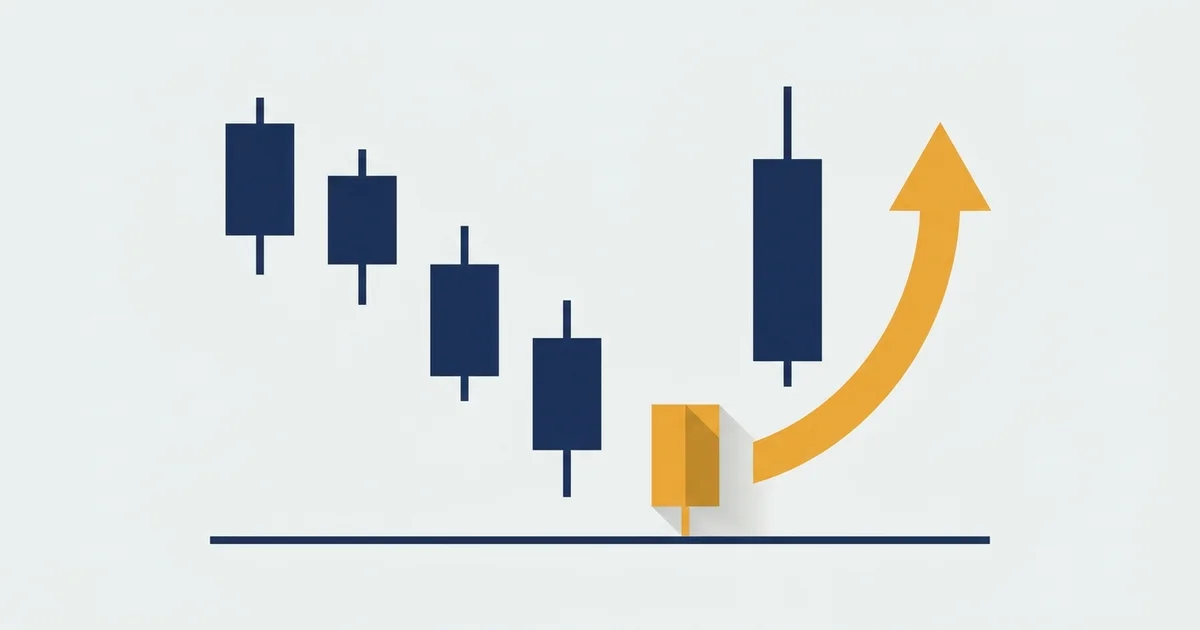

What an Inverted Hammer Candlestick Looks Like
The inverted hammer is a bottom-of-the-move candle that looks like an upside-down hammer. Here is a textbook one on the gold daily chart, with every feature that makes it count labelled.
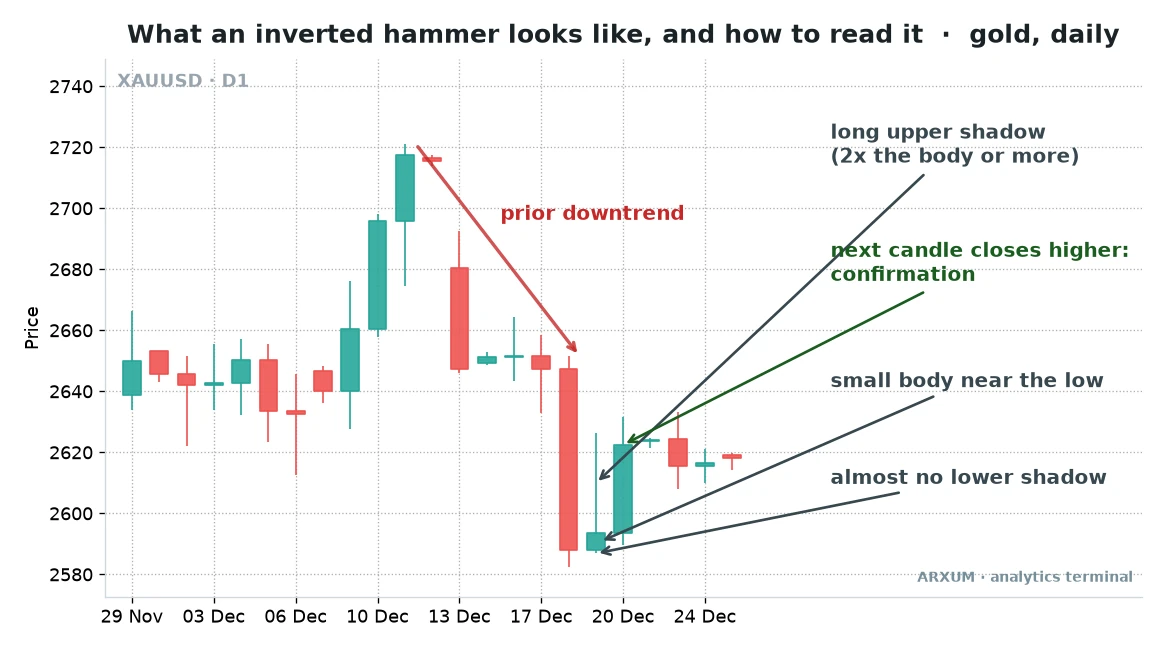
With the picture on screen, the parts are easy to name.
- The prior downtrend. Gold slid from the top of the chart for about a week. An inverted hammer needs something to reverse, so a candle like this in the middle of a range means very little.
- The long upper shadow. Buyers drove price well above the open during the day. The shadow is the footprint of that push, and its length is the whole point of the candle.
- The small body near the low. By the close, sellers had pulled price back down. The open and close sit close together at the bottom of the candle’s range.
- Almost no lower shadow. Price barely traded below the open. Sellers could not push to fresh lows that session.
- The confirming candle. The next day closed higher, above the inverted hammer’s body. That close is what turns a warning into a signal.
If candle anatomy itself is new to you (body, shadow, open, close), the guide to reading candlestick charts covers it in a few minutes.
How to Identify an Inverted Hammer: The Rules
Traders argue about the exact ratios, so treat these as rules of thumb rather than law. The table below is the checklist most charting guides and desks use.
| Feature | Rule of thumb | Why it matters |
|---|---|---|
| Location | After a decline | No downtrend, no reversal |
| Upper shadow | 2x the body or more | Shows a real buying push |
| Body | Small, lower third | Sellers won the close |
| Lower shadow | Tiny or none | No new selling low |
| Body colour | Green or red | Green is slightly stronger |
| Next candle | Closes higher | The confirmation |
A few points that a table cannot carry.
- The 2x rule is a floor, not a target. A shadow three or four times the body is a cleaner read than one that barely clears 2x.
- Measure the shadow against recent candles too. A long shadow on a quiet day means more than the same length on a wild day full of long wicks.
- The body can sit slightly above the low. “Almost no lower shadow” allows a small tail. Avoid candles with long shadows on both sides. That shape is a spinning top, a candle that shows indecision rather than a buying push.
- The candle must be closed. Mid-session, a candle can look like an inverted hammer and then fill in its shadow before the close. Judge only finished candles.
Inverted Hammer Meaning: What the Candle Says
Read the candle as a short story told inside one session. Each part of the shape is one chapter.
- Price opens near the bottom of a falling market, and sellers are still in charge.
- Buyers step in hard and push price well above the open. This is the first real attempt to stop the decline.
- Sellers push back and drag price down to close near the open. The rally failed for now.
- Yet sellers did not make a new low. The fall has lost its push, and buyers have shown they are around.
That last chapter is the meaning. The candle does not say “buyers won”; it says sellers could not follow through, and buyers tested the water.
Remember it this way: the candle is a question, and the next candle is the answer.
Green vs Red Inverted Hammer
A bullish inverted hammer usually means a green body, where the close is above the open. A red body still counts, as long as the shape is right.
| Body | What happened | Read |
|---|---|---|
| Green | Closed above the open | Slightly stronger |
| Red | Closed below the open | Valid, needs confirmation |
| Doji-like | Open equals close | See gravestone doji |
- Green body. Buyers held a little ground by the close. It is a small extra hint, not a guarantee.
- Red body. Sellers still closed the candle down, so the confirming candle carries even more weight here. Both real-chart examples further down are red-bodied inverted hammers, and both needed a green close after them.
- No body at all. When open and close match, the candle is a gravestone doji. At a low it reads much like an inverted hammer; the doji candlestick guide covers the differences.
Colour is a tiebreaker. Location and the next close matter far more.
Inverted Hammer vs Hammer vs Shooting Star
Four candles share two shapes, and location decides the name. This is the single biggest source of confusion with the inverted hammer.
| Candle | Shape | Where it prints | Bias |
|---|---|---|---|
| Inverted hammer | Long upper shadow | After a decline | Bullish |
| Shooting star | Long upper shadow | After a rally | Bearish |
| Hammer | Long lower shadow | After a decline | Bullish |
| Hanging man | Long lower shadow | After a rally | Bearish |
What separates the inverted hammer from each cousin:
- Inverted hammer vs shooting star. The candles are identical in shape. One sits at the bottom of a fall, the other at the top of a rise. The bearish version is covered in the shooting star candlestick guide.
- Inverted hammer vs hammer. Both are bullish and both appear after a decline. The hammer’s shadow points down: sellers pushed lower and got rejected, which many traders see as the stronger of the two.
- Why the hammer often reads stronger. A hammer shows buyers rejecting lower prices and winning the close. An inverted hammer shows buyers trying higher and failing to hold it, so it leans harder on confirmation.
- Versus the hanging man. Opposite shape and opposite location. They rarely get mixed up in practice, but they sit in the same family.
If you only remember one line: same shape, different location, different name.
Setup 1: The Confirmation Close
The classic way to trade this candle is also the simplest. You do nothing on the candle itself and wait for the next candle to close above its body.
Go back to the gold daily chart at the top of this guide. The inverted hammer printed after a week-long slide, and the next day closed well above its body, which is exactly the trigger this setup waits for.
| Role | How you use it | Best read |
|---|---|---|
| Trend read | Clear prior decline | D1, gold and FX |
| Entry trigger | Next candle closes higher | D1, H4 |
| Stricter trigger | Close above the shadow high | D1 on gold |
| Stop area | Below the candle's low | Any timeframe |
| Exit cue | Next resistance or a bearish candle | Same timeframe |
Rules, in order:
- Timeframe: daily or 4-hour. Each candle there reflects enough real trading for the shape to mean something.
- Step 1: a decline of several candles, with lower highs and lower lows.
- Step 2: a closed candle that passes the checklist above.
- Step 3: the next candle closes above the inverted hammer’s body. That is the standard trigger.
- Step 4 (stricter): some traders wait for a close above the top of the upper shadow. You give up some of the move, but you skip more of the false starts.
- Invalidation: a close below the inverted hammer’s low. The sellers made their new low after all, and the idea is dead.
Rule of thumb: the standard trigger gets you in earlier, the stricter one keeps you out of more traps. Pick one and use it every time.
Setup 2: Inverted Hammer at Support
The second way leans on location. An inverted hammer that prints right on a level where buyers stepped in before is a much better bet than one floating in open space.
| Role | How you use it | Best read |
|---|---|---|
| Context | Mark the prior swing low (where price turned up earlier) | H4, H1, M15 |
| Entry trigger | Inverted hammer on the level, then a green close | H1, M15 on BTC |
| Filter | Skip if the level already broke cleanly | Any timeframe |
| Stop area | Below the level and the low | Any timeframe |
| Exit cue | The last lower high above | Same timeframe |
Here is how that looks on a fast Bitcoin chart.
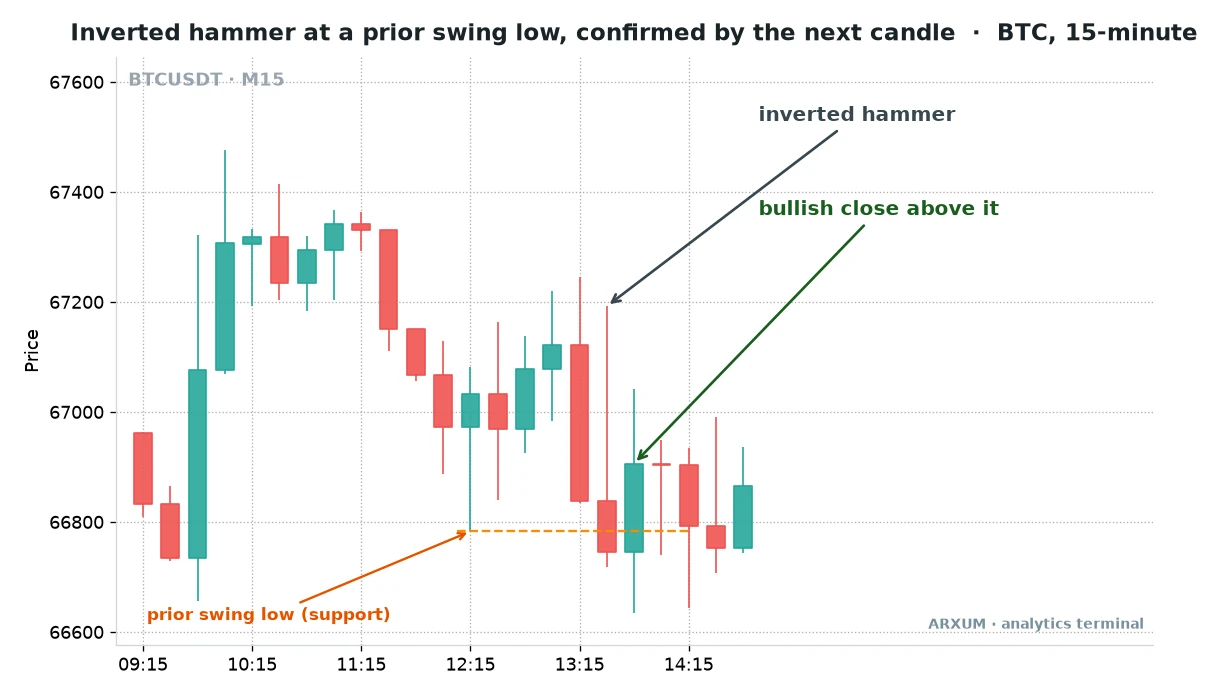
What to notice on that chart:
- Price had already bounced from the same area earlier in the session. That earlier turn is what makes the line support.
- A heavy red candle drove price back down to the level. The inverted hammer printed right after, and its body sat on the line.
- The shadow reached high into the prior red candle’s range. Buyers clearly tried, even though the candle closed red.
- The green candle after it closed above the inverted hammer’s body. That is the confirmation.
- The bounce after it was modest, and price chopped around the level for a while. A later candle (around 14:15) wicked down to about 66,645, below the inverted hammer’s low near 66,720. So the stop this setup prescribes, below the level and the low, would have been hit after entry. That is the 15-minute noise problem in action: moves are small, wicks are long, and a tight stop gets tagged easily.
Two habits make this setup work:
- Draw the level before the candle prints. If you only “find” support after you see the inverted hammer, you are fitting the story to the candle. The support and resistance guide shows how to mark levels in advance.
- On crypto, use real volume as a bonus. Exchanges report actual traded volume, so a volume jump on the confirming candle adds weight. On gold and Forex the platform shows tick volume, a count of price updates, so lean on the level instead.
Setup 3: Inverted Hammer Plus RSI
The third way adds a momentum gauge. RSI (the Relative Strength Index) is a free line under the chart that runs from 0 to 100 and shows how strong recent moves have been.
The standard setting is 14 periods. Readings below 30 are called oversold (selling has been heavy), above 70 overbought, and the full mechanics are in the RSI indicator guide.
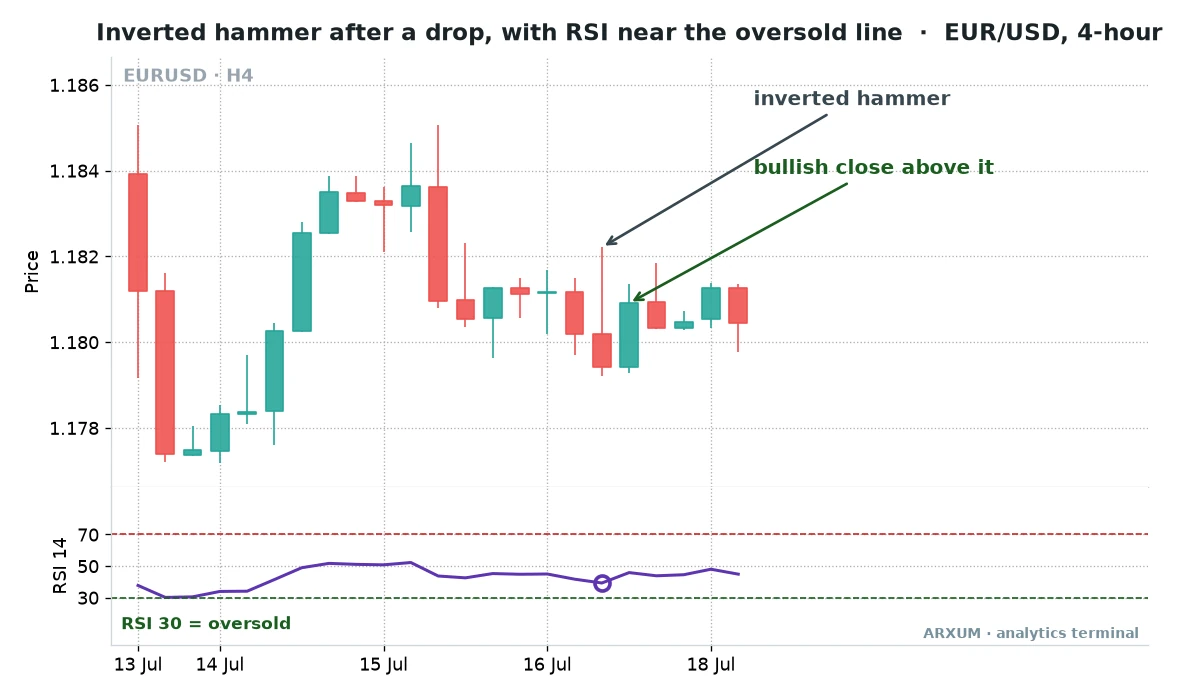
How to read this one:
- The euro slid over several 4-hour candles after a failed push higher. The inverted hammer printed near the bottom of that slide.
- RSI was not below 30. It sat around 40, in the weak half of its range and pointing down, which is the honest reality of most signals.
- The confirming candle closed above the inverted hammer, and RSI turned up with it. Price and momentum agreed for a moment.
- The follow-through was small and the pair drifted sideways. A weak momentum read gives a weak bounce more often than a big one.
That last point is the lesson. Waiting for RSI under 30 at the exact moment an inverted hammer prints is rare, so most traders use a softer rule.
| RSI 14 reading | What it adds | Read |
|---|---|---|
| Below 30 | Selling stretched | Strongest, rare |
| 30 to 45, falling | Weak momentum | Usable with a level |
| 45 to 55 | Nothing much | Rely on location |
| Above 55 | Market not weak | Likely not a bottom |
| Higher low vs price | Bullish divergence | Bonus tell |
- Divergence is a bonus, not the rule. If price makes a lower low while RSI makes a higher low, momentum is quietly improving. It is a nice extra when it shows up, and the RSI divergence guide explains how to spot a real one.
- Use RSI as a gauge, not a trigger. The trigger is still the confirming close. RSI only tells you whether the bounce has a tailwind.
| Role | How you use it | Best read |
|---|---|---|
| Momentum gauge | RSI 14 under ~45, falling | H4 on FX |
| Entry trigger | Confirming close, RSI turns up | H4, D1 |
| Bonus | RSI higher low (divergence) | D1 on gold |
| Filter | Skip if RSI above 55 | Any timeframe |
| Exit cue | RSI near 70 or a bearish candle | Same timeframe |
Which Inverted Hammer Setup to Use When
Each setup suits a different trader and a different chart. Pick by the market you trade and how often you can look at the screen.
| Situation | Best setup | Timeframe |
|---|---|---|
| You check charts once a day | Confirmation close | D1 |
| Clear level nearby | At support | H4, H1 |
| Intraday crypto | At support | M15, H1 |
| FX majors, swing trades | Plus RSI | H4 |
| Gold, slower trades | Confirmation close | D1, H4 |
| Level and weak RSI together | Combine 2 and 3 | H4 |
- The best signals tick more than one box. A confirmed candle, on support, with RSI low and turning up, is the strongest version of all three setups at once.
- One box alone is a thin read. A lone inverted hammer with no level and neutral RSI is just a candle with a long wick.
How the Inverted Hammer Reads Across Markets and Timeframes
The candle looks the same everywhere, but its weight changes with the market and the timeframe.
| Market and timeframe | How it reads | Watch for |
|---|---|---|
| Gold (XAU/USD), D1 | Clean, slow, meaningful | Wide stops |
| Gold, H4 | Good balance | London and New York opens |
| EUR/USD, H4 | Reliable at levels | Small bounces in ranges |
| GBP/USD, H4 | Like EUR/USD, wider wicks | Raise the 2x bar |
| Bitcoin, H4 | Frequent, strong moves | Thin weekend liquidity |
| Bitcoin, M15 to H1 | Many signals, small moves | Noise, fakeouts |
| Any market, M5 and below | Mostly noise | Avoid as a trigger |
Three rules of thumb fall out of that table.
- Higher timeframe, more meaning. A daily candle reflects a full day of buying and selling. A 5-minute one reflects far less trading.
- Volatile pairs need a stricter shape. GBP/USD and Bitcoin print long wicks all the time, so ask for a shadow closer to 3x the body before you trust it.
- Ranging markets shrink the payoff. In a sideways market, the confirming candle often leads to a small drift rather than a real reversal, as the EUR/USD example showed.
Roles Beyond the Entry
Most guides stop at “buy after the inverted hammer”. The candle is useful in more jobs than that, and some of them have nothing to do with opening a long.
| Role | How you use it | Best read |
|---|---|---|
| Entry trigger | Long after a confirming close | D1, H4 |
| Warning for shorts | Tighten stops on open sells | H4, H1 |
| Exit cue for shorts | Take profit on confirmation | Same timeframe as trade |
| Higher-timeframe context | Daily inverted hammer, then H1 entries | D1 into H1 |
| Level marker | Its low becomes a reference | Any timeframe |
- The short seller’s warning. If you are short and this candle prints at support, sellers just failed to make a new low. That alone is a reason to tighten your stop.
- The multi-timeframe combo. A daily signal sets the idea, and a lower chart like the 1-hour times the entry. You get the daily candle’s weight with a tighter stop.
- The low as a level. Even if nothing happens right away, the candle’s low often becomes a line price respects later.
How to Place an Inverted Hammer Trade
Here is the full sequence, from spotting the candle to the order ticket. The numbers below are illustrative and rounded, so you can see the arithmetic rather than a result.
- Mark the context first. Confirm a prior decline, and draw any nearby support level.
- Wait for the candle to close. Run it through the checklist: shadow at least 2x the body, small body near the low, tiny lower shadow.
- Wait for the confirming close. The next candle must close above the inverted hammer’s body.
- Set the stop. Place it a few pips below the inverted hammer’s low, or below the support level if that sits lower. A pip is the smallest standard price step; on EUR/USD it is the 4th decimal, 0.0001.
- Set a target. Aim for at least twice the risk, which traders write as a risk/reward of 1:2. The first number is the risk, the second the reward, as the risk-reward ratio guide explains.
- Size the position so a stop-out costs 2% of the account (worked below).
- Place the order. A buy at market after the confirming close, with the stop-loss and take-profit fields filled in before you click.
Worked sizing example on EUR/USD
Take a $1,000 account and a 4-hour signal on EUR/USD, with illustrative round numbers.
| Step | Value |
|---|---|
| Entry (after confirming close) | 1.1810 |
| Stop (below hammer low) | 1.1790 |
| Stop distance | 20 pips |
| Target at 1:2 | 1.1850 (40 pips) |
| Risk budget, 2% of $1,000 | $20 |
| Position size | 0.10 lot (a lot is the standard trade size; 10 micro lots, and a micro lot is 0.01 lot) |
The arithmetic, step by step:
- Risk budget: $1,000 × 2% = $20.
- Risk per pip allowed: $20 ÷ 20 pips = $1 per pip.
- Lot that matches: on EUR/USD, 0.01 lot (a micro lot) moves about $0.10 per pip, so $1 ÷ $0.10 = 10 micro lots = 0.10 lot.
- If the target hits: 40 pips × $1 = +$40, or +4% of the account. If the stop hits, −$20, or −2%.
- Leverage check: 0.10 lot controls about $11,800 of euros, roughly 1:12 on a $1,000 account. Broker leverage of 1:100 or more is only margin headroom that lets you open that size; the 2% risk already caps what you can lose.
The gold small-account catch
Gold is popular with small accounts, but a daily signal often needs a wide stop. On the gold chart at the top of this guide, the distance from a confirming close near 2622 down to the inverted hammer’s low near 2587 is about $35.
- The smallest gold position is 0.01 lot (1 ounce). At that size, every $1 move in gold is $1 of profit or loss.
- A $35 stop at 0.01 lot = $35 of risk. That is 3.5% of a $1,000 account, above the 2% rule.
- Account needed for 2%: $35 ÷ 2% = $1,750.
- The fix on a smaller account: use the 4-hour or 1-hour gold chart, where candles are shorter and stops tighter. Or trade the setup on EUR/USD, which sizes down to 0.01 lot cleanly.
You need a broker that offers 0.01-lot sizing for these numbers to work on a small account.
For the general method behind these steps, the position sizing guide walks through more markets.
Setting it up on TradingView or MetaTrader
The pattern needs no indicator, only candles. For Setup 3 you need one built-in indicator.
- TradingView (free): open the chart, type the ticker (XAUUSD, EURUSD or BTCUSDT), click Indicators, search “Relative Strength Index”, and keep length 14 with the default 70 and 30 lines.
- MT4 / MT5: Insert → Indicators → Oscillators → Relative Strength Index, period 14, and add level lines at 30 and 70.
- Trap to avoid: TradingView lists several community scripts with “RSI” in the name, some smoothed or with extra signals. Pick the built-in “Relative Strength Index” so your line matches the one in the EUR/USD example.
Discipline Around a One-Candle Signal
A one-candle signal is a small piece of evidence, so expect it to fail regularly. Treat each signal as one piece of evidence; even a clean setup fails often, so judge it over many trades, not one.
- Expect streaks of failed signals. If three to six in a row fail on the same market, it may have shifted into a strong trend or a messy range. Pause and look at the bigger chart before taking the next one.
- Don’t chase a missed confirmation. If the confirming candle ran far above the inverted hammer before you saw it, the stop is now too far away for the 2% rule. Let it go; another one will print.
- Don’t double up after a loss. One stop-out says nothing about the next signal. Keep the same 2% every time.
- Only trade money you can afford to lose. One candle shape is a probability tool, not a promise.
When the Inverted Hammer Fails
The candle fails in predictable places. Knowing them filters out most of the bad signals.
- In a strong downtrend. One candle rarely stops a heavy, news-driven fall. If price keeps making big red candles, the inverted hammer is often a pause, not the bottom.
- In the middle of a range. With no decline to reverse and no level to defend, the shape means very little.
- Without confirmation. The candle closed near its low, which means sellers still won that session. Acting on it alone is buying into a failed rally.
- When the confirming candle closes weak. A small green candle that barely clears the body is a thin answer to the question the inverted hammer asked.
- On very low timeframes. On a 1-minute or 5-minute chart, long upper wicks print constantly and mean almost nothing.
Common Mistakes
- Calling every long-wick candle a reversal, without checking for a prior decline.
- Mixing it up with a shooting star, which is the same shape after a rally.
- Buying before the candle has even closed.
- Skipping the confirming candle because the shape “looks perfect”.
- Putting the stop inside the inverted hammer’s range, where normal noise will hit it.
- Expecting a strict RSI-under-30 reading, then forcing trades when RSI is neutral.
- Using tick volume on gold or Forex as if it were real traded volume.
What Works: The Short Version
If you keep three things about the inverted hammer candlestick, make it these.
- Location first. It needs a prior decline, and it works best on a support level you drew in advance.
- Wait for the answer. The inverted hammer is the question; the confirming close above its body is the signal.
- Add one helper, size it right. Pair it with a level or a low, rising RSI 14. Put the stop below the inverted hammer’s low and risk 2% per trade.
If you want more candles that do the same job at a bottom, the bullish candlestick patterns guide lines up the inverted hammer next to the engulfing and the morning star.
Glossary
- Inverted hammer: a candle after a decline with a long upper shadow, a small body near the low and almost no lower shadow.
- Body: the thick part of a candle, between the open and the close.
- Shadow (wick): the thin line above or below the body, marking the session’s high or low.
- Confirmation: a following candle that closes above the inverted hammer’s body.
- Support: a price area where buyers stepped in before, often halting a fall.
- RSI 14: the Relative Strength Index over 14 candles, a 0 to 100 momentum gauge.
- Oversold: RSI below 30, meaning selling has been heavy recently.
- Bullish divergence: price makes a lower low while RSI makes a higher low.
- Risk/reward 1:2: a trade that aims to make twice what it risks.
- Lot: the trade size unit; 0.01 lot is a micro lot.
- Pip: the smallest standard price step in Forex; on EUR/USD it is the 4th decimal, 0.0001.
- Spinning top: a small-bodied candle with long shadows on both sides, read as indecision.
FAQ
What is an inverted hammer candlestick, in plain terms?
It is a single candle that appears after a price decline, with a small body near the bottom, a long upper shadow and almost no lower shadow. It shows buyers pushed price up during the session, even though sellers pulled it back by the close. Traders read it as a sign that selling is running out of steam, and they wait for the next candle to close higher before acting.
Is an inverted hammer bullish or bearish?
Bullish. It appears after a decline and hints the fall may be ending, but it needs a higher close on the next candle to confirm.
What is the difference between an inverted hammer and a shooting star?
The shape is the same: small body near the low, long upper shadow. The difference is location. An inverted hammer prints after a decline and is a bullish warning. A shooting star prints after a rally and is a bearish one. If you can't tell whether the market was falling or rising before the candle, you can't name the candle, which is why traders mark the trend first.
Does a red inverted hammer still count?
Yes. A green body, where the close is above the open, is slightly stronger, but a red inverted hammer is still valid if the shape and location are right. With a red body the confirming candle matters even more, because sellers technically won the session. Many textbook examples on real charts are red-bodied.
How do you confirm an inverted hammer?
Wait for the next candle to close above the inverted hammer's body. A stricter version waits for a close above the top of the upper shadow, which filters out more false starts but enters later. Extra weight comes from the candle sitting on a support level you drew in advance, or RSI 14 sitting low and turning up. A close below the hammer's low cancels the idea.
What is the best timeframe for the inverted hammer?
The daily and 4-hour charts give the most meaningful signals, because each candle reflects a lot of real trading. On gold and the Forex majors those are the core reads. The 1-hour and 15-minute charts print far more inverted hammers, especially on Bitcoin, but the moves are smaller and noise is higher. Below 15 minutes the shape means very little.
Where do you put the stop-loss on an inverted hammer trade?
A few pips below the inverted hammer's low, or below the support level if it sits lower. A break of that low means sellers made a new low after all, so the reversal idea has failed.
Is the inverted hammer stronger than the hammer?
Usually the hammer reads a little stronger. A hammer shows buyers rejecting lower prices and winning the close, while an inverted hammer shows buyers trying higher and failing to hold it. That is why the inverted hammer leans harder on confirmation. In practice, location and the confirming close matter more than which of the two you got.
How much money do I need to trade an inverted hammer setup?
On EUR/USD, a few hundred dollars works, since 0.01 lot risks only about $0.10 per pip. Gold on the daily chart is harder: a typical $35 stop at the minimum 0.01 lot needs about $1,750 to keep the risk at 2%. Smaller accounts can use the 4-hour or 1-hour gold chart, where stops are tighter, or stick to the major currency pairs. Whatever the size, only trade money you can afford to lose.
Real-time trade setups with entry, stop loss and take profit. Daily market analysis. No subscription, no complicated theory.
🌍 Our recommended brokers


Reader Reviews
Be the first to review this — tell other traders what actually helped, or where it fell short.
Leave a Review

Momentum Trader & Technical Analyst
Trades momentum across crypto and forex since 2019, built around RSI, MACD, and volume. Turns discretionary setups into rule-based, systematic entries and validates them on data before they go live.
