What a Wedge Actually Is
A wedge is two converging trendlines. That one fact separates it from the patterns it gets confused with:
- A flag is a parallel channel, the two lines running side by side.
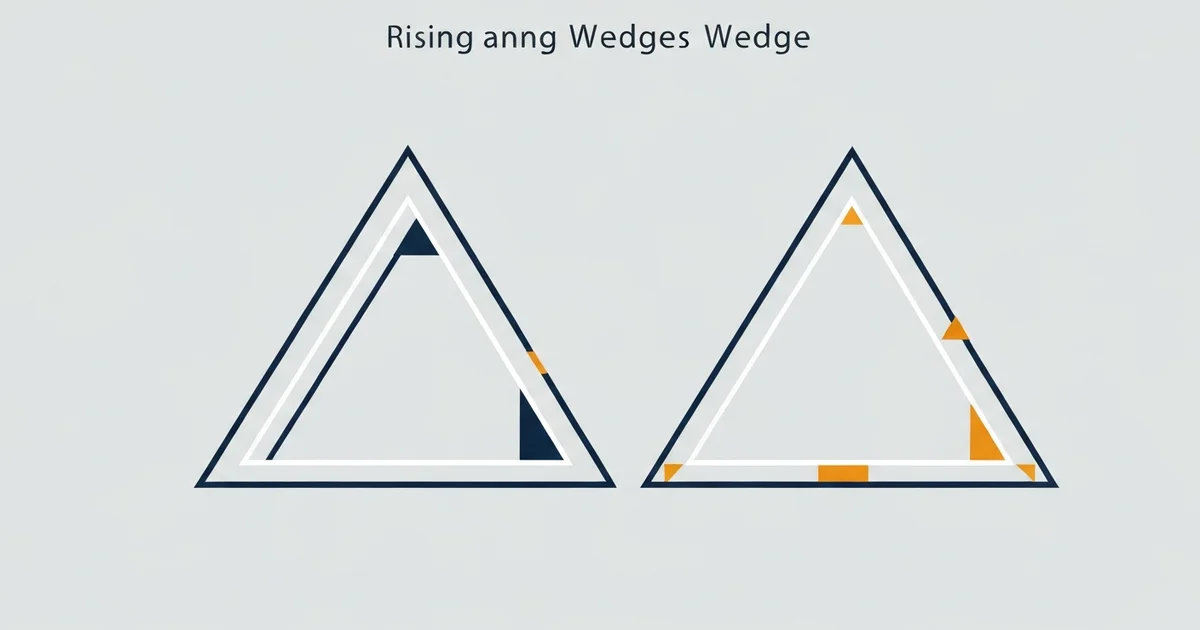
- A triangle has one rising line and one falling line meeting at a point.
- A wedge is the odd one out: both lines tilt the same way, but one tilts harder, so the channel squeezes shut.
That gives you the two versions. In a rising wedge pattern both lines point up and the lower one climbs faster, choking price against the ceiling until it gives way downward. In a falling wedge pattern both lines point down and the upper one drops faster, drying up the selling until price pops out the top.
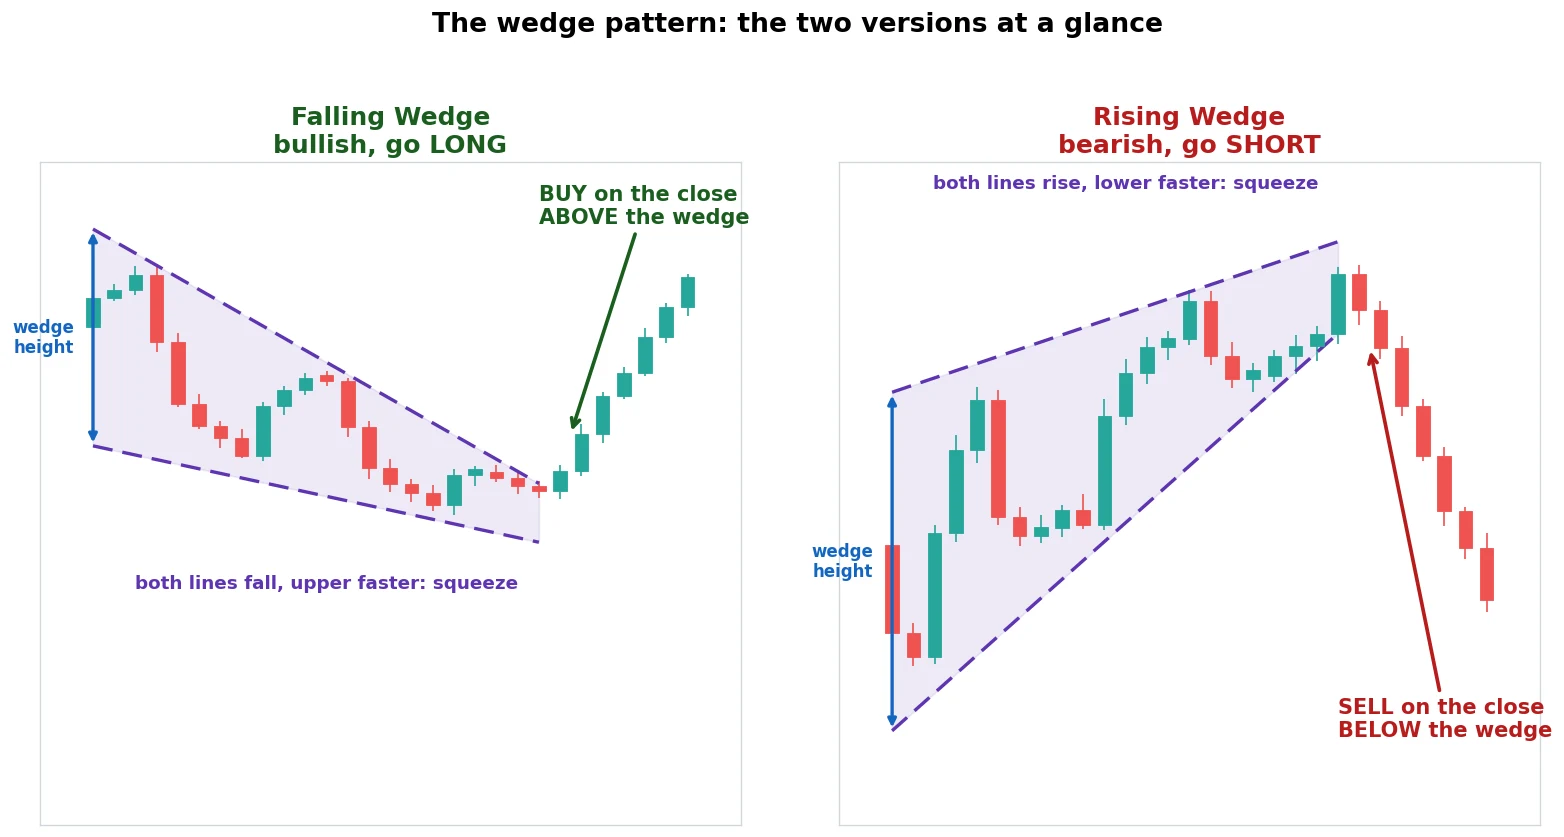
Keep both pictures in your head. The falling wedge slopes down and you buy the break above it. The rising wedge slopes up and you sell the break below it. The direction of the wedge and the direction of the trade are opposite, every time, and that is the detail beginners get backwards.
Eight years on an FX desk teaches you two things about wedges. They show up on almost every chart you will ever trade, and most of the breakouts are traps. The whole job is telling the few that pay from the many that do not. So rather than repeat the textbook, I tested it.
The Anatomy of One Real Trade
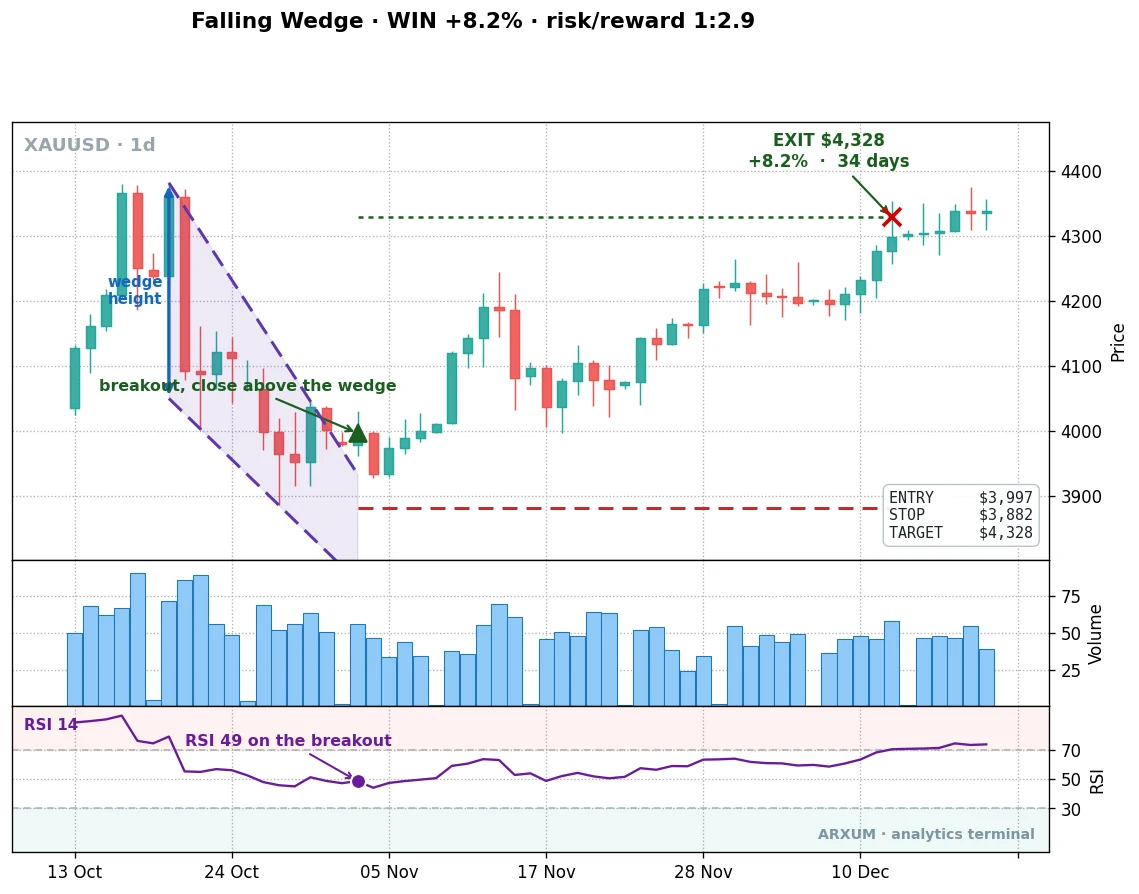
Before the numbers, one trade, so the rest of the article has something concrete to hang on. This is a falling wedge on gold’s daily chart.
Read it left to right:
- Price sells off, then the selling loses steam. Each new low is only a little lower than the last, while the highs come down faster, so the two lines pinch together.
- That pinch is the signal. It means sellers are running out of supply even though the chart still looks weak.
- The entry is the first daily close back above the upper line.
- The stop sits below the wedge low, where the pattern would be plainly wrong.
- The target is the wedge height, the distance between the two lines at their widest, projected up from the breakout.
That trade entered near 3,997 dollars, stopped at 3,882, targeted 4,328, and reached it in a few weeks for a gain of about 8 percent. One clean example. Now the question that decides everything: where does this repeat, and where does it just look pretty and fail?
How to Draw the Wedge, and Tell It From a Triangle
Drawing the lines is where most people go wrong, so here is the exact method.
- Upper line: connect the reaction highs, the peaks where price turned back down. You need at least two of them.
- Lower line: connect the reaction lows, the troughs where price turned back up. Again, at least two.
- Both lines must lean the same way. Down for a falling wedge, up for a rising one. If one line is flat, or they lean in opposite directions, it is not a wedge.
- They must converge. The gap between the lines has to be narrowing. If they run parallel, you have a channel, not a wedge, and the odds are different.
The fastest way to keep the family straight:
- Wedge: both lines tilt the same direction and converge. It leans against its own trend.
- Channel or flag: both lines parallel. A pause inside a trend, not a reversal.
- Triangle: one line flat or rising, the other flat or falling, meeting at a point. An ascending or descending triangle has one horizontal line; a symmetrical triangle has one of each.
If you cannot put two clean touches on each line, you do not have a wedge yet. Wait for the structure to finish, or skip it. A wedge you have to force onto the chart is a wedge that will not pay, and that is exactly the trap on the markets where this pattern fails.
Where the Wedge Actually Pays
I ran the same detector, with the same rules, across gold, the euro, the pound, and Bitcoin. Frequency was never the issue: wedges formed everywhere. Gold produced the most at 68 over eight years and Bitcoin 59 over six, with the euro and the pound forming a couple of dozen each. Anyone who tells you wedges are rare on Forex is drawing them too strictly.
Forming is not the same as paying. This is profit factor by market, which is simply dollars won per dollar lost.
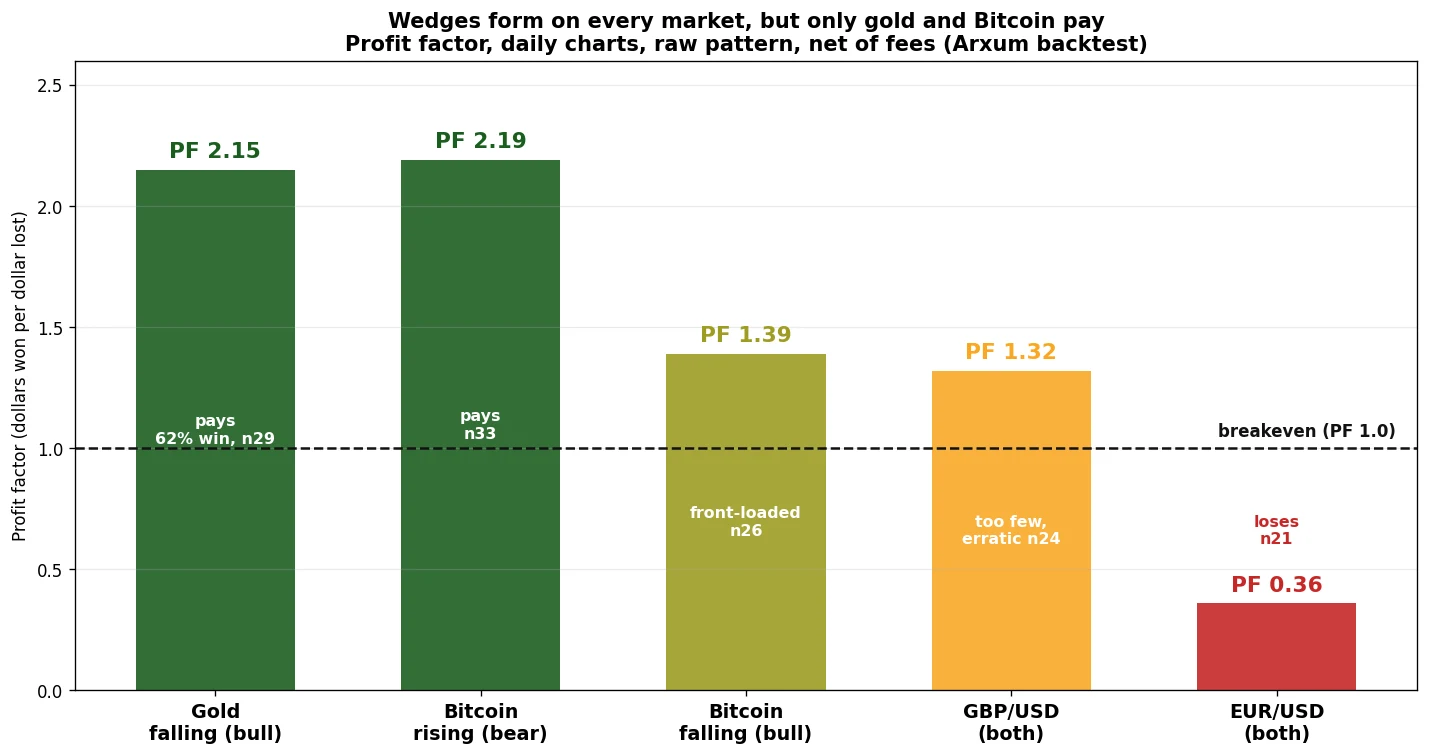
The split is clean:
- Gold, falling wedge: profit factor 2.15, winning 62 percent of trades. The best of the set.
- Bitcoin, rising wedge: profit factor 2.19. The bearish side, and the standout on crypto.
- Bitcoin, falling wedge: profit factor 1.39, but front-loaded to one bull market (more on that below).
- The pound: marginally positive, but on only 24 trades split awkwardly across the years, too thin to lean on.
- The euro: profit factor 0.36. The wedges form, the breakouts come, and they lose.
So the headline is not “wedges work” or “wedges don’t.” It is that the same pattern is a genuine edge on gold and a coin flip that bleeds fees on the euro. What you trade matters more than how well you draw the lines.
The Setup That Pays Best: Gold
The falling wedge on gold’s daily chart is the one I would actually trade. The rules are the ones from the anatomy chart: enter on the daily close above the upper trendline, stop below the wedge, target the wedge height projected up.
Here is what 1,000 dollars does on it, risking 2 percent of the account per trade.
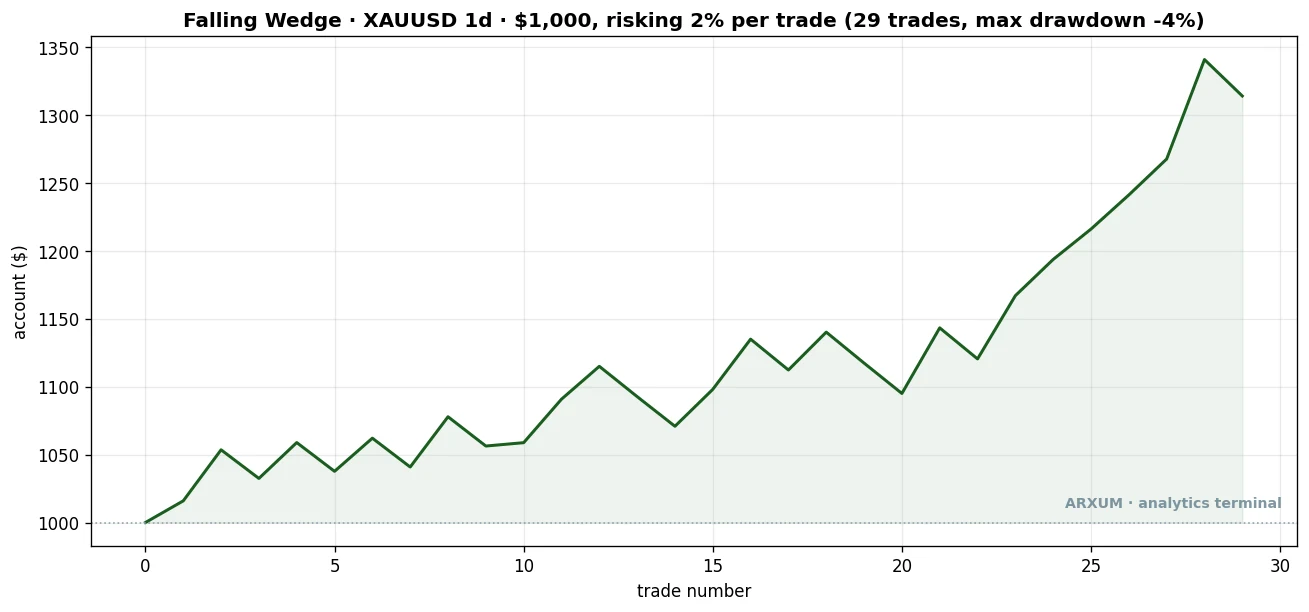
| Trades | 29 |
| Win rate | 62% |
| Profit factor | 2.15 |
| Reward-to-risk | 1:2.6 |
| Total return | +41.5% |
| Max drawdown | −10.9% |
| $1,000 at 2% risk | → $1,314 |
Two things make this one trustworthy. The win rate and the reward-to-risk (how many dollars each winning trade makes for every dollar a losing one costs you) are both on your side at once, which is rare, and the worst peak-to-trough dip along the way, the drawdown, stayed shallow at about 11 percent (that is how far the account fell from a high before recovering). And the edge does not lean on ancient history, which brings up the test that matters most.
Does It Hold Up Out of Sample?
A backtest that only looks good on its own history is worthless. So I split gold’s trade history in two: the trades up to mid-2022 to build the case, and everything after, which the pattern never “saw,” to test it. An edge that survives that cut is one you can trade with real money.
| Gold falling wedge | trades | profit factor |
|---|---|---|
| Built on 2018 to 2022 | 14 | 1.54 |
| Tested on 2022 to 2026 (never seen) | 15 | 2.72 |
The edge did not fade out of sample. It got stronger, from a profit factor of 1.54 to 2.72 on data it was never fit to. That is the opposite of the usual overfit story, and it is the single best reason to take this setup seriously.
Bitcoin’s rising wedge passed the same test more modestly, holding a profit factor of 1.93 on recent data. Bitcoin’s falling wedge did not: it looked great on the 2020 to 2023 bull run and then dropped below breakeven afterward. That is exactly why the out-of-sample split exists, and why I would trade the gold falling wedge and the Bitcoin rising wedge but leave the Bitcoin falling wedge alone.
Even Gold’s Wedge Loses Sometimes
A 62 percent win rate means almost four trades in ten are losers, and skipping past that would be the dishonest part. Here is one of those losses, on gold.
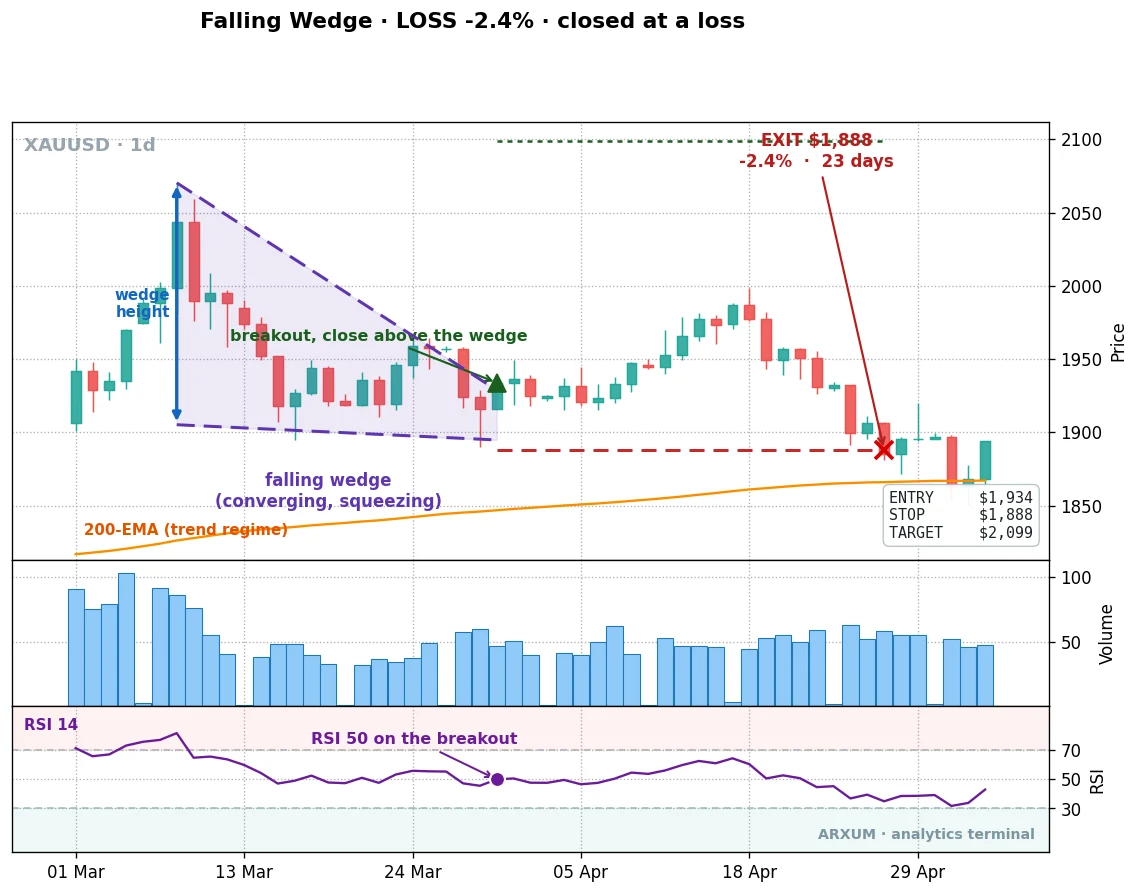
The setup was textbook. The lines converged, the close pushed above the upper trendline, the entry triggered. Then price rolled back through the wedge and hit the stop. Nothing was misread, nothing was drawn wrong. It was a good trade that lost.
That is the trade you have to be able to take without flinching, because the edge is built on these losses, not in spite of them. The profit factor of 2.15 is really a statement about the losers: they stay small. Widen a stop to “give a losing trade room” and you are not managing risk, you are quietly turning the math negative. The win rate only pays if every loss is the size you planned for.
If You Trade Forex, Read This Part
Most people reading this trade currency pairs, not gold futures or Bitcoin. I am not going to tell you to go away, but I am going to be straight about what the data showed.
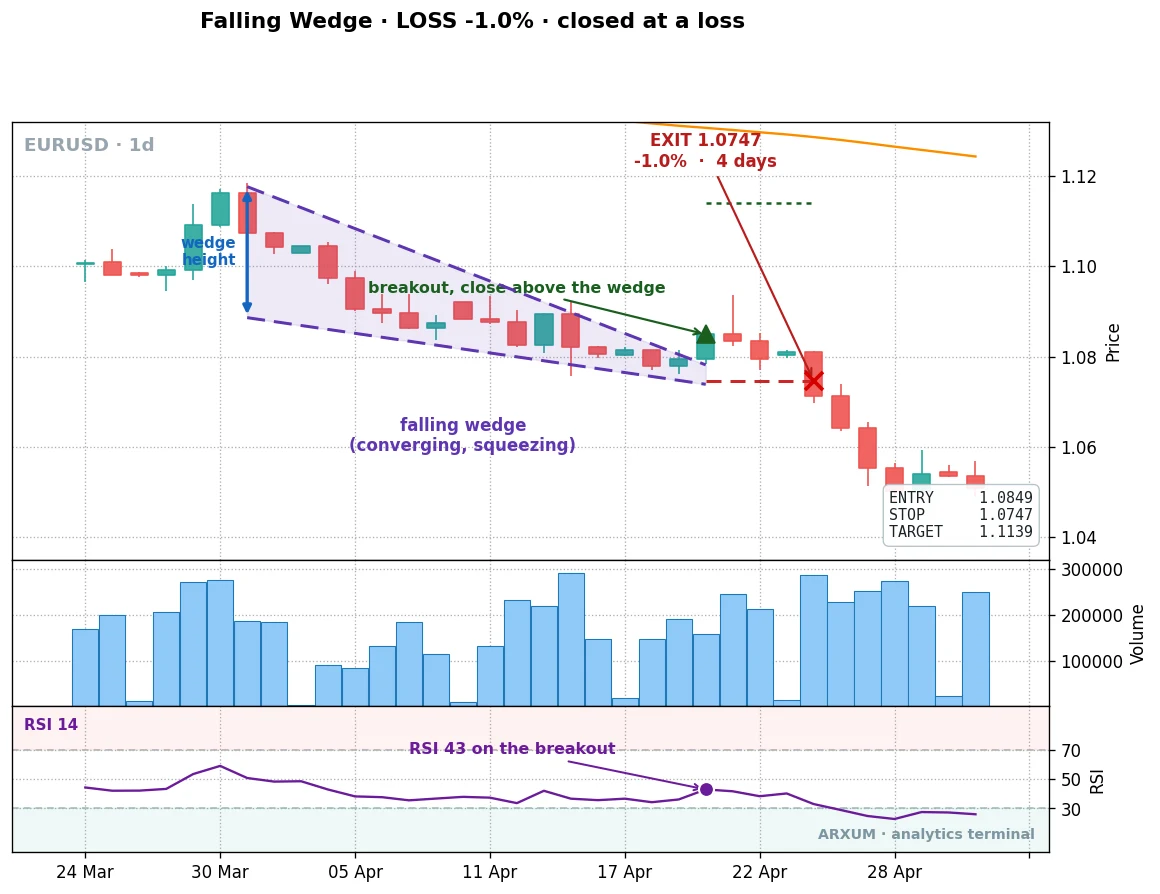
Wedges form on the euro and the pound constantly. You are not imagining them. The problem is the breakout:
- On the euro, the falling wedge won just 1 trade in 10 and the whole sample lost money. The breakouts were mostly false: price popped above the line, tripped the entry, and rolled back over.
- On the pound, the numbers were marginally positive but came from only a couple of dozen trades that behaved completely differently in the first half of the data than the second. That is noise, not an edge.
Why would the same pattern pay on gold and fail on the euro? The likeliest reason is that currency pairs mean-revert hard around their averages, so a wedge breakout gets sucked back into the range before the measured move can play out. Gold and Bitcoin trend in longer, cleaner pushes, which is what a measured-move target needs.
So if you trade Forex, here is the honest takeaway, not a brush-off:
- Treat a currency-pair wedge as a low-confidence setup. Demand extra confirmation: the higher-timeframe trend pointing the same way as your trade, or a clear momentum push on the breakout candle, not a limp close just past the line. (By the trend I mean the 200-day moving average: price above a rising 200-day line is an uptrend, below a falling one is a downtrend. Take the breakout that agrees with it.)
- Cut it fast. These fail by snapping back, so a tight stop just past the wedge saves you the worst of it.
- Or trade the wedge where it works. Gold trades on every Forex platform and through the same hours you already watch. The falling wedge on gold is the highest-quality version of this exact pattern, and it is one click away from your EUR/USD chart.
That is the part the pattern guides leave out. The wedge is not useless to a Forex trader, but on the majors it is a setup to respect cautiously, and gold is where the same skill actually gets paid.
Trading the Bearish Side: Bitcoin
The rising wedge pattern is the bearish one, and Bitcoin is where it shines. The mechanics mirror the falling wedge exactly:
- Price grinds higher in a narrowing channel, the lower line rising faster than the upper.
- Momentum fades under the surface even as the highs creep up.
- The entry is the first close below the lower line; the stop goes above the wedge high; the target is the wedge height projected down.
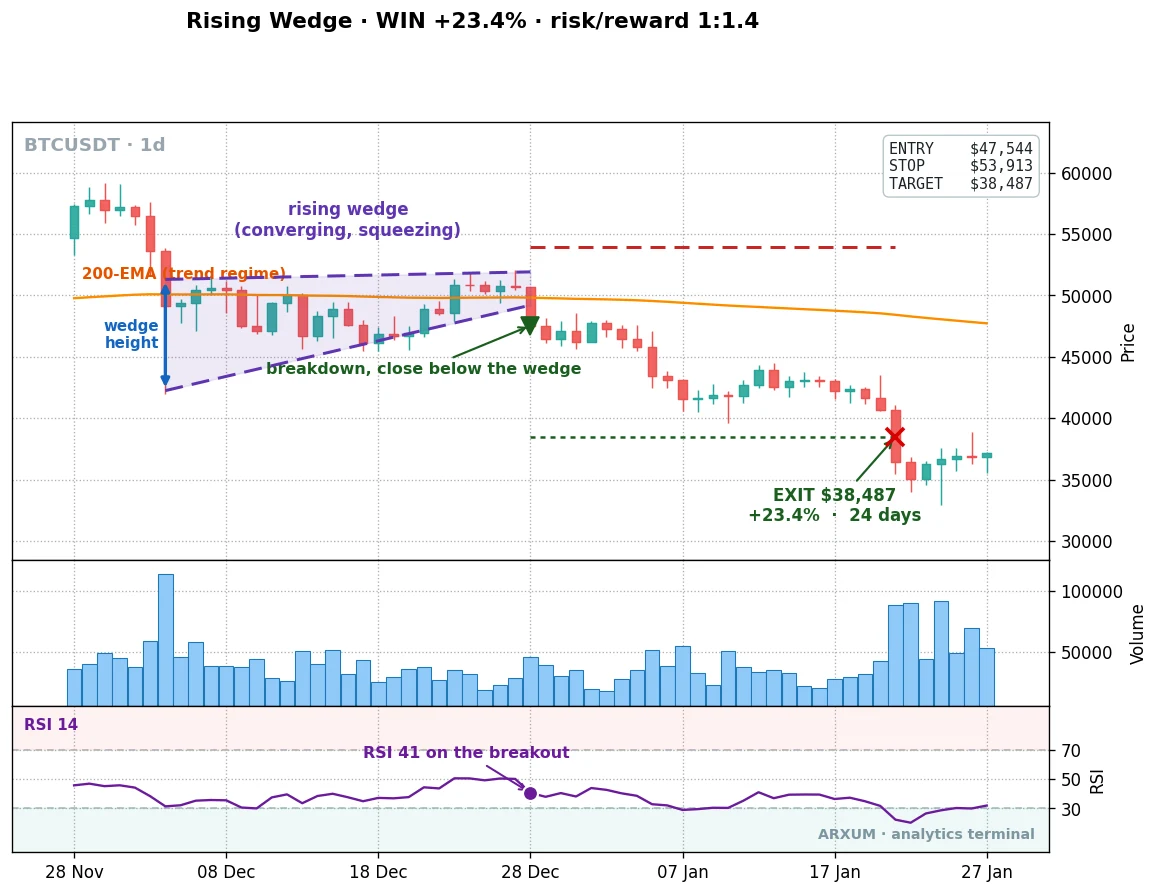
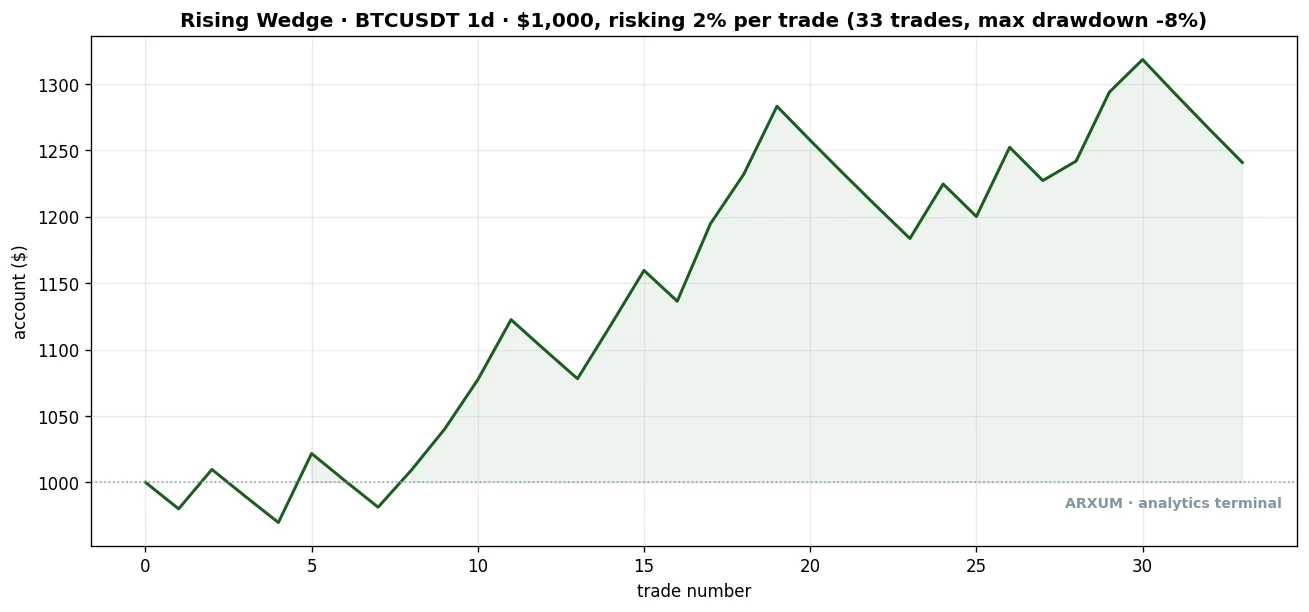
| Trades | 33 |
| Win rate | 48% |
| Reward-to-risk | 1:2.4 |
| Profit factor | 2.19 |
| Total return | +122% |
| Max drawdown | −22.3% |
| Out-of-sample profit factor | 1.93 |
It wins less than half the time, which feels wrong until you see the reward-to-risk: the winners run to a measured target while the losers stop out quickly, so the math comes out well ahead. It is the natural hedge to the gold setup, a clean way to be short the top of a Bitcoin run rather than guessing at it.
The best place to hunt one is after a long, tiring Bitcoin advance. The daily candles are still printing higher highs, but each push is smaller than the last and the lows are catching up from below. That is the rising wedge forming, and it is the market quietly telling you the buyers are getting exhausted even while the price line still points up.
You are not calling a top out of thin air. You wait for the structure to break and let the close below the lower line commit you.
The discipline mirrors the gold side: stop just above the wedge, target the wedge height projected down, and do not short the squeeze early just because it “looks toppy”. Toppy can grind higher for weeks. The breakout is the trade, not the feeling.
How to Size the Trade
The measured move and the stop give you everything you need to size a position before you risk a dollar. Take the gold (XAU/USD) trade from the top of the article.
Most brokers quote gold in dollars per ounce and size it in lots: one standard lot is 100 ounces, one micro lot is one ounce. Whatever the unit on your platform, the rule is the same. Fix what you are willing to lose, and let the stop distance decide the size.
The stop and target set your risk and reward per ounce:
- Risk is the entry minus the stop: 3,997 − 3,882 = 115 dollars per ounce.
- Reward is the target minus the entry: 4,328 − 3,997 = 331 dollars per ounce.
Now decide what the trade may cost you, not how many lots to buy. Say you will risk 100 dollars. Divide that by the per-ounce risk:
100 ÷ 115 = about 0.9 of an ounce, which on most platforms is one micro lot.
If the stop hits you lose roughly 100 dollars; if the target hits you make about 290. That works out to about 1 to 2.9 on this particular trade, a shade better than the 1 to 2.6 the gold setup averages, and it is what makes the pattern pay even when it is wrong four times in ten.
Two honest notes on the numbers above. First, the 100 dollars is only there to keep the arithmetic round. The real rule is 2 percent of your account, which on a 1,000 dollar account is 20 dollars, not 100. Treat 2 percent as your ceiling and size down to it. Second, gold’s stops are wide in dollar terms, so a 20 dollar risk on this trade is actually smaller than the minimum micro lot most brokers allow. That is the small-account reality: use a broker that offers micro or cent lots, trade a smaller-priced market if you cannot, and never widen the stop just to justify a bigger position.
And to actually place it, in three clicks on any platform:
- Entry: set a buy-stop order at the breakout price (here 3,997). A buy-stop only fills if price trades up to it, so you are not in the trade until the wedge actually breaks. You can also just buy at market on the daily close above the line if you are watching.
- Stop-loss: in the order’s stop field, type 3,882 (below the wedge). The platform closes the trade there automatically if it goes wrong.
- Take-profit: in the target field, type 4,328 (the wedge height projected up). Set the size to the lot you worked out above, and you are done. The trade now manages itself: it either fills, stops, or targets without you watching the screen.
The Honest Weaknesses
Two things to know before you go hunting wedges.
First, it is a low-frequency setup. The gold falling wedge gave about three or four trades a year. It is a sniper’s pattern, not an income stream, and the biggest practical danger is boredom: with so few real signals, traders force marginal ones, which is the fastest way to give the edge back.
Second, it is market-specific in a way most patterns are not. The same wedge that pays on gold loses on the euro. You cannot learn this setup once and apply it everywhere; you have to respect where the data says it works and stay disciplined about skipping it where it does not.
One thing you do not need to worry about: volume. The popular advice to wait for a volume spike on the breakout does nothing here, because a wedge breaks out on exhaustion rather than a thrust. I tested it, it added no edge, so the method above does not use one. Less to watch, not more.
Three Ways Traders Blow This Setup
The losses that are not “good trades that lost” almost always come from one of these.
- Forcing the lines. If you have to stretch the trendlines to make a wedge appear, there is no wedge. Two clean touches on each line, both converging, or you pass. A drawn-on wedge has no edge, which is most of why the euro version fails: the shape is there, but loosely, and a loose wedge is just noise.
- Entering inside the wedge. The signal is the close beyond the trendline, not the squeeze itself. Buying a falling wedge before it breaks out, on a hunch it is “about to go”, is how you get caught when it breaks the other way. Wait for the close. The pattern tells the story; the breakout opens the trade.
- Trading it everywhere because it looks the same. A wedge on the euro looks identical to a wedge on gold. The chart cannot tell you the odds; only the testing can, and the testing says they are not the same trade. Knowing the pattern is half of it. Knowing the market it pays on is the other half.
The Method on a Matchbox
Strip it all away and the tested wedge method fits in three lines:
- Trade it where it pays. The falling wedge on gold’s daily chart (bullish, 62 percent win rate, stronger out of sample) and the rising wedge on Bitcoin’s daily chart (bearish). Treat currency-pair wedges as low-confidence, or trade gold instead.
- Enter on the close beyond the wedge, stop past the structure, target the wedge height. Ignore volume; the breakout is quiet by nature.
- Be patient and be selective. A few good trades a year, only on the markets the data rewards. Forcing the setup elsewhere is how the edge dies.
That is the pattern. Not a setup for every market, but on the ones where it works, a genuine edge that survived the only test that matters: data it had never seen.
FAQ
Is a rising wedge bullish or bearish?
What is the difference between a wedge and a triangle?
Do wedges work on Forex pairs?
Which market is best for trading wedges?
Where do I put the target?
Should I wait for a volume spike to confirm the breakout?
How do I draw the trendlines correctly?
How many wedge trades should I expect in a year?
🌍 Our recommended brokers
Reader Reviews
Be the first to review this — tell other traders what actually helped, or where it fell short.
Leave a Review

Forex Analyst & Senior Trader
Former FX desk trader with 8 years in institutional forex. Works in multi-timeframe analysis and order flow, turning desk experience into systematic, testable rules across forex and metals.