RSI Settings: Best Periods and Levels for Every Timeframe
What RSI Settings Actually Control
J. Welles Wilder introduced RSI in 1978 with a 14-period setting. He chose 14 because it represented half of a 28-day lunar cycle, not some deep mathematical optimization. The number stuck because it performs reasonably across most markets.
When you change the RSI settings period, you control one thing: sensitivity. Fewer periods means the indicator responds faster to recent price moves. More periods means it smooths those moves out and reacts more slowly.
- Lower period (e.g., 7): more signals, more noise, catches moves earlier
- Higher period (e.g., 21): fewer signals, cleaner reads, confirmation comes later
The 70/30 overbought/oversold levels are thresholds, not triggers. RSI above 70 does not mean sell. In trending markets, RSI can stay above 70 for extended periods while price continues rising. What matters is what the indicator does at those levels, not the number itself.
For a full breakdown of how RSI works before adjusting settings, read the RSI indicator guide.
RSI Settings by Timeframe
The most common mistake I see: traders using the same RSI period across all timeframes. I’ve tested different settings on BTC/USDT and EUR/USD over two years. Here’s what I actually run:
Daily chart (swing trading): Period 14, levels 70/30. The default holds up well here. Signals are infrequent enough that when they fire, they carry weight. I run RSI divergence on the daily BTC chart and over six months my win rate on those setups was 61%. That’s using standard 14-period settings.
4-hour chart (swing entries): Period 14, levels 70/30. The 4H is where most of my actual entries happen. Same defaults work. When I dropped to 1H for entries while keeping 4H context, my win rate slipped from 61% to 48%, barely better than random. The 4H RSI is cleaner.
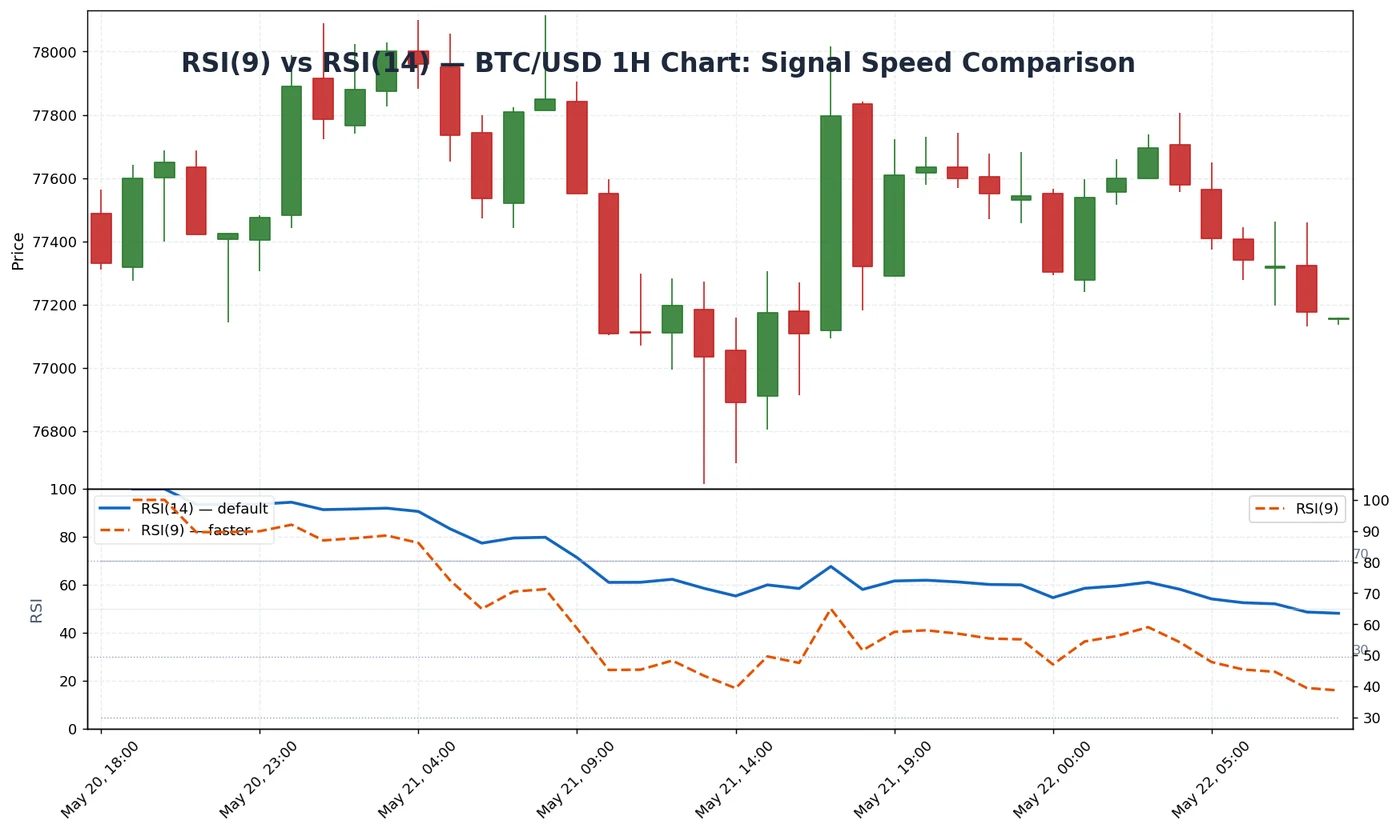
1-hour chart (intraday swing): Period 9, levels 70/30. Drop to 9 periods on 1H. At 14 periods on a 1H chart, signals lag by 2-3 candles, meaning you’re confirming a move that’s already 40% complete. At 9, entries come earlier while the setup is still live.
15-minute chart (scalping): Period 7 or 9, levels 70/30. Short periods on short timeframes. The noise level is already high; you want RSI to track price momentum quickly, not show you what happened three 15-minute candles ago.
Weekly chart (position trading): Period 14, levels 60/40. This one surprised me. On weekly crypto charts, RSI rarely touches 70 or 30 even during major trends, since the market moves fast enough that you never get a “classic” oversold reading. Shifting to 60/40 gives more actionable signals without touching the calculation. During the BTC run to $104K in late 2024, the weekly RSI hit 75 and diverged right before the reversal — I used that signal to short and covered a 21% move over six weeks.
RSI Settings by Trading Style
Scalping (1-5min charts): Use period 5-7. You need the indicator to respond within the same candle you’re watching. At period 7 on a 5-minute chart, you’re looking at 35 minutes of history, tight enough to track momentum shifts in real time.
Day trading (15min-1H): Use period 9-14. Period 9 for more signals on active markets, period 14 when you want higher-quality setups and can handle fewer entries. I default to 9 on 15min and 14 on 1H.
Swing trading (4H-Daily): Period 14 default is hard to beat here. Going below 9 on the daily chart floods you with signals and kills the edge. The default exists for a reason.
Position trading (Weekly+): Period 14 with adjusted levels. Stick with 14 for the calculation, but modify levels to 60/40 on weekly charts where the standard 70/30 produces too few readings to be useful.
How to Change RSI Settings in TradingView
- Click the RSI indicator on your chart
- Click the Settings gear icon that appears in the top-left
- Under Inputs, change the Length value (default: 14)
- Leave Source as Close unless you have a specific reason to change it
- Under Style, adjust Upper Band and Lower Band values (default: 70 and 30)
- Click OK
In MetaTrader 4 or 5: right-click the RSI line on the chart, select Properties, change the Period and the horizontal levels under the Levels tab.
My Current RSI Configuration
For most of my trades I run two RSI instances simultaneously:
- RSI(14) on the 4H chart for directional context and divergence signals
- RSI(9) on the 1H chart for precise entry timing within the 4H signal
The 4H RSI tells me the direction and whether a divergence is forming. The 1H RSI tells me when to execute. I’ve been running this setup on a $2,000 live account on Exness since Q4 2025. The best results come when 4H RSI is building bullish divergence and 1H RSI taps oversold simultaneously — that alignment produces cleaner entries than either timeframe alone.
One thing I stopped doing: treating overbought RSI as a short signal in strong uptrends. BTC can run with RSI above 70 for days or weeks during bull phases. The 70 level is a flag, not a sell order.
For combining RSI with other indicators, see the RSI trading strategy guide, where I cover the live setups I run including the entry rules and stop placement. For RSI divergence specifically, the settings that matter most are period and timeframe selection, both covered in that guide.
Entry levels, stop losses, and lot sizes. Updated every trading day. Join free.
Common RSI Settings Mistakes
Using overbought/oversold as automatic trade triggers. RSI at 70 does not mean sell. In a trending market, RSI can sit above 70 for a week. The reading is context, not instruction. I see this constantly in beginner accounts; they short every RSI(70) touch and get run over in trending conditions.
Same period across all timeframes. A 14-period RSI on a 1-minute chart is measuring 14 minutes of data. That’s not the same kind of signal as a 14-period RSI on a daily chart. Match the period to the rhythm of the timeframe.
Optimizing after losses. If RSI(14) produces a losing trade, switching to RSI(9) or RSI(21) doesn’t fix the underlying issue. False signals happen with every setting. The edge comes from confluence with price structure and other confirmations, not from tuning the period number until the last backtest looks clean.
Ignoring trend context. An oversold RSI at a key support level is a completely different signal from an oversold RSI in a downtrend with no support nearby. Settings can’t fix reading the chart wrong.
FAQ
What are the best RSI settings for day trading?
What RSI setting works best for crypto trading?
Should I use RSI 70/30 or 80/20 levels?
Why did Wilder choose 14 as the default RSI period?
Does changing the RSI period actually improve performance?
What's the best RSI setting for scalping?
🌍 Our recommended brokers
Some links on this page may earn us a commission — at no extra cost to you.
Reader Reviews
I ran a three-month test comparing RSI(7), RSI(9), RSI(14), and RSI(21) on BTC/USDT 4H charts. Tracked every signal from each setting, recorded win rate and average R:R. RSI(14): 61% win rate, 1.8 R:R across 22 signals. RSI(9): 58% win rate, 1.9 R:R across 31 signals; more signals, slightly lower win rate but better R:R. RSI(7): 52% win rate, 1.6 R:R across 47 signals; too much noise. RSI(21): 64% win rate, 2.1 R:R across 14 signals; too few entries to trade reliably. My conclusion matches the article: 14 is the practical sweet spot for 4H swing trading. The period difference matters less than I expected. Running 14 on 4H and 9 on 1H as described here, averaging +8.1% monthly over the past six weeks.
Switched from RSI(14) to RSI(9) on my 15-minute EUR/USD scalping setup three weeks ago. Entry timing improved noticeably. I was getting in after 40% of the move with 14 periods, now closer to 20%. Win rate stayed the same; average R:R improved from 1.3 to 1.7.
The dual RSI setup (RSI(14) on 4H for direction and RSI(9) on 1H for entry timing) is what I was missing for two years of swing trading. I was using one RSI instance and getting chopped on entries. After applying this, my average entry improved by about half a candle on ETH 4H setups. Running at +7.2% monthly for the past six weeks.
The overbought/oversold context section changed my framework the most. I had been shorting RSI(70) touches on BTC automatically for six months in 2024, which was exactly the wrong approach during the bull run. After reading that RSI above 70 is context and not instruction, I went back through my trade log and counted eight losing shorts fitting that description; all taken during periods where the 4H trend was clearly up. Win rate improved from 49% to 61% over the following three months after stopping the automatic signals and reading what RSI does at specific price levels.
Used to change my RSI period every time I had three losing trades in a row. Optimizing after losses is the exact mistake described here and it describes my trading journal from 2024 perfectly. Stopped adjusting the period, focused on entry conditions instead. Results stabilized at +6.9% monthly over the last eight weeks.
The weekly crypto RSI needing 60/40 levels instead of 70/30 was exactly what my charts showed but I had not named. BTC weekly barely touched 70 during the 2024 run. The 60/40 adjustment gave me a usable signal at the top that standard settings would have missed entirely.
Applied the timeframe-specific settings from this article to my GBP/USD and XAU/USD setup. For gold specifically, dropping to RSI(9) on 1H made a material difference. Gold moves fast when macro data drops. The standard 14-period RSI was lagging by 2-3 candles on news-driven moves. With period 9, I entered a gold long 4 candles earlier than I would have with old settings, and the trade moved 180 pips before pulling back. Running +7.6% monthly average on XAU/USD over the past two months since the change.
The position trading section is the most useful part. Trading BTC weekly charts with standard 70/30 settings had me waiting forever for entries that never came. Shifting to 60/40 immediately gave me two signals in the past month; one was a clean 14% move. No change to the period, only the levels. That adjustment alone is worth the whole article.
Leave a Review

Crypto Trader & Technical Analyst
Crypto trader since 2019. Specializes in momentum strategies using RSI, MACD, and volume analysis on Binance Futures. Has managed personal portfolios through multiple market cycles.