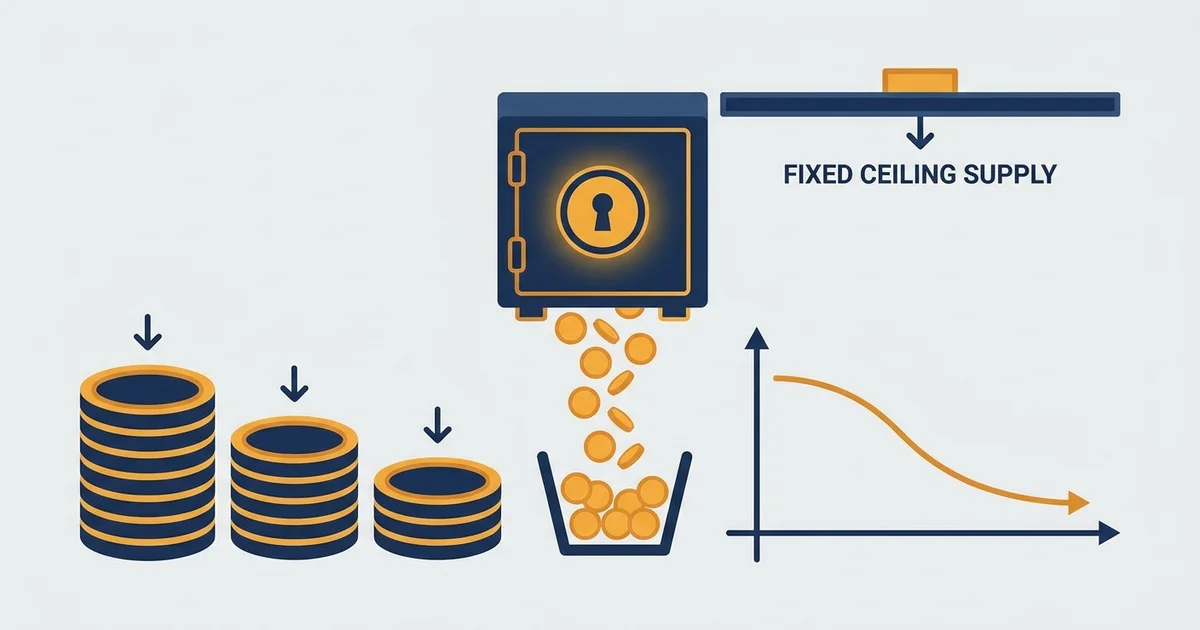

What tokenomics is, and why it moves price
Tokenomics is a blend of the words token and economics. It is the full set of rules that set a coin’s supply, change that supply over time, and give people a reason to hold it.
Price is just supply meeting demand, and tokenomics is the supply half, written in code for anyone to read. Bitcoin is the cleanest case: a fixed ceiling, and new supply that slows on a schedule.
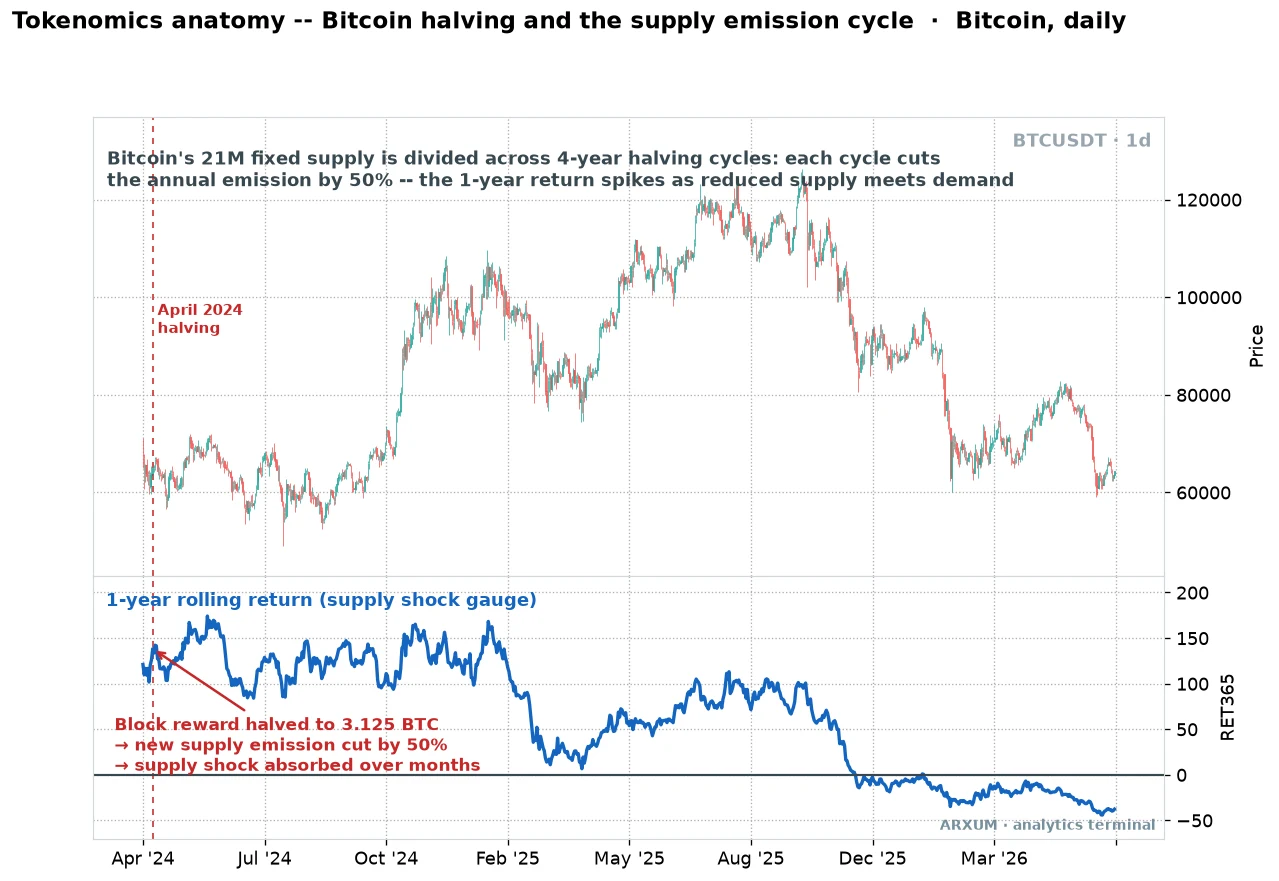
What the chart is showing:
- The top panel is Bitcoin’s daily price. The red dashed line marks the last halving, the scheduled event that cuts new issuance.
- At the halving, the block reward, the fresh BTC miners earn for each block of transactions, dropped to 3.125 coins. That cut the rate of brand-new supply by 50% overnight.
- The lower panel, tagged the supply shock gauge on the chart, is that 1-year rolling return: how much price has moved over the trailing year.
- Rising through and after the cut means demand is soaking up the reduced new supply. That is scarcity turning into price.
- The read: the same demand chasing fewer new coins tends to lift price. That is tokenomics playing out in real time, not theory.
The five parts of tokenomics
Every token’s economics come down to five moving parts. Learn to ask one question of each and you can size up a project fast.
| Part | What it controls | The question it answers |
|---|---|---|
| Supply | How many tokens exist, now and ever | Is it scarce? |
| Distribution | Who got the tokens and when they unlock | Who can dump on you? |
| Emission | How fast new tokens are created | Is supply growing? |
| Utility | What the token is actually used for | Why hold it? |
| Burn | Whether tokens get permanently destroyed | Is supply shrinking? |
The one idea that links them all:
- Supply is only half the story. A tiny supply means nothing if no one wants the token, and a growing supply can still rise if demand grows faster.
- Utility is the demand anchor. Governance votes, fee payments, staking rewards and app access are the real reasons a token gets held instead of sold. For the on-chain side of utility, see what DeFi is.
- The rest is timing. Distribution, emission and burns decide how much new supply hits the market, and when.
Total supply vs circulating supply
The single most common beginner mistake is reading one supply number and thinking it is the whole picture. There are three, and the gap between them is where the risk hides.
| Term | What it means | Why it matters |
|---|---|---|
| Circulating supply | Tokens trading in the market right now | Sets the real market cap today |
| Total supply | Minted so far, including locked tokens | Shows what is waiting to unlock |
| Max supply | The hard ceiling, if there is one | No cap means supply can grow forever |
How the gap trips people up:
- Market cap uses circulating supply. It is price times the coins actually trading, so it looks small when most tokens are still locked.
- Fully diluted valuation uses max supply. That is price times every coin that will ever exist. A huge gap between the two is a dilution warning.
- Low circulating, high max is an overhang. If only a slice is trading and a mountain is locked, that mountain will hit the market later and press price down.
- Rule of thumb: always compare circulating to max. A token with 10% circulating has 90% of its supply still to come.
Distribution and vesting: who holds it, and when it unlocks
Distribution is who received the tokens at launch. Vesting is the schedule that decides when their locked tokens become sellable.
| Allocation | Who gets it | What to watch |
|---|---|---|
| Team and founders | The builders | Size and how long it is locked |
| Investors and VCs | Early backers | Bought cheap, sell into strength |
| Foundation or treasury | The project itself | How fast it spends and sells |
| Public sale | Retail buyers | Often the smallest slice |
| Community and airdrops | Early users | Tends to sell quickly |
| Liquidity and ecosystem | Exchanges and grants | Keeps markets and building funded |
The word to know here is the unlock cliff:
- Vesting drips tokens out slowly over months or years, so insiders cannot sell everything at once.
- A cliff is a single date when a big locked batch suddenly becomes sellable. The chart often sags into it as the market front-runs the new supply.
- Insiders bought low. Team and VC tokens were priced far below the market, so an unlock can bring motivated sellers who are still deep in profit.
- Check the calendar. Token unlock trackers show the next cliff and its size. A large one soon is a reason to be patient, not early. Spreading entries with dollar-cost averaging is one calm way to handle a known unlock ahead.
Emission and burns: is the supply growing or shrinking?
Emission is the rate new tokens are created. A burn is the opposite: tokens sent to a dead address, gone for good.
Together they decide whether a token’s supply is inflating or deflating.
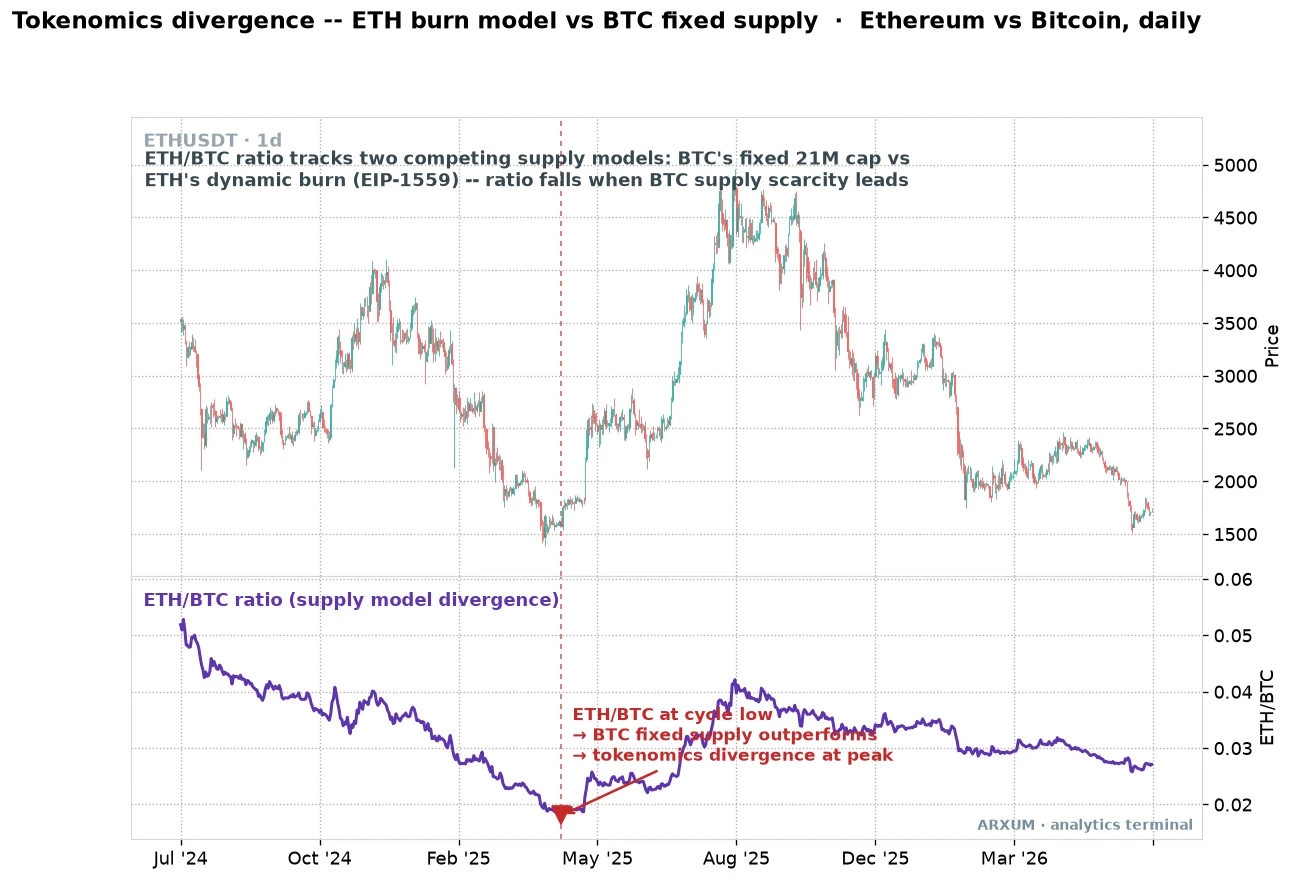
What the labels mean:
- The top panel is Ethereum’s daily price, tagged ETHUSDT.
- The lower panel is the ETH/BTC ratio, Ethereum’s price measured in Bitcoin. Because it is ETH priced in BTC, it drops when Bitcoin rises faster than Ethereum.
- The ratio falls when Bitcoin’s fixed-supply scarcity leads. The red mark is a low point in the market cycle, where Bitcoin’s supply model is winning.
- The read: two different tokenomics designs, priced against each other. Which supply story the market prefers shows up as the trend in this one line.
The four supply models you will meet:
| Model | How supply behaves | Example |
|---|---|---|
| Fixed cap | Hard ceiling, new supply slows over time | Bitcoin, 21M |
| Deflationary burn | Can shrink when burns beat new issuance | Ethereum, fee burn (EIP-1559) |
| Disinflating | Still prints, but the rate keeps falling | Solana |
| Uncapped | Grows forever to pay stakers or rewards | Many staking and meme coins |
How to read the model:
- Fixed and deflationary favour holders. Fewer new coins, or a shrinking float (the coins actually trading), put the supply pressure on your side.
- Uncapped needs strong demand just to stand still. If a coin prints, say, 8% new supply a year, demand has to grow faster than that before price can rise.
- Burns are only real if they are big. A token that burns a rounding error while printing rewards is inflationary with a marketing line. Check the net number.
- Staking sits on both sides. It locks supply away, which helps, but it usually pays with freshly printed tokens, which hurts. Our staking guide walks through that trade-off.
How tokenomics moves price: the supply shock
A supply shock is a scheduled drop in new supply, like a halving or the end of a big emission phase.
The supply side sets the stage. Demand decides the timing.
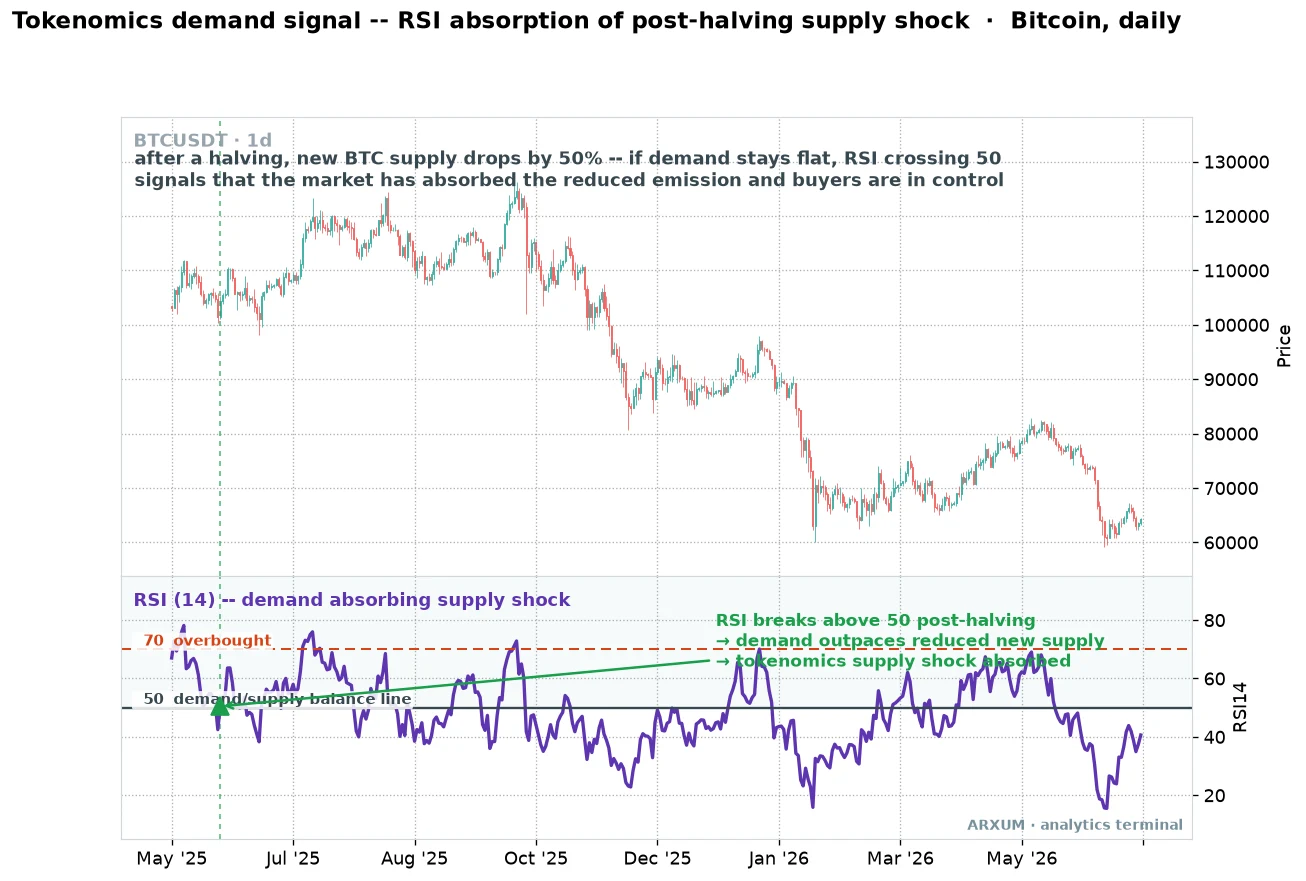
What the labels mean:
- The lower panel is the RSI, a momentum gauge that runs from 0 to 100, set to the standard length of 14.
- The 50 line is the demand-and-supply balance line. Above it, buyers are in control; below it, sellers are.
- The 70 line marks overbought. If RSI pushes up there the demand is stretched rather than fresh, so it is a caution, not a fresh green light. The 50 cross is the signal to watch.
- The green arrow marks RSI breaking above 50 after the supply cut. That is demand outpacing the reduced new supply.
- The read: the halving shrinks the flow of new coins. When RSI then holds above 50, the market has absorbed that shock and buyers own the smaller float.
How you actually use a supply event:
| Role | How you use it | Best read |
|---|---|---|
| Supply event | Mark the halving, unlock or burn date | Project calendar |
| Demand read | RSI holding above 50 after the supply cut | Daily, Bitcoin |
| Warning | RSI slips back under 50, the shock is fading | Daily, Bitcoin |
| Confirming | The ETH/BTC ratio agrees on which model leads | Daily, ETH/BTC |
Rule of thumb: a supply cut is a tailwind, not a trigger. It improves the odds over months, it does not promise a move next week.
Every tokenomics event is one of two opposites. One removes supply, the other adds it.
| Event | What it does to supply | Usual price pressure |
|---|---|---|
| Halving or burn | Cuts new supply, or destroys some | Supportive, scarcity rises |
| Unlock cliff | Releases a locked batch to sell | Heavy, fresh supply hits |
| Emission taper | Slows the rate of new supply | Slowly supportive |
| Big emission phase | Prints rewards fast to pay stakers | Draggy, dilution builds |
- Scarcity events are slow tailwinds. A halving or a burn works over months as the smaller float meets steady demand, not in a single candle.
- Unlocks are sharp headwinds. A cliff dumps a known amount of supply on a known date, and the market often drifts down into it early.
- The calendar is the edge. Both types are scheduled in the token’s code. Reading the schedule tells you which way supply is about to lean before price shows it.
Tokenomics red flags
Most bad projects share the same handful of supply tells. None of these alone is proof, but two or three together is a reason to walk.
| Red flag | Why it hurts | What good looks like |
|---|---|---|
| Team over 30 to 40% | Insiders can swamp the market | A modest, long-locked team slice |
| Short or no vesting | Early holders can dump at launch | Multi-year vesting with a cliff |
| No burn, uncapped supply | Endless printing dilutes holders | A cap, or real net burns |
| Low circulating vs max | A wall of unlocks is still coming | Most supply already circulating |
| Vague utility | No real reason to hold the token | Clear use: fees, governance, access |
| Few wallets hold most | A handful of whales can crash it | Supply spread across many holders |
How to weigh them:
- Count the insider slice first. If the team and VCs hold most of the supply, retail is the exit liquidity, not the customer.
- Then check the unlock calendar. A fair split still hurts if the whole insider block unlocks next month.
- A high advertised yield is a flag too. If staking pays, say, 200% a year, that reward is almost always freshly printed supply, and the token inflates to fund it.
Case studies: four real supply models
Four coins tell the whole tokenomics story, from the tightest supply on the market to the loosest.
| Project | Supply design | The lesson |
|---|---|---|
| Bitcoin | Fixed 21M, halving every four years | Scarcity by fixed schedule |
| Ethereum | No cap, fee burn, can go net-deflationary | Utility can shrink supply |
| Solana | Started high, inflation tapers each year | Read the emission schedule |
| Shiba Inu | Around one quadrillion tokens | Supply size makes the per-coin price meaningless |
The detail behind each:
- Bitcoin never changes its rules. The cap is 21 million and the halving cuts new supply on a clock, which is why the whole market treats it as digital scarcity.
- Ethereum has no cap, but the EIP-1559 upgrade burns part of every transaction fee. When the network is busy, more is burned than issued, and total supply can actually fall.
- Solana launched with a high inflation rate that disinflates a set amount every year, sliding toward a low long-run floor. The number today is not the number in a few years, so you read the schedule, not the snapshot.
- Shiba Inu shipped with roughly a quadrillion tokens. That is why one coin costs a tiny fraction of a cent. A low per-coin price is not cheap, it is just a big supply, and only the market cap tells you the real size.
How to analyze tokenomics: a checklist
Run any new token through the same eight steps. It takes about ten minutes and screens out most of the junk.
- Pull the supply numbers. Circulating, total and max. A data site like CoinGecko or CoinMarketCap lists all three.
- Compare circulating to max. A big gap means heavy dilution is still ahead. As a rough line, under about half the max already circulating is worth a closer look at the unlock schedule.
- Read the distribution. Find the team and investor percentages in the project docs or whitepaper.
- Check the vesting schedule. Use a token unlock tracker to find the next cliff and how big it is.
- Find the emission rate. Is new supply growing, and how fast? Compare it to how fast demand is growing.
- Look for a burn. Is any supply being destroyed, and is it big enough to matter against new issuance?
- Judge the utility. Is there a real, in-use reason to hold the token beyond hoping it goes up?
- Check holder concentration. A block explorer shows the top wallets. If a few hold most of it, treat that as size risk.
Where the data lives:
- Supply and market cap: CoinGecko or CoinMarketCap.
- Distribution and vesting: the project whitepaper, docs, and a dedicated unlock tracker.
- Holders and burns: the chain’s block explorer, which shows every wallet and every transfer.
- The buying side, once you have judged the token: our guide to trading crypto covers exchanges and wallets. Supply mechanics also matter most when the whole market rotates, which is the theme of our altcoin season guide.
What actually works
The short version you can carry:
- 1. Tokenomics is the supply half of price. Read how many tokens exist, how fast more appear, and what the token is for, before you look at the chart.
-
- Compare circulating to max supply. A small float with a huge locked mountain behind it is a dilution trap waiting to unlock.
-
- Follow the unlock calendar. The team and VCs bought cheap, so a big cliff is where motivated sellers arrive.
-
- Prefer fixed or deflationary over uncapped. Scarcity or real burns put supply on your side. Endless printing needs endless demand just to hold flat.
-
- Screen for the red flags. Oversized insider slice, short vesting, no burn, vague utility and concentrated holders are the tells that repeat.
Glossary
- Tokenomics: the economic design of a crypto token, covering supply, distribution, emission, utility and burns.
- Circulating supply: the tokens actually trading in the market right now.
- Float: an informal word for the circulating supply, the coins free to trade.
- Block reward: the fresh coins a miner or validator earns for adding a block of transactions. A halving cuts it in half.
- Total supply: every token minted so far, including locked ones.
- Max supply: the hard ceiling on how many tokens can ever exist. Some tokens have none.
- Emission: the rate at which new tokens are created and released.
- Burn: permanently destroying tokens by sending them to an unspendable address.
- Vesting: a schedule that releases locked tokens gradually instead of all at once.
- Unlock cliff: a single date when a large batch of locked tokens becomes sellable.
- Fully diluted valuation: the market cap if every possible token were already circulating.
- Utility: the real use of a token, such as paying fees, voting or staking.
FAQ
What is tokenomics, in plain terms?
Tokenomics is the economics of a crypto token. It covers how many tokens exist, how fast new ones are created, who holds them, what the token is used for, and whether any get burned. In short, it is the supply-and-demand blueprint written into a coin's code.
What is tokenomics in crypto?
In crypto, tokenomics is how a project designs its coin's supply and incentives. It sets the total and circulating supply, the release schedule for team and investor tokens, the inflation or burn rate, and the reasons to hold the token. It is the first thing analysts read before judging a project.
What makes tokenomics good or bad?
Good tokenomics keeps supply scarce or genuinely useful, with a fair distribution, long vesting for insiders, and clear utility. Bad tokenomics floods the market: an oversized team allocation, short vesting, no cap and no burn, so new supply arrives faster than demand can absorb it.
What are the biggest tokenomics red flags?
The main ones are a team or investor allocation above 30 to 40%, short or missing vesting, an uncapped supply with no burn, a small circulating supply hiding a huge locked mountain, vague utility, and a few wallets holding most of the coins. One alone is a caution. Several together is a reason to walk.
How do I analyze a token's tokenomics?
Pull the circulating, total and max supply, then compare circulating to max for dilution. Read the team and investor percentages, check the unlock schedule for the next cliff, find the emission and burn rates, judge whether the utility is real, and look at holder concentration on a block explorer. Data sites and the whitepaper cover most of it.
Does tokenomics actually affect price?
Yes, because price is supply meeting demand and tokenomics controls the supply side. A supply cut like a Bitcoin halving reduces new coins entering the market, so steady demand has more room to lift price. An unlock cliff does the opposite, adding fresh supply that often weighs on price.
What is the difference between circulating and total supply?
Circulating supply is the tokens trading in the market right now, and it sets the current market cap. Total supply includes tokens that are minted but still locked. Max supply is the hard ceiling, if one exists. A wide gap between circulating and max means a lot of dilution is still ahead.
What is an unlock cliff?
An unlock cliff is a set date when a large batch of previously locked tokens, usually held by the team or early investors, becomes free to sell. Because insiders bought in cheap, a big cliff can bring motivated sellers, and the market often prices it in ahead of time by drifting lower.
Is a low token price better than a high one?
No. A coin priced at a fraction of a cent is not cheap, it just has a very large supply, like Shiba Inu with its roughly one quadrillion tokens. Only the market cap, price times circulating supply, tells you the real size of a project. Never judge value by the per-coin price alone.
Real-time trade setups with entry, stop loss and take profit. Daily market analysis. No subscription, no complicated theory.
🌍 Our recommended brokers


Reader Reviews
Be the first to review this — tell other traders what actually helped, or where it fell short.
Leave a Review

Quant Researcher & Systems Builder
Quantitative researcher who builds the automated systems behind Arxum strategy testing. Works in Python and Pine Script, using AI alongside classic backtesting to validate strategies on years of real data.
