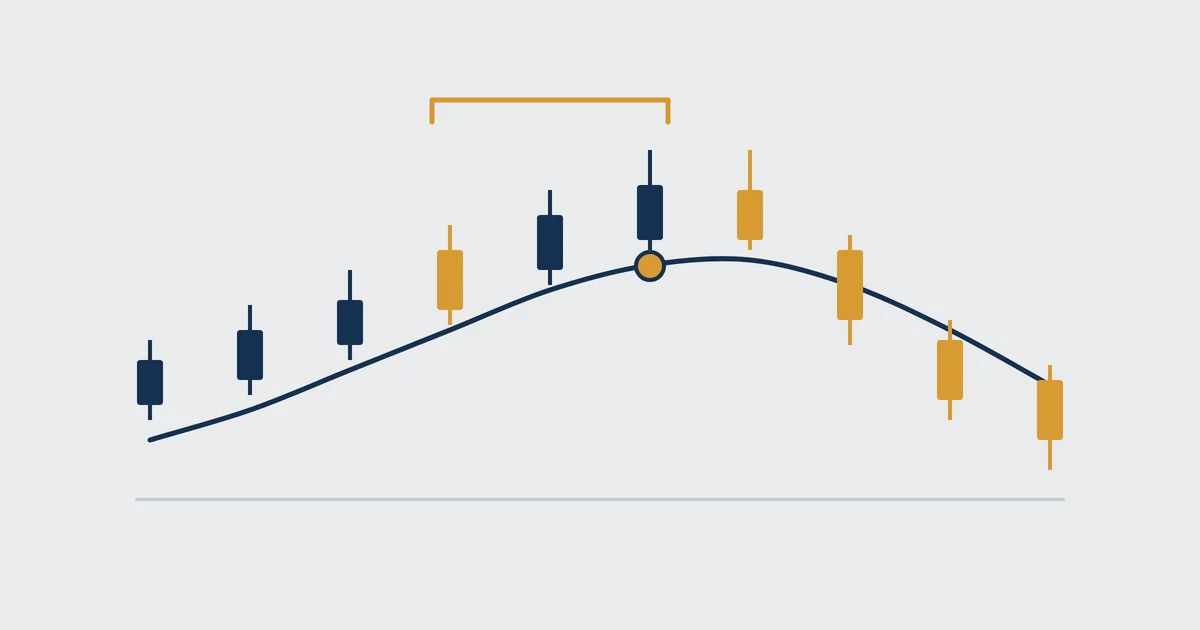

What a simple moving average looks like on a chart
Here is the simple moving average every course draws first: one line through daily gold candles. When price sits above the line the trend reads up, and a close below it is the first warning.
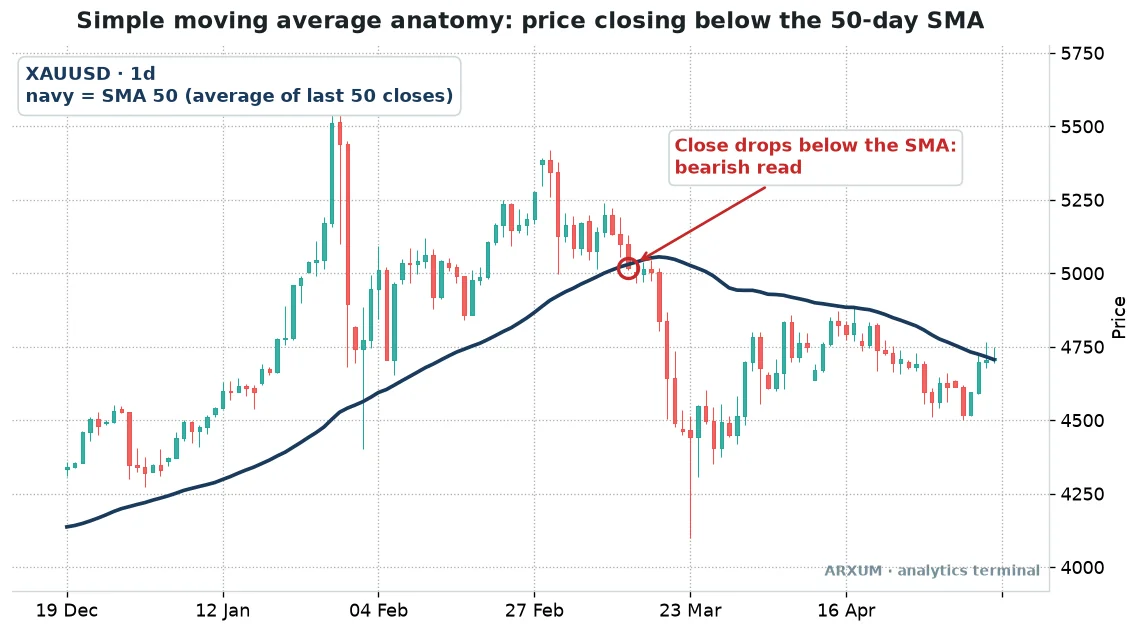
Everything a beginner needs is on that one picture. Point at it piece by piece:
- The candles ride above the navy line for most of the left half. That is what an uptrend looks like through an SMA.
- The line itself rises smoothly while the candles jump around. The average irons out daily noise.
- At the red circle a daily close lands under the line. That is the read traders call “price lost the 50”.
- After the break the line stops climbing, rolls over, and price spends the rest of the window mostly beneath it.
- The line turns late. The top in the candles came well before the average bent down, which is the lag every SMA carries.
Rule of thumb: the SMA tells you what the trend has been, not what it will be.
How the SMA is calculated
The simple moving average formula is the arithmetic mean you learned at school. Add up the last N closes, divide by N, plot the dot, repeat on the next candle.
SMA = (C1 + C2 + … + CN) ÷ N, where C is each closing price and N is the period.
A 5-period example on illustrative EUR/USD closes shows how the line moves:
| Candle | Close | Running sum |
|---|---|---|
| 1 | 1.0850 | 1.0850 |
| 2 | 1.0870 | 2.1720 |
| 3 | 1.0865 | 3.2585 |
| 4 | 1.0890 | 4.3475 |
| 5 | 1.0900 | 5.4375 |
- After candle 5: 5.4375 ÷ 5 = 1.0875. That is the first SMA value.
- Candle 6 closes at 1.0920. The oldest close (1.0850) drops out and the new one comes in.
- New sum: 5.4375 − 1.0850 + 1.0920 = 5.4445.
- New SMA: 5.4445 ÷ 5 = 1.0889. The line moves up by 14 pips.
That “one in, one out” step is why it is called a moving average. It also explains the SMA’s two quirks:
- Every close in the window counts equally. The close from 50 days ago weighs as much as yesterday’s.
- When a big old candle drops out of the window, the line can jump even if today’s price barely moved. Traders call this the drop-off effect.
SMA vs EMA in one table
The question everyone asks next is how the simple average differs from the exponential one. The short version sits below; the full comparison lives in our EMA vs SMA guide.
In the table, “regime” means whether the market is in a long-term uptrend or downtrend.
| Feature | SMA | EMA |
|---|---|---|
| Weighting | All closes equal | Recent closes heavier |
| Speed | Slower | Faster |
| Noise | Smoother line | More wiggle |
| False signals | Fewer | More |
| Best for | Trend and regime | Timing entries |
Neither is better. A slower line suits the job of telling you which side of the market to be on.
A faster line suits the job of getting in sooner.
Which SMA settings traders use
Before the three methods, it helps to know the handful of periods the market actually watches. A level works partly because thousands of traders look at the same line.
The chart codes are timeframes: M15 = 15-minute, H1 = 1-hour, H4 = 4-hour, D1 = daily.
| Period | Typical chart | What it reads |
|---|---|---|
| SMA 10 | H1, M15 | Very short swings |
| SMA 20 | H1 to D1 | Short-term trend |
| SMA 50 | H4, D1 | Medium trend |
| SMA 100 | M15 to H4 | Intraday backbone |
| SMA 200 | D1 | Long-term regime |
A few notes on picking one:
- The 200-day SMA is the most quoted line in finance. Fund managers, journalists and retail traders all reference it, so price often reacts near it.
- The 20 roughly matches a trading month on a daily chart. The 50 covers about 2.5 months, a bit under a quarter.
- On intraday charts, the “same” period means much less time. A 100-period SMA on the 15-minute covers about a day of trading.
- Odd numbers like 47 or 63 have no magic. If nobody else watches a line, it is just your private average.
Method 1: price above or below one SMA (the trend filter)
This is the gold chart from the top of the page, put to work. One line, one question: is the close above it or below it?
- Above a rising SMA: the trend reads up. Look for buys, skip shorts.
- Below a falling SMA: the trend reads down. Look for sells, skip longs.
- Price crossing the line back and forth while the SMA runs flat: no trend. Step aside or switch to range tools like support and resistance.
The slope matters as much as the side. A close above a line that still points down is a question, not an answer.
| Role | How you use it | Best read |
|---|---|---|
| Trend read | Close vs SMA side | D1, SMA 50/200 |
| Regime filter | Trade one side only | D1 SMA 200 |
| Early warning | First close through | D1, H4 SMA 50 |
| Exit cue | Close back across | H4 SMA 20/50 |
| Context | Slope up, flat, down | Any TF |
How it reads across instruments
- Gold (XAU/USD) trends in long legs, so the daily SMA 50 and SMA 200 read cleanly. In a strong bull run, the first close below the 50 is often a pause rather than a top, so wait for the line to turn.
- EUR/USD moves slower and ranges more. The daily SMA 200 is the cleaner regime line; the 50 gets crossed often in quiet months.
- GBP/USD swings harder than the euro. Same lines work, but expect deeper pokes through the average before the trend actually breaks.
- On Bitcoin, the daily SMA 200 is a widely followed bull/bear line for crypto. Weekly charts are also popular, because daily crypto noise is large.
- Silver (XAG/USD) follows gold’s direction but with sharper spikes. Give the line more room before calling a break.
What the gold example teaches
- The read was correct: a close below the 50 after a long uptrend, and price did fall.
- The read was late: the actual high printed weeks before the break. That is the cost of a smoothed line.
- The read was noisy right after: price bounced back toward the falling SMA more than once. A single close through the line is a warning, not a guarantee.
Takeaway: use one SMA to decide which side to trade, not exactly when to click.
Method 2: two SMAs crossing (the crossover)
The second classic use adds a faster average to the slower one. When the fast line crosses the slow one, the short-term trend has overtaken the medium-term trend.
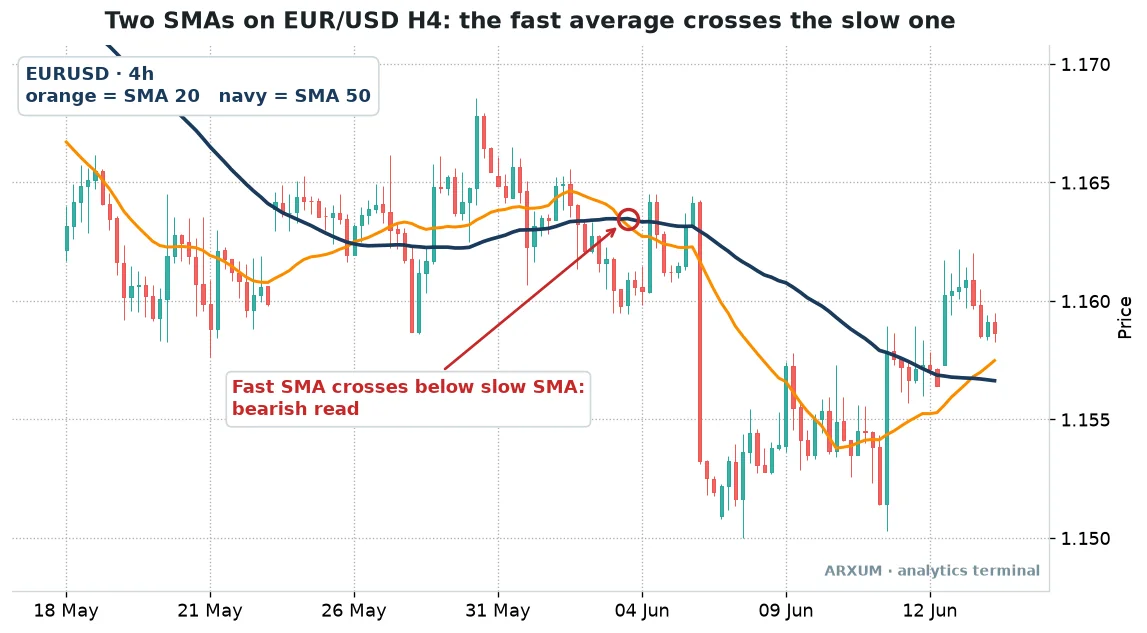
Read the chart in three steps:
- Before the circle: both lines run almost flat and close together. The fast line weaves above and below the slow one with no follow-through. That is a range.
- At the circle: the orange line bends down through the navy line. The bearish crossover prints.
- After it: a large red candle breaks lower, the gap between the lines opens up, and both averages slope down. That spread between the lines is what a real trend looks like.
Notice the end of the window too. The orange line curls back toward and above the navy one as price recovers, which would be the opposite signal.
The popular SMA pairs
| Pair | Chart | Style |
|---|---|---|
| 10 / 20 | M15, H1 | Intraday |
| 20 / 50 | H4 | Swing |
| 50 / 100 | H4, D1 | Swing to position |
| 50 / 200 | D1 | Golden and death cross |
The 50/200 daily pair has its own name: the bullish version is the golden cross and the bearish one the death cross. Both are covered in our golden cross and death cross guide.
Other pairs and three-line systems are in the moving average crossover guide.
Crossover roles, beyond the entry
| Role | How you use it | Best read |
|---|---|---|
| Entry trigger | Trade the cross | H4 20/50 |
| Trend change | Note the new side | D1 50/200 |
| Confirmation | Back a price signal | H1, H4 |
| Strength gauge | Gap between lines | Any TF |
| Exit cue | Opposite cross | H4 20/50 |
Where crossovers break down
- In a range, the lines cross again and again. Each cross is a small loss if you trade it blindly, which traders call a whipsaw.
- On fast charts the problem grows. A 10/20 cross on the 15-minute fires several times a session on EUR/USD.
- On slow charts the signal comes late. A daily 50/200 cross can land long after the move began.
Two simple fixes, both visible on the chart without extra tools:
- Wait for the lines to separate after the cross. If they stay tangled for several candles, it was probably noise.
- Check the slope of the slow line. A cross where the slow SMA still points the opposite way is a weaker signal.
Some traders add a trend-strength gauge like the ADX to skip crosses in flat markets. That is optional; the separation check above catches much of the same noise.
Takeaway: a crossover is a trend-change alert, and it pays best when the lines then spread apart.
Method 3: the SMA as a line price leaves and reclaims
The third use treats the average as a moving level. Price drifts below it during a pullback, then closes back above it when buyers return, or the mirror for sellers.
This is the most popular way to use a longer SMA on fast charts. The line acts like a moving floor or ceiling.
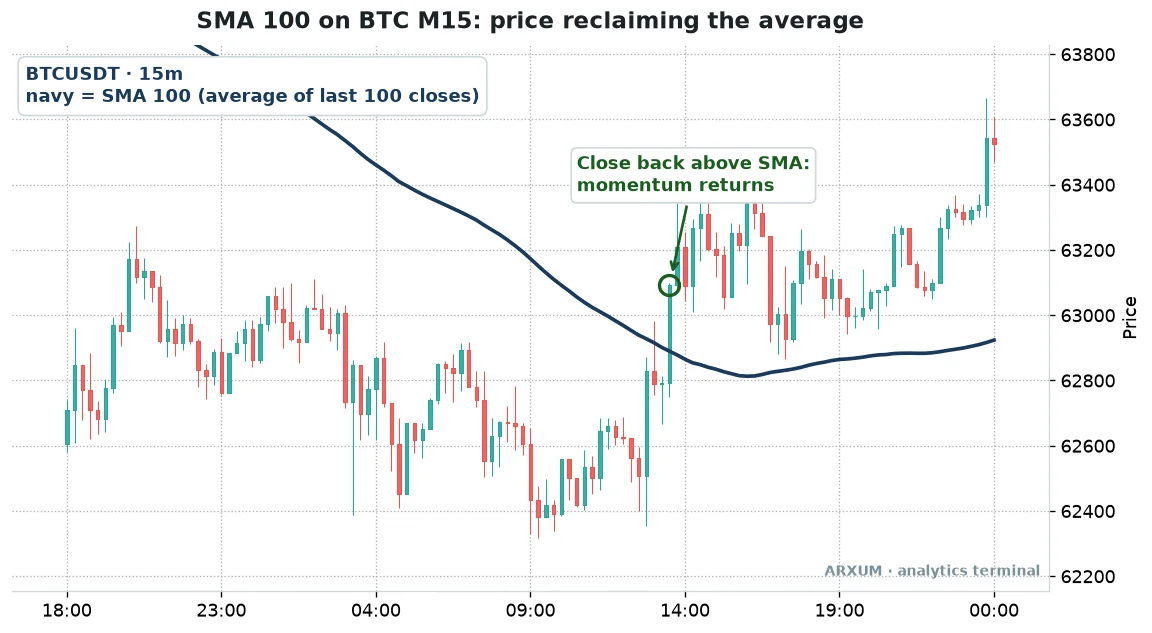
What happened, in order:
- For most of the window, price traded below a falling SMA 100. Sellers controlled the session.
- Selling stalled into a low, and candles started pressing up toward the line.
- A strong green candle closed through the average. That close is the reclaim.
- The next candles dipped but stayed above the SMA. The line flattened, then curled up underneath price.
The best part of a reclaim is the retest. When price pulls back to the average and holds, the line has switched from ceiling to floor.
| Role | How you use it | Best read |
|---|---|---|
| Entry trigger | Close back across | M15, H1 SMA 100 |
| Pullback zone | Buy dips to the line | H1, H4 SMA 20/50 |
| Rejection short | Sell a failed reclaim | M15 to H4 |
| Stop reference | Stop beyond the line | Any TF |
| Trail | Exit on close through | H1 SMA 20 |
How the reclaim reads across markets
- Bitcoin trades around the clock, so a 15-minute SMA 100 covers a full day. Reclaims after a sell-off are common, but so are fakeouts during thin weekend hours.
- On gold’s 1-hour chart the SMA 50 and 100 work as pullback zones in a trend. Reactions are cleaner during the London and New York sessions.
- On EUR/USD the 1-hour SMA 100 reads best around the London open and the New York overlap. Asian-session crosses are often noise.
- GBP/JPY swings wide, so price often pierces the line by a lot before reclaiming. A close beats a wick here.
Rejection, the mirror image
The same chart read upside down is a rejection. Price rallies into a falling SMA, prints a wick through it, and closes back below.
- A rejection in a downtrend is the short-side version of the reclaim.
- Two or three rejections at the same falling line make it a strong ceiling.
- A clean close above it, then a hold on the retest, cancels the bearish read.
Takeaway: judge the reclaim on the close and the retest, never on a wick.
Which SMA method to use, and when
The three methods are not rivals. They answer different questions, and many traders stack them from slow to fast.
| Your situation | Use | Setting |
|---|---|---|
| Which side to trade | Price vs one SMA | D1 SMA 200 |
| Spot a trend change | Crossover | D1 50/200 |
| Swing entries | Crossover | H4 20/50 |
| Buy a pullback | Reclaim / dip to line | H1 SMA 50 |
| Intraday timing | Reclaim | M15 SMA 100 |
| Sideways market | Skip SMA signals | Use range tools |
One example stack, slow to fast
- Daily chart: price above a rising SMA 200, so longs only.
- 4-hour chart: wait for the SMA 20 to cross back above the SMA 50 after a pullback.
- 1-hour or 15-minute chart: time the entry on a reclaim of the SMA 100, and place the stop beyond the line.
Each layer filters the one below it. The slow line picks the side, the middle one picks the swing, the fast one picks the candle.
By instrument and timeframe
| Instrument | Cleanest read | Watch out for |
|---|---|---|
| XAU/USD | D1 SMA 50/200 | Pauses in bull runs |
| EUR/USD | H4 20/50 | Long flat ranges |
| GBP/USD | H4, D1 SMA 50 | Deep pokes |
| BTC/USDT | D1 SMA 200, M15 100 | Weekend fakeouts |
| XAG/USD | D1 SMA 50 | Sharp spikes |
Common SMA mistakes
- Treating the line as an exact price. Price rarely touches an SMA to the pip. Think of it as a zone a little above and below the line.
- Trading every cross in a range. A flat SMA with candles on both sides is telling you there is no trend.
- Judging on wicks. An intraday wick through the line means little; the close is what counts.
- Stacking five averages. Three lines at most; after that the chart says everything and nothing.
- Forgetting the drop-off effect. A sudden kink in the line can come from an old candle leaving the window, not from today’s price.
- Using the 200 on a 1-minute chart and expecting it to behave like the daily 200. Same number, very different meaning.
- Calling a top from the first close below the line. In a strong trend that close is often just a pullback.
Using an SMA in your own trading
The SMA itself does not size or manage a trade. Those rules come from you, and they matter more than the setting you pick.
- Place the stop beyond the line, not on it. If a reclaim fails, price returns below the SMA, so the stop belongs past the recent swing on the far side.
- Risk a fixed slice of the account per trade, such as 2%. Size the position from the stop distance using our position sizing walkthrough.
- Set the target before entry and check the trade still offers at least a 1:2 risk/reward ratio, meaning the target is twice as far as the stop.
- Expect runs of small losses in ranges. Any trend tool gives back some trades in a sideways market, and that is the cost of catching the trends.
- If you take three to six losses in a row, pause. The market may have shifted from trend to range, and the SMA cannot tell you that in advance.
- Do not chase a candle that has already run far from the line. Wait for the next pullback toward the average.
On a small account, micro lots let you size a 2% risk precisely on EUR/USD or gold.
How to add it on TradingView and MetaTrader
- On TradingView, open the chart, click Indicators, and search “Moving Average Simple”. Change the Length (the default is short) to 20, 50, 100 or 200, and keep Source on “close”. Add it twice for a crossover.
- On MT4 / MT5, go to Insert, then Indicators, then Trend, then Moving Average. Set MA method to “Simple” and Apply to “Close”. The default period is 14, so change it.
- Watch for look-alikes: “Moving Average Exponential”, “Moving Average Weighted” and “Smoothed Moving Average” sit right next to it in the list. They look similar and move differently, so check the name.
What works: the short version
- One SMA for direction. The daily 200 or 50 tells you which side to trade.
- Two SMAs for trend change. A 20/50 cross on the 4-hour flags new swings when the lines then separate.
- A longer SMA on a fast chart for timing. A close back above the 15-minute or 1-hour SMA 100, held on the retest, times the entry.
And one thing that does not: trading any of the three blindly in a flat, sideways market. When the SMA runs flat, step aside.
If you want a faster line for the timing layer, the Hull moving average cuts much of the lag. For the bigger picture of riding trends, see our trend following guide.
Key SMA terms
- SMA: simple moving average, the plain average of the last N closes.
- Period (length): how many candles the average covers.
- M15 / H1 / H4 / D1: chart timeframes of 15 minutes, 1 hour, 4 hours and 1 day.
- Regime: whether the market is in a long-term uptrend or downtrend.
- Slope: whether the line points up, down or flat.
- Crossover: a fast SMA crossing a slow SMA.
- Golden cross / death cross: the 50-day SMA crossing above / below the 200-day SMA.
- Reclaim: a close back above an SMA after trading below it.
- Rejection: a rally into an SMA that fails and closes back below it.
- Whipsaw: a signal that reverses almost immediately, common in ranges.
- Drop-off effect: the line jumping because an old candle left the window.
FAQ
What is a simple moving average, in plain terms?
It is the average closing price over the last few candles, drawn as a line. A 20-period SMA adds the last 20 closes and divides by 20, then repeats on every new candle. The line smooths out noise so you can see which way the market has been heading.
How do you calculate the SMA?
Add the closing prices for the chosen number of periods and divide by that number. For five closes of 1.0850, 1.0870, 1.0865, 1.0890 and 1.0900, the sum is 5.4375 and the SMA is 1.0875. On the next candle, drop the oldest close, add the newest, and divide again.
Does the simple moving average actually work?
It works well at one job: showing the direction of a trend that already exists. It does not predict turns, and it gives false signals in sideways markets. Traders who do well with it use it to pick a side and a zone, then manage risk with a stop and a fixed position size.
What is the best SMA setting?
There is no single best one. The 200-day suits the long-term trend, the 50 the medium trend, and the 20 short swings. On intraday charts, the SMA 100 on the 15-minute is a common backbone. Pick lines that many traders watch, because shared levels react better than private ones.
Is SMA or EMA better?
Neither. The SMA is smoother and slower, so it suits trend and regime reads with fewer false signals. The EMA weights recent prices more, so it reacts faster and suits entry timing. Many traders use an SMA 200 for direction and a short EMA for timing.
What timeframe is best for the SMA?
The 4-hour and daily charts give the cleanest reads, because each candle carries more information. On the 15-minute and 1-hour, use longer periods like 100 and expect more noise. A good habit is to read the trend on the daily, then drop down only to time the entry.
Does the SMA work on Forex, gold and Bitcoin?
Yes, on all three, because it only needs closing prices. Gold trends in long legs, so its daily lines read cleanly. EUR/USD ranges more, so the daily 200 is the more reliable line there. Bitcoin's daily 200 is a widely watched bull and bear line.
Why does price react at the 200-day SMA?
Partly because so many people watch it. Funds, analysts and retail traders all reference the 200-day, so orders cluster around it. That shared attention turns an average into a level, though it is a zone, not an exact price.
How much money do I need to trade with an SMA?
The indicator is free, so the question is position size. With micro lots, a $500 account can risk 2% per trade, about $10, on EUR/USD with a stop of a few dozen pips. Gold moves in bigger steps, so a wide stop may not fit a small account at all.
What do the key SMA terms mean?
Period is the number of candles averaged. Slope is the line's direction. A crossover is a fast SMA crossing a slow one, and the 50/200 daily version is the golden or death cross. A reclaim is a close back above the line, a rejection is a failed push through it, and a whipsaw is a signal that reverses straight away.
Real-time trade setups with entry, stop loss and take profit. Daily market analysis. No subscription, no complicated theory.
🌍 Our recommended brokers


Reader Reviews
Be the first to review this — tell other traders what actually helped, or where it fell short.
Leave a Review

Quant Researcher & Systems Builder
Quantitative researcher who builds the automated systems behind Arxum strategy testing. Works in Python and Pine Script, using AI alongside classic backtesting to validate strategies on years of real data.