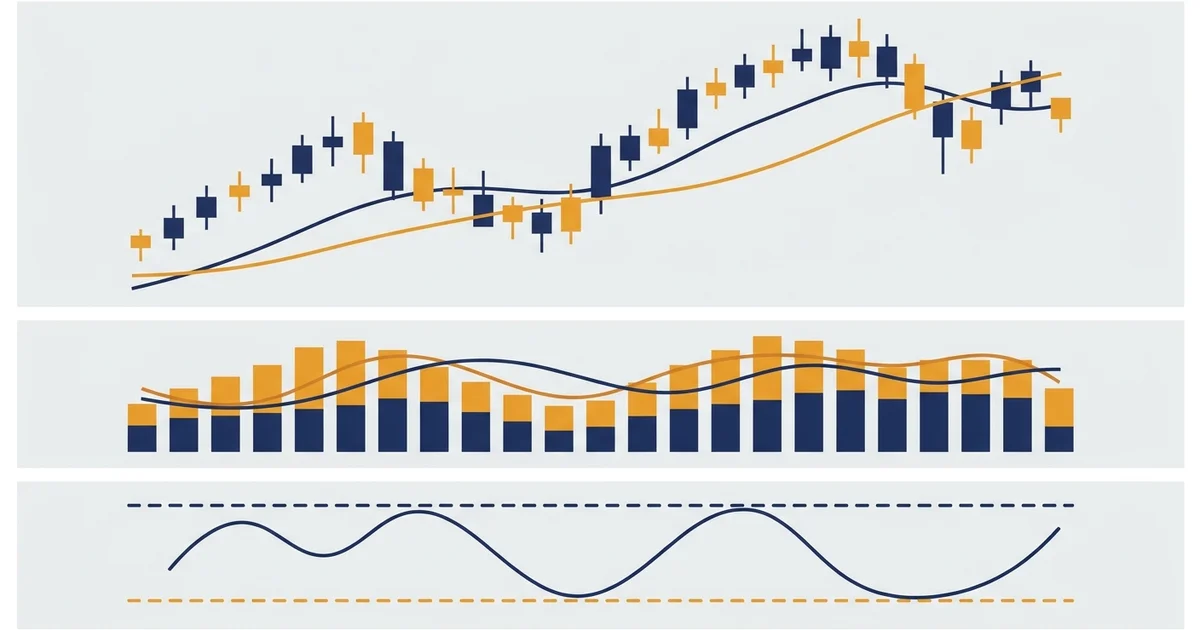

The Best Swing Trading Indicators Start With a Trend Read
Every swing setup begins with one question: is the market going up or down? The moving average crossover answers it, and it is the first indicator most swing traders put on a chart.
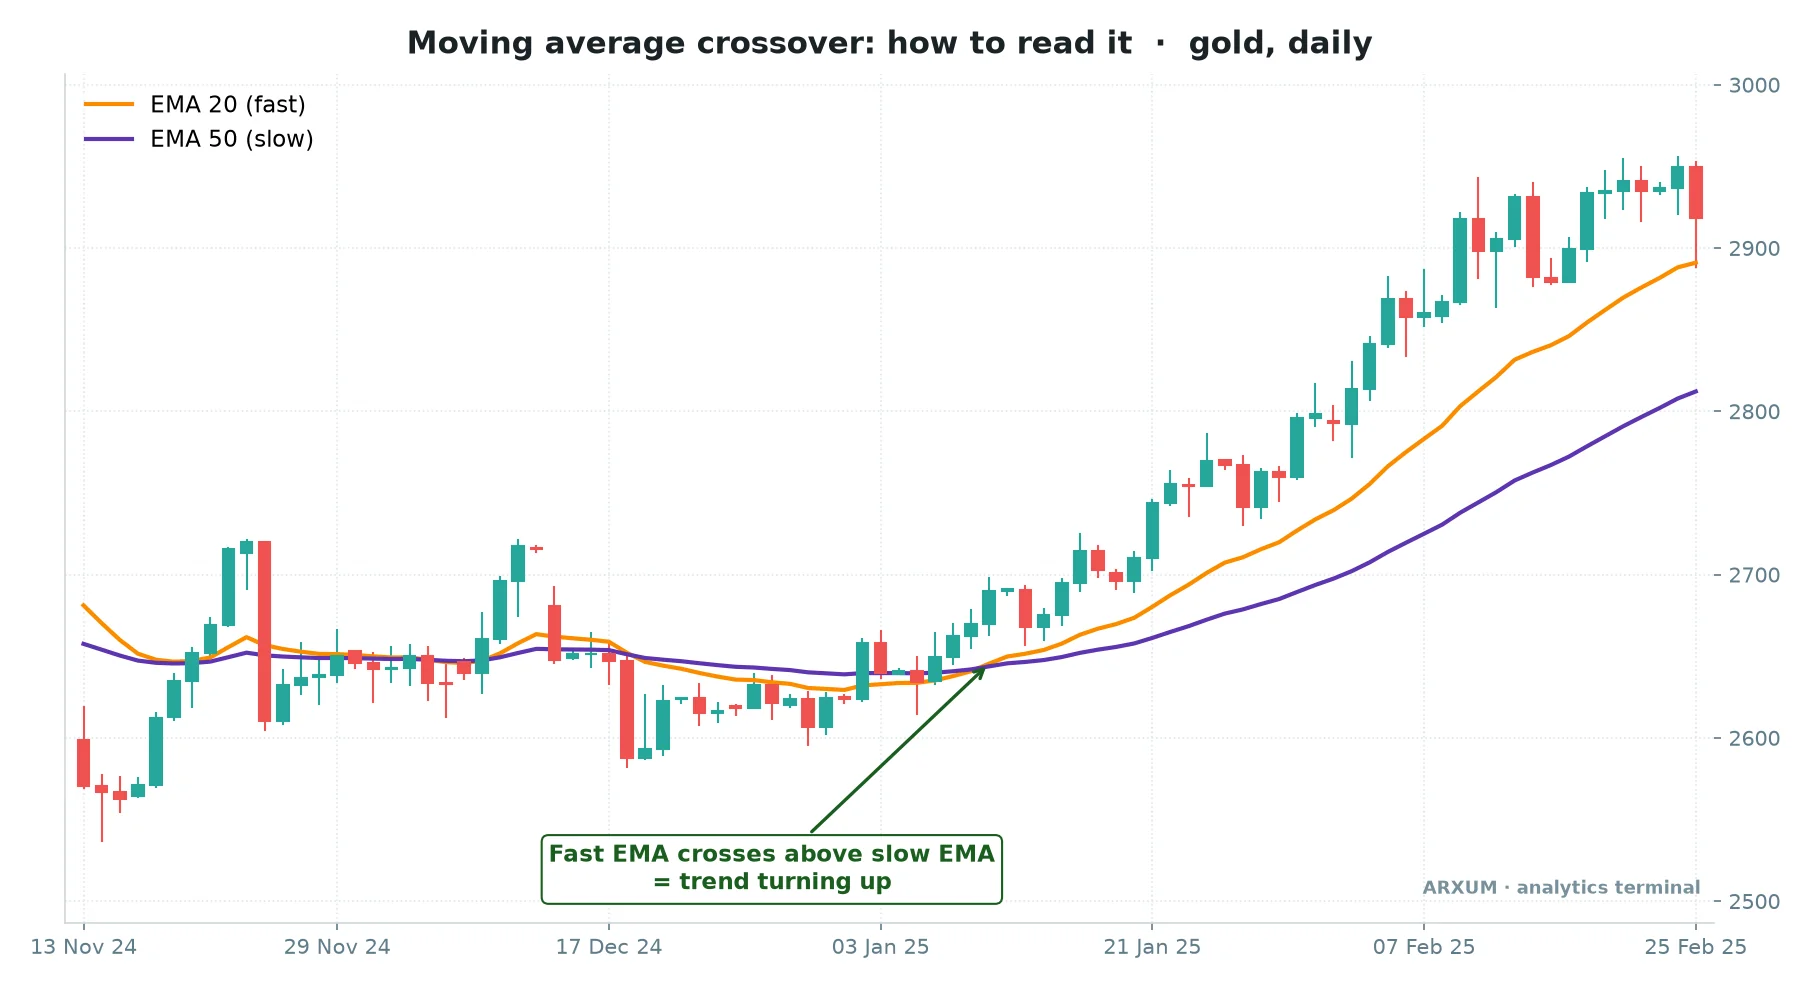
Read the gold chart in two halves:
- Left half: the two EMAs run flat and keep touching. Price chops sideways, and no crossover there means much.
- The arrow: the orange EMA 20 lifts above the purple EMA 50 and both start to slope up.
- Right half: price rides above both lines for weeks. The gap between the averages widens as the trend matures.
An EMA (exponential moving average) is a smoothed line of recent closing prices that weights the newest bars more. That is the whole of the trend read, and the rest of this guide stacks the other tools around it.
The six swing trading indicators, ranked by job
The best swing trading indicators each do one job. The top three are the core; the bottom three support them.
| Rank | Indicator | Main job | Best chart |
|---|---|---|---|
| 1 | EMA 20/50 | Trend direction | D1, H4 |
| 2 | MACD | Momentum shift | H4, D1 |
| 3 | RSI | Pullback timing | D1, H4 |
| 4 | ATR | Stop distance | Any TF |
| 5 | Bollinger Bands | Breakout warning | D1 |
| 6 | Volume | Move confirmation | D1, stocks, BTC |
TF means timeframe. W1 is the weekly chart, D1 the daily, H4 the 4-hour and H1 the 1-hour.
Why Indicators for Swing Trading Differ From Day Trading Tools
Swing trades last from a few days to a few weeks. That changes what a useful indicator looks like.
- Fewer signals, each one heavier. A daily chart prints one bar a day, so a single crossover carries real weight. On the 5-minute the same signal fires ten times before lunch.
- Wider stops. A swing stop has to survive overnight noise and weekend gaps. That is why ATR, a volatility gauge, matters more here than in scalping.
- Trend first, trigger second. A swing trader wants to ride a leg, so the trend filter outranks the entry trigger.
- Slow settings are fine. Lag hurts a scalper. For a trade held two weeks, a few bars of delay costs little and filters a lot of noise.
The day-trading toolkit leans the other way, with VWAP and session tools. If you trade both styles, compare this list against the best indicators for day trading.
1. EMA 20/50 Crossover: The Trend Filter
You already saw it on gold above. The pair is simple, and its main value is telling you which side of the market to stand on.
How it looks:
- Fast EMA above slow EMA, both sloping up: uptrend, look for longs only.
- Fast EMA below slow EMA, both sloping down: downtrend, look for shorts only.
- Both lines flat and braided together: range, the crossover is unreliable here.
- Price pulling back to the EMA 20 inside a trend: the most common swing entry zone.
- On Forex and CFDs (contracts for difference, which track a price without you owning the asset) a short is simply a sell order, so the downtrend side is just as tradable as the up side.
| Role | How to use it | Best TF / market |
|---|---|---|
| Trend read | Trade the side the fast EMA is on | D1 gold, D1 BTC |
| Entry zone | Buy dips to EMA 20 in uptrends | H4 EUR/USD |
| Filter | Skip trades when lines braid | H4 GBP/USD |
| Exit cue | Close on a daily close below EMA 50 | D1 gold, oil |
| Bigger picture | Add EMA 200 for the long regime | D1 any market |
Where it falls short:
- It lags at turning points and always misses the first part of a move.
- In a flat market it flips back and forth, each flip a small loss.
- A gap or news spike can force a cross that reverses the next day.
Rule of thumb: use the EMAs to pick a side, not to time the click. The deeper mechanics live in the moving average crossover guide, and the EMA vs SMA comparison explains why the exponential version reacts faster.
2. MACD: The Momentum Check
Trend tells you direction. MACD tells you whether the push behind it is building or fading, read with its default 12,26,9 settings.
| MACD part | What it is | Plain read |
|---|---|---|
| MACD line | EMA 12 minus EMA 26 | Speed of the trend |
| Signal line | 9-bar EMA of MACD | Smoothed speed |
| Histogram | Gap between the two | Momentum growing or shrinking |
| Zero line | Where the EMAs meet | Bull side vs bear side |
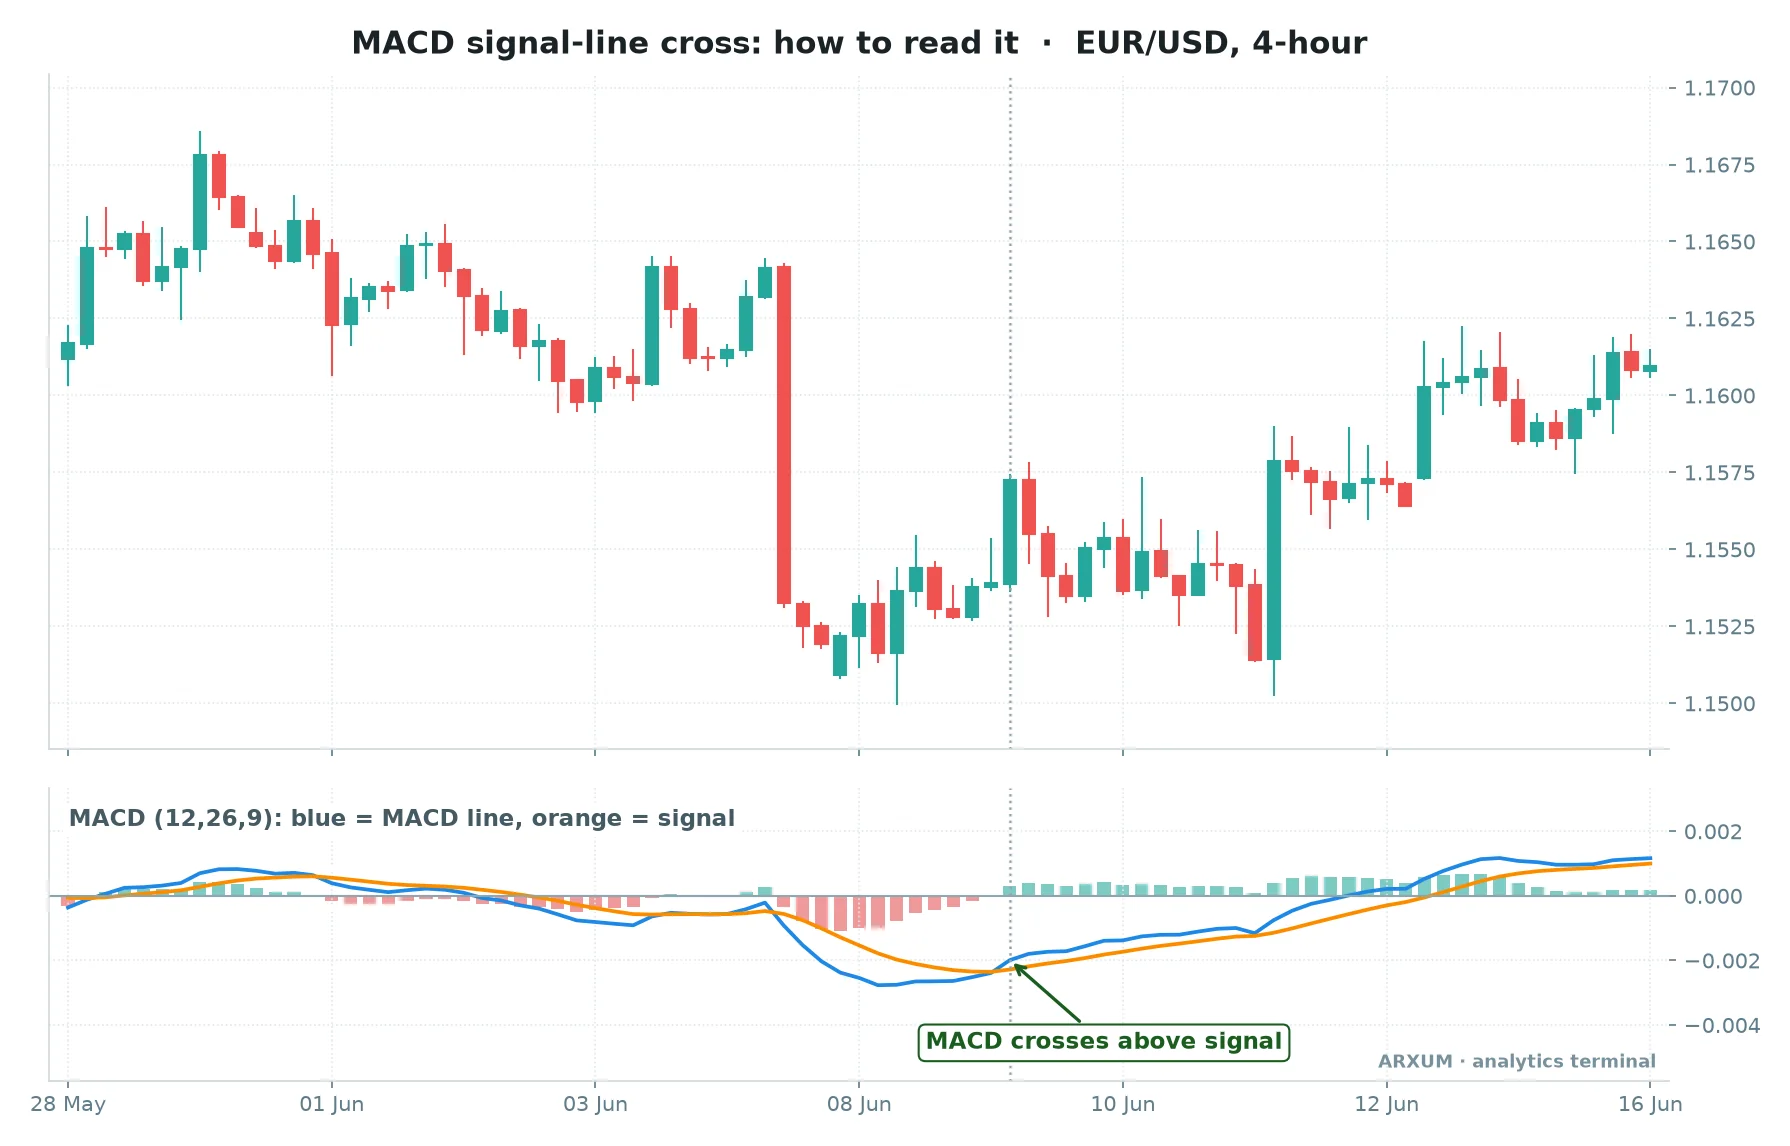
What happened on that EUR/USD chart:
- A big red candle knocked the pair from about 1.1640 to near 1.1530 in one bar.
- MACD dove deep below zero and the histogram bars grew long and red.
- The red bars then shrank for several bars before the cross. That shrinkage was the early hint.
- At the dotted line, MACD crossed back above its signal. Price based, chopped for a few days, then climbed back toward 1.1610.
- The cross came below zero. That says momentum is turning, but the bigger trend has not flipped yet.
| Role | How to use it | Best TF / market |
|---|---|---|
| Momentum confirm | Take EMA longs only with MACD above signal | H4 EUR/USD, GBP/USD |
| Trend side | Above zero favours longs | D1 gold, BTC |
| Early warning | Shrinking histogram in a trend | D1 any market |
| Entry trigger | Cross in the trend direction | H4 majors |
| Weekly bias | Weekly cross sets the season | W1 BTC, gold |
Rule of thumb: a MACD cross agreeing with the EMA trend is worth acting on; a cross against it is usually just a pullback. For the full read, including divergence, see the MACD indicator guide.
3. RSI for Swing Trading: The Pullback Timer
RSI (Relative Strength Index) measures how hard price has moved up versus down over recent bars, on a fixed 0 to 100 scale. Its classic levels are 70 (overbought, stretched up) and 30 (oversold, stretched down).
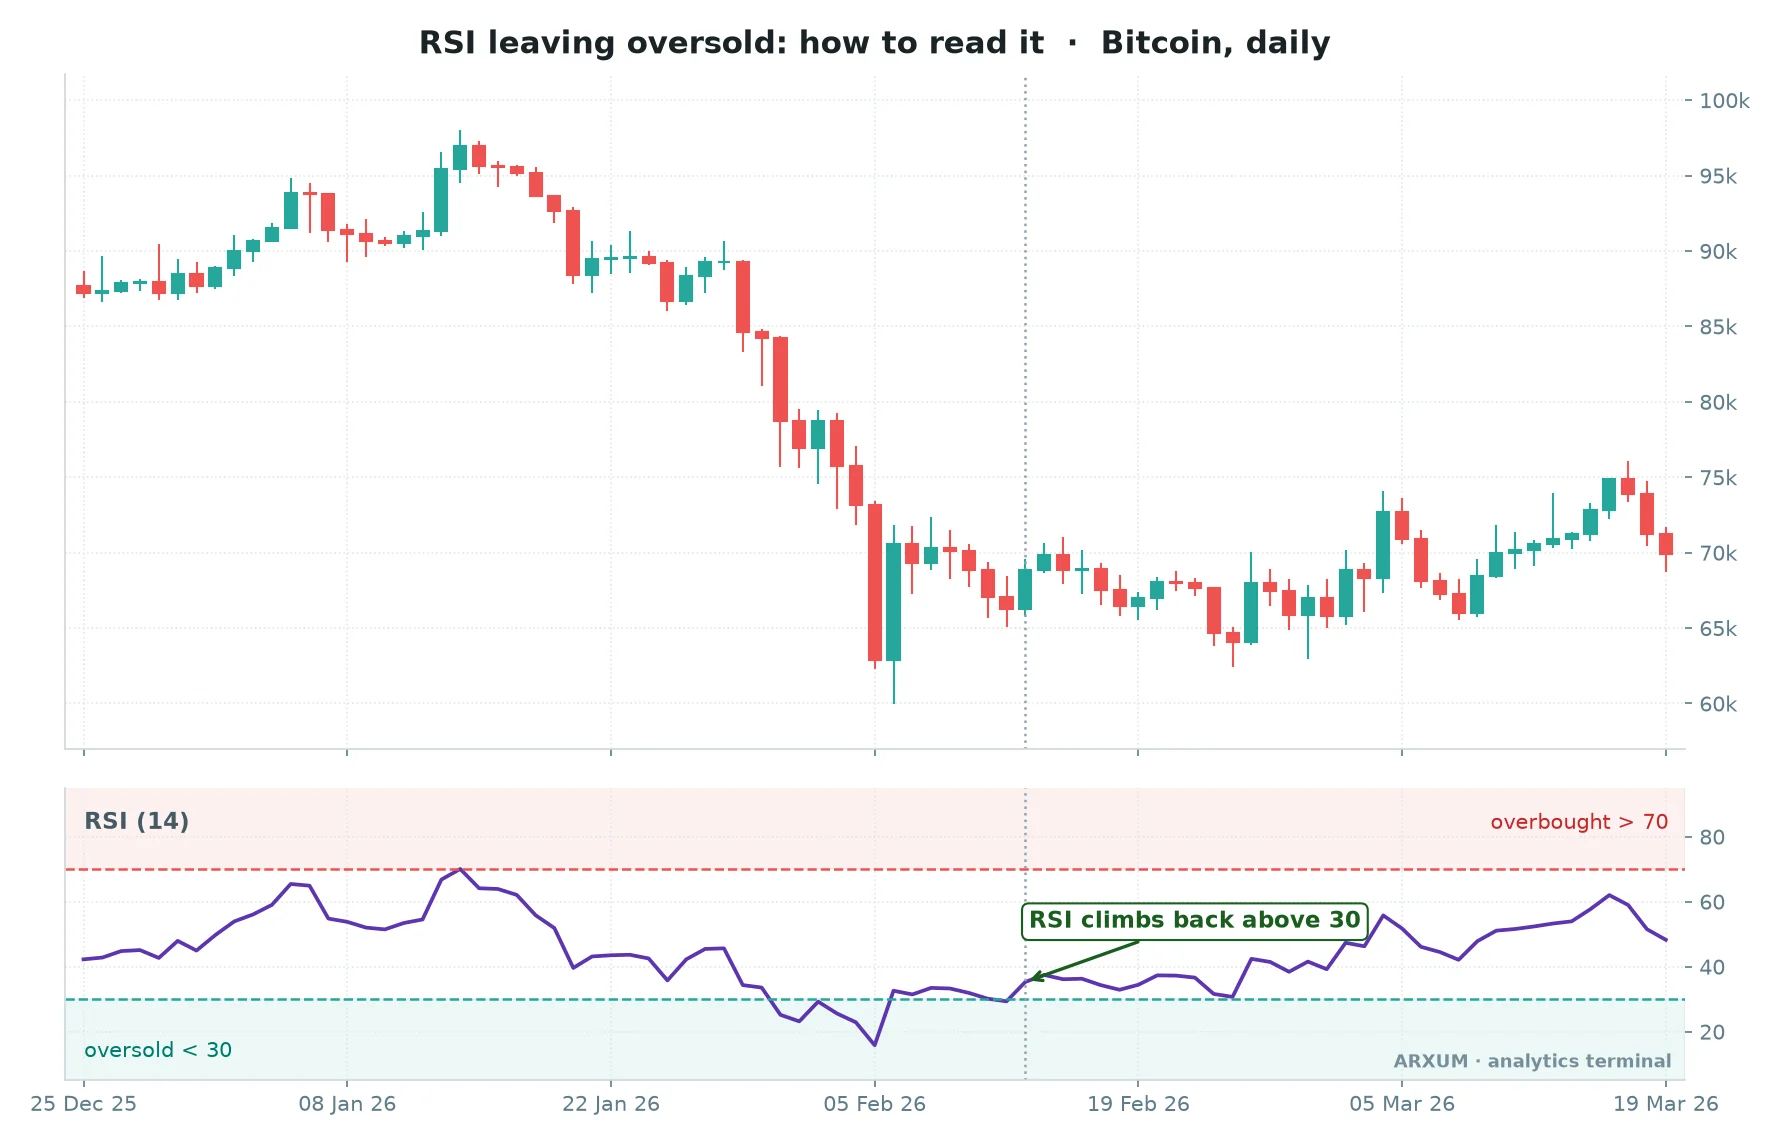
The Bitcoin chart shows the honest version of the RSI read:
- Price dropped hard from the mid-90k area to near 60k.
- RSI fell below 30 and stayed there through the worst of the drop, then poked back above it right after the crash.
- At the dotted line it crossed above 30 a second time. That cross confirmed the base price had been building.
- What came next was not a rocket. Price chopped between roughly 63k and 72k for weeks before grinding higher.
- The lesson: RSI leaving oversold marks the end of a selloff, not the start of a new uptrend.
How it looks in a trend vs a range:
- In a strong uptrend, RSI tends to hold above 40 and dips into the 40-50 zone on pullbacks. Those dips are buy zones.
- In a strong downtrend, RSI caps out around 55-60 on bounces. Those are sell zones.
- In a range, the classic 30 and 70 levels work best as fade signals. To fade is to trade against the move: sell near 70, buy near 30.
- Above 70 in a strong trend is not a sell signal. Trends can stay overbought for weeks.
| Role | How to use it | Best TF / market |
|---|---|---|
| Pullback entry | Buy RSI 40-50 dips in uptrends | D1 gold, H4 EUR/USD |
| Exhaustion read | Back above 30 ends a selloff | D1 BTC |
| Range trading | Fade 30 and 70 in sideways markets | H4 GBP/USD |
| Exit cue | Trim when RSI rolls over from 70+ | D1 any market |
| Bonus tell | Divergence at an extreme | D1, rare |
Divergence means price makes a new low while RSI makes a higher low (or the mirror at a top). It needs a clear gap to count, so it shows up rarely; treat it as a bonus, covered in the RSI divergence guide.
Rule of thumb: in a trend, read RSI as a dip finder. Only in a range does it work as an overbought or oversold signal.
The Supporting Cast: ATR, Bollinger Bands and Volume
These three rarely trigger a trade on their own. They size it, warn you, or confirm it.
ATR: the stop sizer
ATR (Average True Range) shows how far price typically moves in one bar. If gold’s daily ATR reads 40, a normal day spans about $40.
- Place the stop 1.5 to 2 times ATR away from entry, beyond the nearest swing point.
- Shrink your position when ATR expands, so the dollar risk stays the same.
- A sudden ATR spike after a quiet stretch often marks the start of a big move.
- Full detail sits in the ATR guide.
Bollinger Bands: the squeeze alarm
Bollinger Bands wrap price in a 20-bar average with an upper and lower band, two standard deviations away. A standard deviation is just a measure of how spread out recent prices are.
- When the bands pinch tight, volatility is low and a breakout is brewing.
- The squeeze does not tell you the direction. Let the EMA trend pick the side.
- In a strong trend, price “walks the band” along the upper or lower edge.
- See the Bollinger Bands guide for the band reads.
Volume: the honesty check
Volume shows how much traded during each bar. A breakout on rising volume has real buyers behind it.
- Stocks have central volume data, so this read is reliable there.
- Bitcoin has real volume per exchange but no central record, and some exchanges inflate their numbers. Read it on one major exchange or an aggregated feed.
- Spot Forex has no central volume. Platforms show tick volume, a count of price changes, which is a rough proxy only.
- On BTC daily, a breakout with volume well above the recent average is more trustworthy.
- On-balance volume turns this into a running line you can read like a trend.
| Tool | Role | Best use |
|---|---|---|
| ATR (14) | Stop and size | Every swing trade |
| Bollinger (20, 2) | Breakout timing | D1 gold, BTC |
| Volume | Confirmation | D1 BTC, stocks |
| Tick volume | Rough proxy | Forex, gold CFD |
Swing Trading Indicator Settings for Daily and 4-Hour Charts
Defaults exist for a reason: everyone watches them, so the levels tend to matter. Start here and only adjust if a market clearly needs it.
| Indicator | D1 setting | H4 setting |
|---|---|---|
| EMA pair | 20 and 50 | 20 and 50 |
| Long-term EMA | 200 | 200 |
| MACD | 12, 26, 9 | 12, 26, 9 |
| RSI | 14, levels 30/70 | 14, levels 30/70 |
| ATR | 14 | 14 |
| Bollinger Bands | 20, 2 | 20, 2 |
A few honest notes on settings:
- Tweaking RSI to 9 or 21 changes the speed, not the logic. The RSI settings guide covers when that helps.
- Some traders swap EMA 20/50 for 50/200 on the daily. That is slower and suits position trades held for months.
- The same settings work on H4 and D1. The timeframe already changes what each bar means.
How Many Indicators for Swing Trading? Combine Without Redundancy
Two or three is the sweet spot. Even the best swing trading indicators repeat each other if they come from the same family.
| Family | Members | Pick one |
|---|---|---|
| Trend | EMA, SMA, Supertrend, ADX | EMA 20/50 |
| Momentum | MACD, RSI, Stochastic | MACD or RSI |
| Volatility | ATR, Bollinger, Keltner | ATR |
| Participation | Volume, OBV | Volume (BTC, stocks) |
RSI, MACD and Stochastic all measure momentum. Stack all three and you get one opinion shown three times, which feels like confirmation but isn’t.
Three combos that cover the questions
| Combo | Style | Fits |
|---|---|---|
| EMA 20/50 + RSI + ATR | Trend pullbacks | D1 gold, H4 EUR/USD |
| EMA 50 + MACD + ATR | Momentum swings | H4 GBP/USD, D1 oil |
| Bollinger + volume + ATR | Squeeze breakouts | D1 BTC |
How the first combo reads in practice:
- EMA 20 above EMA 50 on the daily: trend is up, longs only.
- Price pulls back toward the EMA 20 and RSI dips into the 40-50 zone.
- A bullish candle closes off that dip: that is the entry candle.
- Stop goes 1.5 times ATR below the pullback low; target at least twice the stop distance, a risk/reward of 1:2.
The 1:2 means you risk one unit to make two. The risk-reward ratio guide explains why that matters more than the win rate.
Best Indicator for Swing Trading Crypto vs Forex
The same tools work on both, but the markets behave differently. Adjust the read, not the indicator.
| Factor | Crypto (BTC) | Forex (EUR/USD) |
|---|---|---|
| Trading hours | 24/7, no gaps | 24/5, weekend gaps |
| Typical move | Large daily swings | Smaller, steadier |
| Volume data | Real per-exchange volume, no central record | Tick volume only |
| RSI behaviour | Stays extreme longer | Mean-reverts sooner |
| Best core tool | EMA 20/50 + volume | EMA 20/50 + MACD |
| Stop width | Wide, ATR-based | Tighter, ATR-based |
- Crypto: the best indicator for swing trading crypto is usually a trend filter plus volume. Bitcoin trends hard, and volume from one major exchange or an aggregated feed shows whether a breakout has buyers.
- Forex: EMA plus MACD reads cleaner, since tick volume is too rough to lean on.
- Gold: sits in between. It trends like crypto but trades on Forex-style platforms with tick volume.
Which Swing Trading Indicator to Use When
| Market state | Lead tool | Support |
|---|---|---|
| Clear trend | EMA 20/50 | RSI dips |
| Trend tiring | MACD histogram | RSI rollover |
| Sharp selloff | RSI back above 30 | MACD cross |
| Tight range | Bollinger squeeze | Volume on break |
| Wide range | RSI 30/70 | ATR stops |
| Any trade | ATR | Position size |
Spotting a range early saves the most money. When the EMAs braid flat, trend tools misfire, so switch to range tactics or sit out.
What Not to Use for Swing Trading
Some tools are built for a different job. On a multi-day trade they add noise.
- Tick charts and DOM (depth of market). These read order flow second by second, useful for scalpers and useless for a trade held two weeks.
- Ultra-short oscillators. A 3-period RSI or a 5,3,3 Stochastic flips every few bars on H4.
- Five indicators at once. If the chart needs a legend to read, the decision gets slower, not better.
- Repainting custom scripts. Some free TradingView scripts redraw past signals, which makes history look perfect. Stick to built-in indicators.
Can You Swing Trade Without Indicators?
Yes. Plenty of swing traders use only price: swing highs and lows, trendlines, and support and resistance levels.
- Higher highs and higher lows define an uptrend without any line on the chart.
- A break of the last swing low is the same signal an EMA cross gives, often earlier.
- Most “naked” traders still glance at ATR to size the stop.
The price-only approach is covered in the market structure guide. Indicators just make the same reads faster and more consistent.
How to Size a Swing Trade With ATR: a Worked Example
Indicators find the trade, and ATR plus a fixed risk rule decide the size. Here is the math on a small account, using illustrative numbers.
Setup: a $1,000 account, risking 2% per trade, a long on EUR/USD on the 4-hour chart. A pip is the smallest standard price step in a currency pair, 0.0001 on EUR/USD.
- Risk budget: $1,000 × 0.02 = $20.
- ATR (14) on H4 reads 35 pips. Stop = 1.5 × 35 = about 52 pips below entry.
- One micro lot (0.01) on EUR/USD is worth about $0.10 per pip.
- Risk per micro lot: 52 × $0.10 = $5.20.
- Position: $20 ÷ $5.20 = 3.8, rounded down to 3 micro lots (0.03).
- Target at 1:2: 104 pips away, worth about 104 × $0.30 = $31 if hit.
- Three micro lots is about $3,500 of EUR/USD on a $1,000 account, roughly 1:3.5 effective leverage.
- Your broker may offer 1:100 or more, but that is only margin headroom. The 2% stop is what caps the loss.
A few discipline points that go with any indicator setup:
- Expect losing streaks. Three to six losses in a row is a sign the market regime (whether it is trending or ranging) may have changed, so pause and re-check the trend read.
- Don’t widen the stop because the indicator “still looks fine”. The ATR stop was set for a reason.
- Only trade money you can afford to lose. More on the math in the position sizing guide.
How to Add These Swing Trading Indicators on TradingView and MT4/MT5
On TradingView, open a chart, click the Indicators button and type the exact names below. On MT4/MT5, go to Insert, then Indicators, then Trend or Oscillators.
| Indicator | TradingView name | MT4/MT5 menu |
|---|---|---|
| EMA 20 / 50 | Moving Average Exponential | Trend, Moving Average (Exponential) |
| MACD | MACD | Oscillators, MACD |
| RSI | Relative Strength Index | Oscillators, RSI |
| ATR | Average True Range | Oscillators, ATR |
| Bollinger | Bollinger Bands | Trend, Bollinger Bands |
| Volume | Volume | Volumes, Volumes |
Two traps to avoid:
- On TradingView, add “Moving Average Exponential” twice, one at length 20 and one at 50. The plain “Moving Average” is the simple version and reacts slower.
- MT4’s built-in MACD draws the MACD line as bars and the signal as a dotted line, with no separate histogram. To match the EUR/USD chart, many traders install a two-line MACD from the MQL5 code base.
What Works: The Three Things to Remember
- One tool per question. Trend (EMA 20/50), momentum (MACD), timing (RSI). Adding a second tool from the same family adds nothing.
- Read the regime first. Trend tools shine in trends and bleed in ranges. Braided, flat EMAs mean stand aside or switch to range tactics.
- ATR sizes every trade. The best entry signal still fails sometimes, and a stop set by volatility keeps one loss from becoming a bad month.
Want ready-made rules built on these tools? The swing trading strategies guide turns them into full setups.
FAQ
What are swing trading indicators, in plain terms?
They are chart tools that help you hold a trade for days or weeks. Each one answers a question about price: which way the trend runs, whether momentum is building, whether a pullback is a good entry, and how far to put your stop. Most are free on TradingView and MetaTrader.
What is the best indicator for swing trading?
There is no single winner, but the EMA 20/50 pair is the most useful starting point because it tells you which side of the market to trade. Add RSI or MACD to time entries and ATR to set the stop. That trio covers trend, timing and risk without repeating itself.
How many indicators should I use for swing trading?
Two or three, each from a different family: one trend tool, one momentum tool, and ATR for stops.
Can you swing trade without indicators?
Yes. Many traders read only price: swing highs and lows, trendlines and support and resistance. Higher highs and higher lows define an uptrend just as an EMA crossover does. Most still use ATR to size the stop, since price alone does not tell you how volatile the market is.
What is the best RSI setting for swing trading?
The default 14 with levels at 30 and 70 works on both the daily and 4-hour charts. In a strong trend, watch the 40-50 zone for pullback entries instead of waiting for 30, because a trending market rarely gets that oversold. In a range, the classic 30 and 70 levels work as fade signals.
What is the best indicator for swing trading crypto?
A trend filter plus volume. Bitcoin trends hard and trades around the clock, so the EMA 20/50 on the daily keeps you on the right side. Each crypto exchange reports real volume, though there is no central record and some exchanges inflate theirs. Read it on one major exchange or an aggregated feed, and breakout confirmation is still more reliable than on Forex. RSI also stays at extremes longer on crypto, so do not fade it blindly.
Which timeframe is best for swing trading indicators?
The daily chart, with the 4-hour for finer entries. Signals on these charts carry more weight because each bar covers more trading. The 1-hour can refine an entry, but below that most swing indicators turn noisy.
Is MACD or RSI better for swing trading?
They do different jobs. MACD shows whether momentum behind a trend is growing or fading, so it suits confirming a trend trade. RSI shows how stretched price is, so it suits timing a pullback entry. Both are momentum tools, so pick one as your main read rather than stacking both.
What do the key swing indicator terms mean?
EMA: a moving average that weights recent prices more. Crossover: one line passing through another. MACD: the gap between two EMAs, showing momentum. Signal line: a smoothed copy of MACD. Histogram: bars showing the MACD-to-signal gap. RSI: a 0 to 100 gauge of how stretched price is. Overbought and oversold: RSI above 70 or below 30. ATR: the average size of one bar, used for stops. Regime: whether the market is trending or ranging.
Real-time trade setups with entry, stop loss and take profit. Daily market analysis. No subscription, no complicated theory.
🌍 Our recommended brokers


Reader Reviews
Be the first to review this — tell other traders what actually helped, or where it fell short.
Leave a Review

Momentum Trader & Technical Analyst
Trades momentum across crypto and forex since 2019, built around RSI, MACD, and volume. Turns discretionary setups into rule-based, systematic entries and validates them on data before they go live.