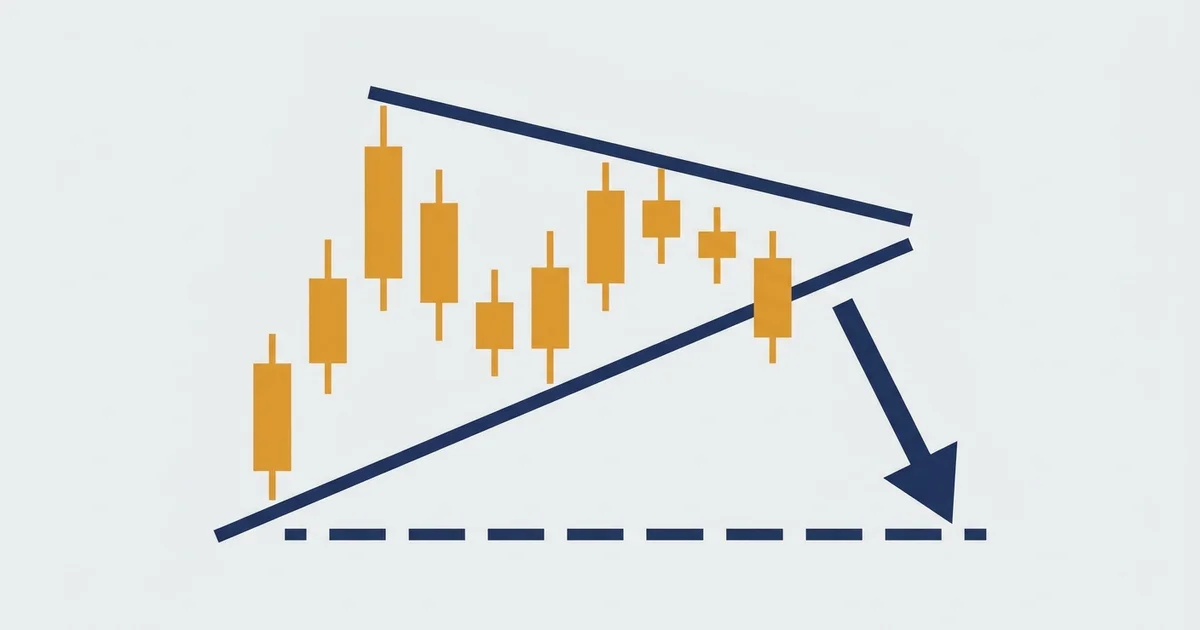

What the rising wedge pattern looks like
Two rising lines that squeeze together, with price trapped between them. Here is the textbook shape, drawn as a clean schematic.
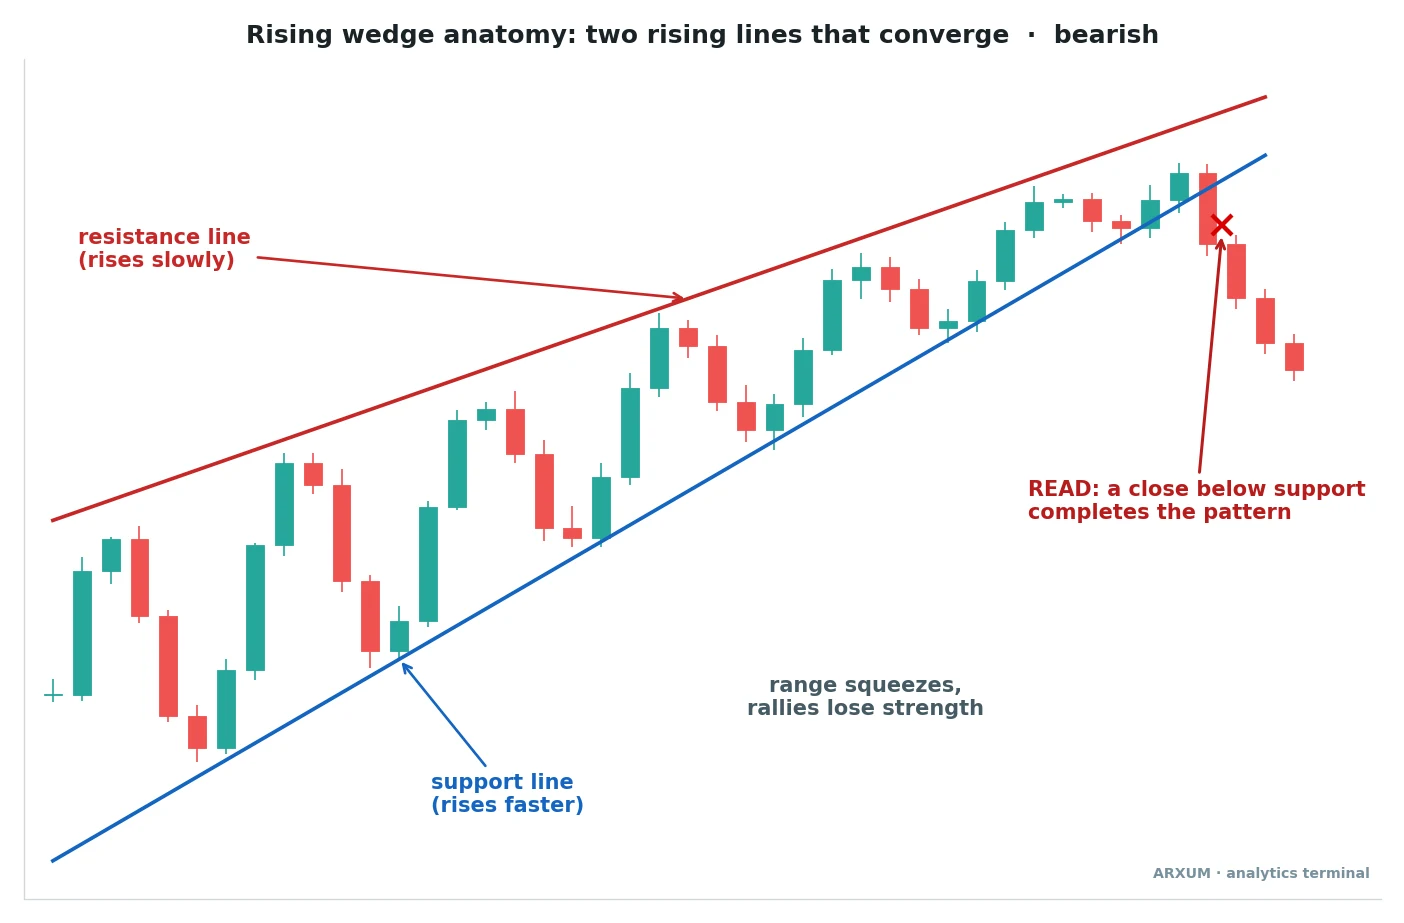
With the picture on screen, here is what each label tells you:
- Resistance line (red, rises slowly): connects the reaction highs. Each new high is only a little above the last one.
- Support line (blue, rises faster): connects the reaction lows. Dips get bought earlier and earlier.
- “Range squeezes, rallies lose strength”: the gap between the lines narrows, and each push up covers less distance than the one before.
- “Read: a close below support completes the pattern”: until a candle closes under the blue line, you are only watching a shape form.
- The candles after the cross: price falls away from the wedge, which is what the pattern predicts but never guarantees.
The core idea: buyers still win every swing, but by less each time, and the market is running out of people willing to pay higher.
Is a rising wedge bullish or bearish?
Bearish, in both of the places it shows up. What changes is the job it does.
To tell which case you’re in, read the trend with the 200-EMA, a moving average of the last 200 closes that weights recent ones more. Price below a falling 200-EMA means downtrend, and price above a rising one means uptrend.
| Where it forms | Pattern type | What it signals |
| Top of an uptrend | Reversal | Trend tiring, top forming |
| Rally inside a downtrend | Continuation | Bounce ending, trend resumes |
| Middle of a range | Weak or none | Usually noise |
- The continuation version is often the cleaner trade. You sell a bounce in the direction the bigger trend already points.
- The reversal version fights the main trend, so it needs more proof before you act on it.
- A wedge in the middle of a sideways market rarely means much. There is no exhausted move for it to end.
Rising wedge vs falling wedge, triangle and channel
The rising wedge has three close relatives, and confusing them is the most common drawing mistake. The falling wedge pattern is its mirror image.
| Pattern | Line slopes | Usual break |
| Rising wedge | Both up, converging | Down |
| Falling wedge | Both down, converging | Up |
| Ascending triangle | Flat top, rising floor | Up |
| Symmetrical triangle | One up, one down | Either way |
| Rising channel | Both up, parallel | None implied |
- If the top line is flat, you are looking at an ascending triangle, which usually breaks up, not down.
- If the lines run parallel, it is a channel. A channel can climb for months without any breakdown signal.
- The wedge needs both lines tilted the same way and closing in on each other. The full family is in the triangle chart patterns guide.
How to draw a rising wedge correctly
Most bad wedge trades start with a badly drawn wedge. Work through these in order:
- Find a move up that has lasted a while: at least 15-20 candles on the timeframe you trade.
- Mark the swing highs, the candles where price turned down. You need at least two, ideally three.
- Mark the swing lows, the candles where price turned up. Again two at minimum, three is better.
- Draw the resistance line through the highs, touching the turning points, not floating above them.
- Draw the support line through the lows the same way.
- Check the slopes: support must be steeper than resistance, so the lines would meet ahead of price.
- Check the touches: price should react at each line, not slice through it repeatedly.
| Mistake | What goes wrong | Fix |
| One touch per line | Any two points make a line | Wait for a second touch |
| Lines through bodies | Break level is vague | Use wicks consistently |
| Parallel lines | It is a channel | Skip the trade |
| Wedge too short | No real exhaustion | Go up a timeframe |
| Redrawing after a break | Hides a failed read | Keep the original lines |
The trendline trading guide covers anchoring lines to swing points in more depth. The same rules apply here, twice.
Wedge pattern trading: three ways to use the rising wedge
Traders use the same rising wedge in three different ways, and only two of them are short trades. The third protects a long you already hold.
In the tables below, D1 means the daily chart, H4 the 4-hour and H1 the 1-hour. TF is short for timeframe.
| Method | You act when | Fits best |
| 1. Close-below breakdown | A candle closes below | D1, Bitcoin, oil |
| 2. Retest short | Price returns and fails | H4, EUR/USD, GBP/USD |
| 3. Long-exit warning | The squeeze tightens | D1, H4, any market |
1. The close below support
This is the textbook entry. You wait for a full candle to close below the rising support line and act on that close.
Here it is on a daily chart of Bitcoin (BTC/USDT), during a relief rally, which is a short bounce inside a larger downtrend.
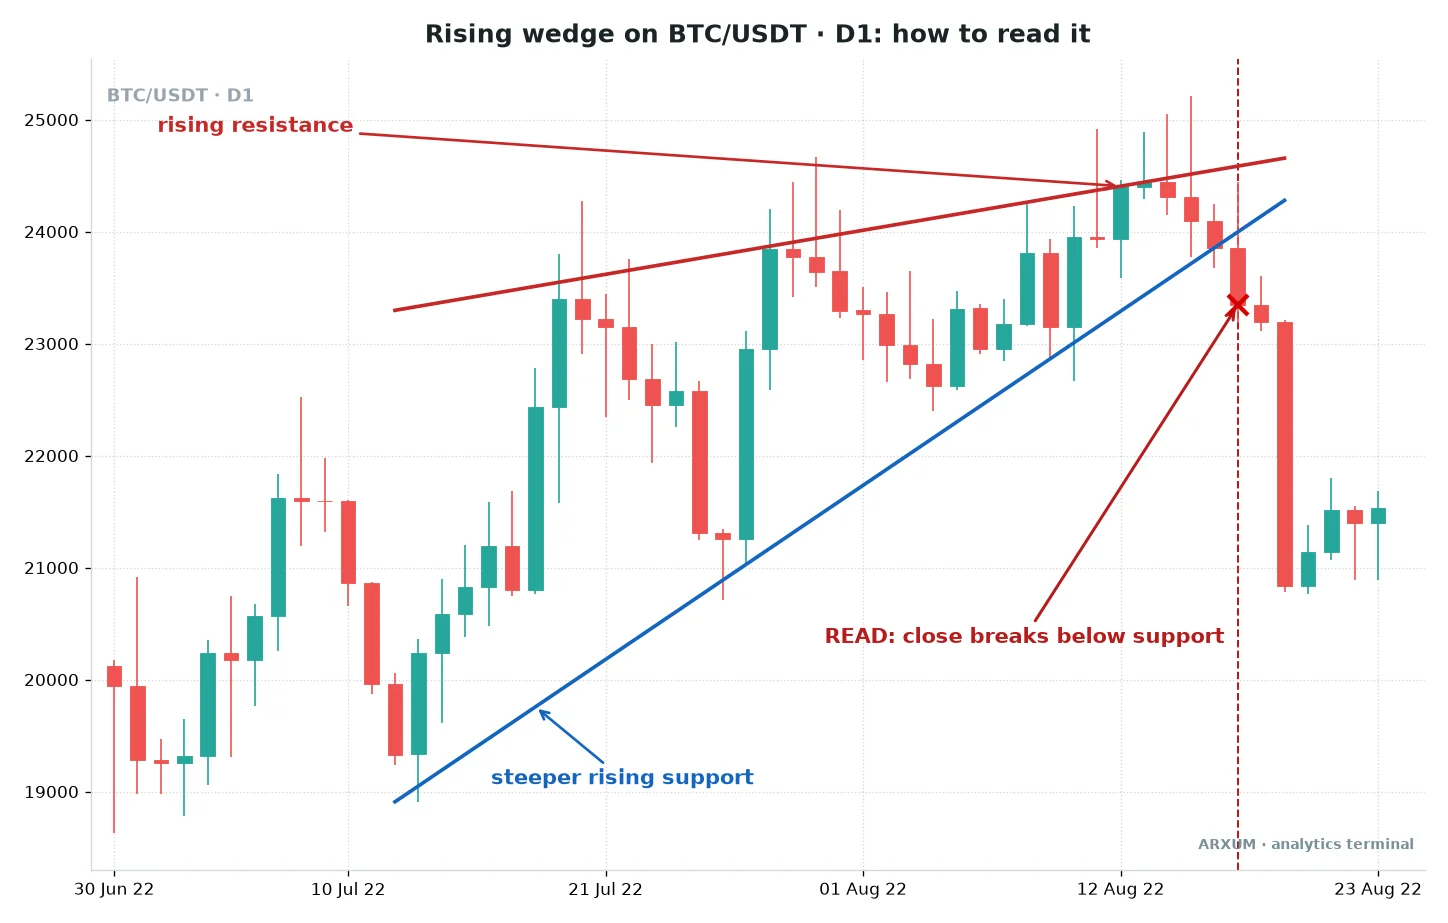
What the chart shows, left to right:
- A sharp low near 19,000, then a climb that keeps printing higher lows on the blue line.
- The highs creep up far more slowly, from about 23,300 to about 24,600 on the red line.
- Late in the wedge, wicks poke above resistance but no candle holds there. That failed push is a common last gasp.
- The read candle closes under support near 23,400. Within a few sessions price is below 21,000.
How a clean breakdown looks:
- The breaking candle has a real body that closes under the line, not just a wick dipping through.
- The next candle opens and stays below the old support.
- Candles were shrinking before the break, a sign the climb was already losing energy.
- On crypto, exchange volume often rises on the break, which supports the read.
| Role | How you use it | Best read |
| Entry trigger | Sell the close below | D1 Bitcoin, D1 oil |
| Trend read | Price under 200-EMA | D1, any market |
| Confirming gauge | Next candle stays below | D1, H4 |
| Filter | Skip if strong uptrend | Higher TF check |
| Exit cue | Close back inside wedge | Same TF as entry |
Rule of thumb: the daily close decides, not the intraday dip under the line.
2. The retest of broken support
Some traders never sell the first close. They wait for price to come back up to the broken support, watch it act as a ceiling, and sell when it fails there.
Here is that sequence on a 4-hour chart of EUR/USD.
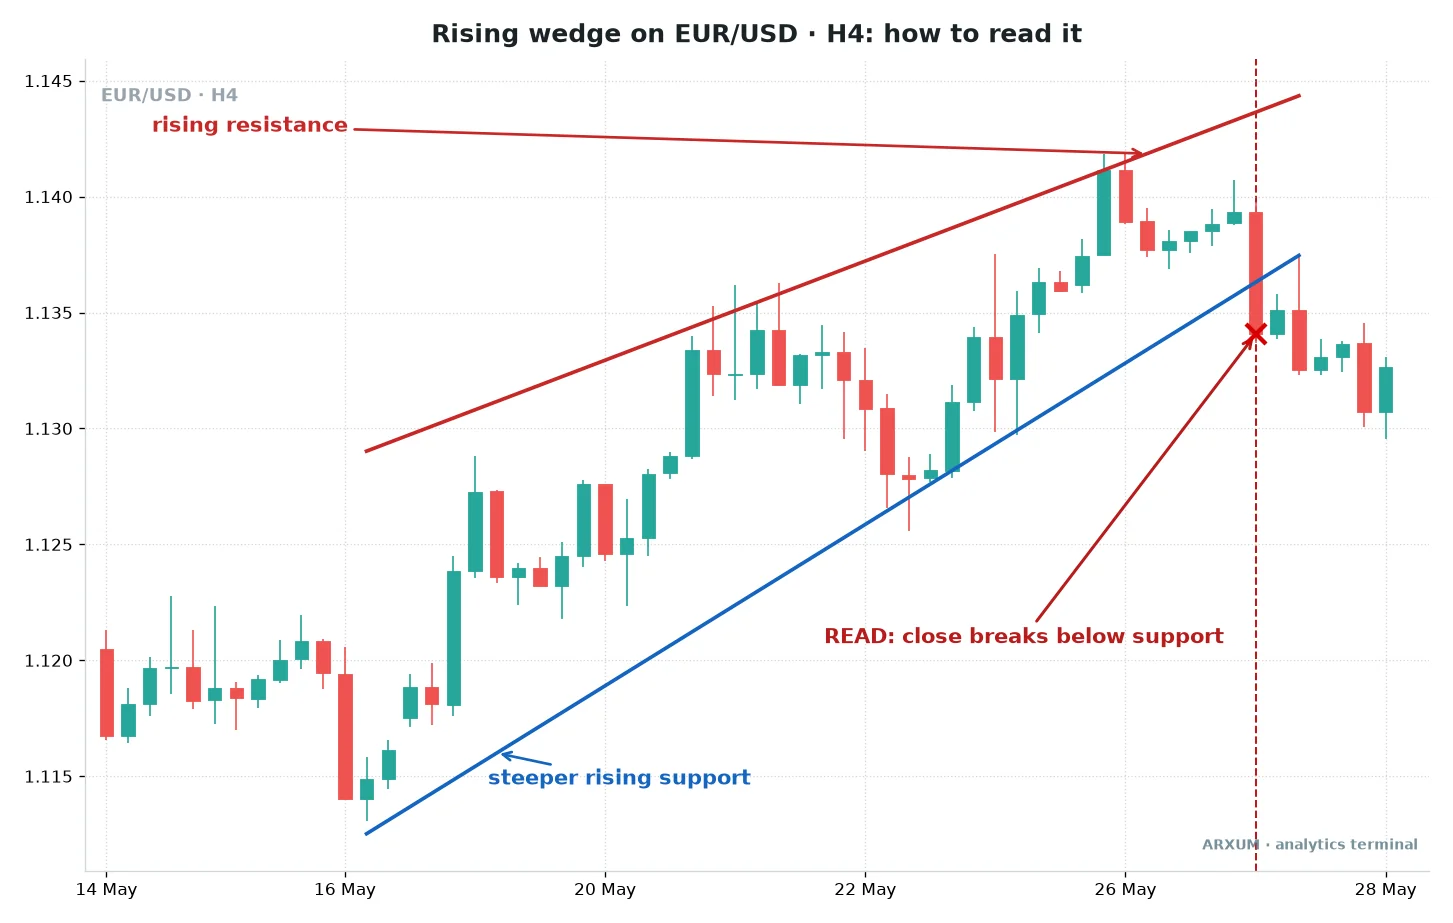
- The wedge runs from roughly 1.1125 on support and 1.1290 on resistance, both lines climbing.
- The break candle closes near 1.1340, under the blue line.
- Two candles later a wick tags the underside of the old support near 1.1375, then the candle closes lower around 1.1325.
- That failed retest is the entry for this method. The chart window ends near 1.1300, so on screen the move is still in progress.
Why traders like the retest:
- The stop can sit just above the retest wick, closer than a stop above the whole wedge.
- A tighter stop means a bigger position for the same risk, or the same position for less risk.
- If no retest comes, you simply miss the trade. That is the cost.
| Role | How you use it | Best read |
| Entry trigger | Sell the failed retest | H4 EUR/USD, GBP/USD |
| Trend read | D1 trend down or flat | D1 above the H4 |
| Confirming gauge | Rejection wick at line | H4, H1 |
| Filter | No retest, no trade | Any instrument |
| Exit cue | Close back above line | H4 |
Rule of thumb: on Forex pairs, the retest beats the first close, because currency breaks often snap back to the line.
In our wedge study, euro wedges lost overall. The retest is the more careful way in, not a proven edge, so treat FX wedges as low-confidence.
3. The exit warning for longs
Plenty of rising wedges never become a short trade worth taking. They are still useful if you already hold a long in that market.
A long, here, is a buy position that profits when price rises. The wedge tells you that position is running on fumes.
| Role | How you use it | Best read |
| Warning | Wedge shape forms | D1, H4 |
| Action 1 | Raise stop under support | Same TF as the long |
| Action 2 | Take partial profit | Near resistance |
| Full exit | Close below support | Same TF as the long |
| Re-entry | New base after the drop | Higher TF trend |
- Go back to the anatomy schematic at the top: the “rallies lose strength” zone is exactly where a long holder should start tightening.
- Moving the stop to just under the blue line locks in most of the climb.
- If the wedge breaks, the stop takes you out. If price breaks up through resistance instead, you are still in.
Rule of thumb: you do not need to short a rising wedge to profit from spotting one.
Confirmations that matter, and one that doesn’t
A rising wedge alone is a shape. These extra reads decide whether the shape deserves your money.
| Confirmation | What to look for | Weight |
| Trend context | Price under 200-EMA | High |
| Shrinking candles | Range tightens near apex (the point where the lines would meet) | High |
| Higher-TF agreement | D1 points down too | High |
| Failed poke above | Wick above, close back in | Medium |
| RSI divergence | Higher price, lower RSI | Bonus, rare |
| Volume spike | Volume jump on the break | Low |
In our wedge study, the filter sweep ran the usual confirmation menu against wedge breakouts, and a volume spike earned no place. Wedges break on exhaustion, not on a burst of buying or selling, so the breaking candle is often quiet.
- Trend context: a wedge that breaks with the bigger trend has the wind behind it. One that breaks against it needs everything else to line up.
- Shrinking candles: you read this by eye. Each candle near the end of the wedge is smaller than those at the start.
- RSI divergence: the Relative Strength Index (RSI) is a momentum gauge from 0 to 100. Bearish divergence means price makes a higher high while RSI makes a lower high, with a clear gap between them. It is a nice extra, not a requirement. The RSI divergence guide shows how to spot a real one.
- Volume on gold and Forex: platforms show tick volume there, a count of price updates rather than money traded. It is too noisy to confirm a wedge break.
The rising wedge across markets and timeframes
The shape forms everywhere, but it does not behave the same everywhere. Here is how it tends to read on the markets most of our readers trade.
| Instrument | Typical read | Best method |
| Bitcoin (BTC) | Clean breakdowns, fast drops | Close-below, D1 |
| Gold (XAU/USD) | Strong bull trend fights it | Long-exit warning |
| EUR/USD | Breaks often snap back | Retest short, H4 |
| GBP/USD | Sharper, noisier breaks | Retest short, H4 |
| Silver (XAG/USD) | Violent both ways | D1 only, small size |
| Oil (WTI) | Turns at cycle tops | Close-below, D1 |
- On spot gold (XAU/USD), a long bull market means most rising wedges are pauses in an uptrend. Shorting them fights the main move, so the long-exit use fits better.
- Bitcoin’s rising wedge was the strongest bearish case in our wedge study. The relief-rally wedge on the Bitcoin daily chart in method 1 is that kind of setup.
- Currency pairs print wedges constantly but tend to revert to the mean, meaning price drifts back toward its recent average. That is why the retest method suits them.
- Oil is cyclical, so a rising wedge near the top of a supply-driven rally has a real reason to turn.
| Timeframe | Quality | Use it for |
| D1 | Cleanest, fewest signals | Main trade decisions |
| H4 | Good, more frequent | Swing entries, retests |
| H1 | Noisy, many fakes | Timing a D1 or H4 idea |
| M15 and below | Mostly noise | Tightening stops only |
Rule of thumb: let the daily or 4-hour chart find the wedge, and use the 1-hour only to time it.
Rising wedge target and stop placement
The standard target is the measured move: the height of the wedge at its widest point, projected down from the breakout. Here is the arithmetic on the Bitcoin daily chart.
| Step | Calculation | Result |
| Widest point, top | Resistance at start | ~23,300 |
| Widest point, bottom | Support at start | ~18,900 |
| Wedge height | 23,300 − 18,900 | ~4,400 |
| Breakout close | Read candle | ~23,400 |
| Target | 23,400 − 4,400 | ~19,000 |
- Price fell to about 20,800 within a few sessions, roughly 60% of the way to that target, then stalled.
- That is common. The full measured move is a ceiling for expectations, not a promise.
- Many traders take part of the position off halfway to target and trail a stop on the rest.
Stop placement options, from widest to tightest:
| Stop location | Width | Suits |
| Above the wedge's last high | Widest | Close-below method |
| Above the breakout candle | Medium | Strong break candles |
| Above the retest wick | Tightest | Retest method |
Compare the target distance to the stop distance before you enter. Risking 50 pips (a pip is the smallest standard price step, 0.0001 on EUR/USD) to make 150 is a risk-to-reward of 1:3, as in the risk-reward ratio guide.
A setup offering less than 1:1.5 is usually not worth taking.
How to trade a rising wedge, step by step
Here is the full routine, using the EUR/USD retest from the 4-hour chart as the worked example.
- Confirm the trend on the daily chart. Price under or flat against the 200-EMA suits a short.
- Draw the wedge on the 4-hour chart with at least two touches per line.
- Wait for a 4-hour candle to close below support. On the chart, that close was near 1.1340.
- Wait for the retest. Price wicked back to about 1.1375 and closed lower, near 1.1325.
- Set the stop above the retest wick, at 1.1380. That is 55 pips from a 1.1325 entry.
- Set the target from the measured move. A height of about 165 pips from the 1.1340 break puts it near 1.1175, about 150 pips from entry.
- Check the reward-to-risk: 150 ÷ 55 ≈ 2.7, so roughly 1:2.7. Worth taking.
- Size the position, then place the order.
Sizing it on a small account
Risk 2% of the account per trade and size the position to the stop. On EUR/USD, one micro lot (0.01 lot) moves about $0.10 per pip.
| Step | $1,000 account | $500 account |
| Risk budget at 2% | $20 | $10 |
| Risk per micro lot | 55 × $0.10 = $5.50 | 55 × $0.10 = $5.50 |
| Division | $20 ÷ $5.50 = 3.6 | $10 ÷ $5.50 = 1.8 |
| Round down | 3 micro lots (0.03) | 1 micro lot (0.01) |
| Actual risk | $16.50, 1.65% | $5.50, 1.1% |
- Always round down, never up. Rounding up would push the risk over 2%.
- Three micro lots on EUR/USD control about 3,000 euros, roughly $3,400. On a $1,000 account that is an effective leverage near 1:3.4.
- Broker leverage of 1:100 or more is just margin headroom that lets you open that size. It adds no extra risk as long as the stop holds. A gap can still jump past it.
A broker that offers micro lots makes this sizing possible on a small account.
| Market and stop | Risk per minimum size | Fits $1,000? |
| Gold H4, $22 stop | 0.01 lot (1 oz) = $22 | Just over, 2.2% |
| Gold H4 on $500 | 0.01 lot = $22 | No, 4.4% |
| Bitcoin D1, 1,300 stop | 0.01 BTC = $13 | Yes, 1.3% |
On gold, one micro lot is 1 ounce, so every $1 move is $1 of profit or loss. A $500 account cannot hold a typical gold wedge stop inside 2%, so EUR/USD is the better place to start.
Placing the order
- Retest method: once the retest candle closes back below the line, open a market sell (an order that sells right away at the current price). Or place a sell limit just under the broken support before price gets there. A sell limit is an order that sells automatically if price rises to your level.
- Close-below method: open a market sell right after the breaking candle closes. Some traders use a sell stop a few pips under that candle’s low instead. A sell stop is an order that sells automatically if price falls to your level.
- Stop-loss field: type the stop price, 1.1380 in the example.
- Take-profit field: type the target, 1.1175 in the example.
- Volume or lot field: type the size from the table, 0.03 or 0.01.
Setting up the chart
- On TradingView (free), open the chart, pick the Trend Line tool from the left toolbar and draw both lines through the swing points.
- For the trend read, click Indicators and add “Moving Average Exponential” with length 200.
- For the optional momentum check, add “Relative Strength Index” with length 14.
- On MT4 or MT5, use Insert, then Objects, then Trendline for the lines. Add the EMA via Insert, Indicators, Trend, Moving Average, method Exponential, and RSI via Insert, Indicators, Oscillators.
Keeping the risk in check
A rising wedge will lose some of the time, even when every box is ticked. The pattern only has an edge over many trades, never on any single one.
- After 3-6 losses in a row, pause and check the conditions. The market regime may have changed, for example a downtrend turning into a strong rally.
- One bad week is normal variance and no reason to quit. A long stretch of results clearly worse than you expected is a reason to step back.
- After a big win, size the next trade by the same 2% rule. Euphoria is when traders double up and give it back.
- Only trade with money you can afford to lose.
The position sizing guide covers the 2% rule and the division step in more detail.
Where the rising wedge fails
Every pattern has a failure mode, and the rising wedge has a few predictable ones.
| Failure | What happens | How to avoid it |
| Upside breakout | Price breaks resistance | Respect the stop |
| Snap-back | Close below, then back in | Use the retest method |
| Sideways drift | Price slides along support | Exit near the apex |
| Strong bull trend | Wedge is just a pause | Don't short above 200-EMA |
| Short target miss | Drop stalls early | Take partial profits |
- The upside breakout is the most painful one. A wedge that resolves up often runs hard, because shorts (traders who bet on a fall) rush to buy back.
- Near the apex, where the lines almost meet, the pattern loses meaning. If nothing has broken by then, step aside.
- On a market in a powerful uptrend, like gold through a bull run, most rising wedges simply break up and keep going.
Which method to use when
| Your situation | Method | Timeframe |
| Trading Bitcoin or oil | Close-below | D1 |
| Trading EUR/USD or GBP/USD | Retest short | H4 |
| Already long the market | Long-exit warning | Same as the long |
| Gold in a bull trend | Long-exit warning | D1 |
| Small account, tight stop | Retest short | H4 |
What works, in three lines:
- Trade the rising wedge with the bigger trend: a bounce wedge inside a downtrend, broken on a daily close.
- On currency pairs, wait for the retest of broken support and keep the stop above the retest wick.
- In a strong uptrend, don’t short it. Use it to tighten the stop on your long.
If you want the bullish mirror image, the falling wedge pattern, and the tested numbers behind both, the wedge chart patterns guide is the next read. For another bearish continuation shape, see the bear flag pattern.
Key terms
- Rising wedge: two rising, converging trendlines, with support steeper than resistance. Usually breaks down.
- Falling wedge: the mirror image, two falling, converging lines. Usually breaks up.
- Swing high / swing low: a candle where price turned down or up, used to anchor the lines.
- Apex: the point where the two lines would meet.
- Retest: price coming back to a broken line before moving away again.
- Measured move: the wedge’s height projected from the breakout, used as the target.
- 200-EMA: an exponential moving average of the last 200 closes, used to read the trend.
- RSI: Relative Strength Index, a 0-100 momentum gauge.
- Tick volume: a count of price updates, shown instead of traded volume on Forex and gold.
- Pip: the smallest standard price step, 0.0001 on EUR/USD.
- Micro lot: 0.01 of a standard lot, about $0.10 per pip on EUR/USD.
FAQ
What is a rising wedge pattern, in plain terms?
It is a chart shape where price keeps making higher highs and higher lows, but the lows rise faster than the highs. The two trendlines squeeze together, and each rally gains less ground than the last. It shows buyers running out of steam, and it usually ends with a break below the lower line.
Is a rising wedge bullish or bearish?
Bearish. At the top of an uptrend it warns of a reversal, and as a bounce inside a downtrend it signals the downtrend is about to resume.
Does the rising wedge pattern actually work?
It works best when it agrees with the bigger trend, for example a relief rally wedge inside a downtrend that breaks on a daily close. It works poorly against a strong uptrend, where many rising wedges simply break up. On currency pairs, breaks often snap back to the line, so the retest entry is the safer way in. No pattern wins every time, so the stop and position size matter more than the shape.
What is the difference between a rising wedge and a falling wedge?
They are mirror images. A rising wedge has two rising, converging lines and usually breaks down. A falling wedge has two falling, converging lines and usually breaks up.
How is a rising wedge different from an ascending triangle?
Look at the top line. An ascending triangle has a flat top and usually breaks up. A rising wedge has a top line that slopes up, more slowly than the bottom line, and usually breaks down. One flat line versus two rising lines is the whole difference, and it flips the expected direction.
What is the best timeframe for a rising wedge?
The daily and 4-hour charts. Wedges there reflect days or weeks of real buying and selling, so the breaks mean more. The 1-hour chart is fine for timing an entry the higher chart has already set up. Anything faster prints wedges constantly, and most of them are noise.
Where do I put the stop loss on a rising wedge?
Above the wedge's last swing high for a close-below entry, or just above the retest wick if you enter on a retest. The retest stop is tighter, which allows a larger position for the same risk.
Do I need volume to confirm a rising wedge breakdown?
No. Wedges usually break on exhaustion, so the breaking candle is often quiet. On Bitcoin, rising exchange volume on the break is a mild plus. On gold and Forex your platform shows tick volume, which is too noisy to rely on. Trend context, shrinking candles and a clean close matter more.
How much money do I need to trade a rising wedge?
With micro lots, a few hundred dollars is enough on EUR/USD. At 2% risk, a $1,000 account risks $20, which fits 3 micro lots on a 55-pip stop. A $500 account fits 1 micro lot on the same stop. Gold usually needs a wider stop, so a small account may not fit even the minimum size there.
What do apex, retest and measured move mean?
The apex is where the two wedge lines would meet. A retest is price returning to the broken support line before falling away. The measured move is the wedge's height at its widest point, projected down from the breakout to set a target.
Real-time trade setups with entry, stop loss and take profit. Daily market analysis. No subscription, no complicated theory.
🌍 Our recommended brokers


Reader Reviews
Be the first to review this — tell other traders what actually helped, or where it fell short.
Leave a Review

Quant Researcher & Systems Builder
Quantitative researcher who builds the automated systems behind Arxum strategy testing. Works in Python and Pine Script, using AI alongside classic backtesting to validate strategies on years of real data.
