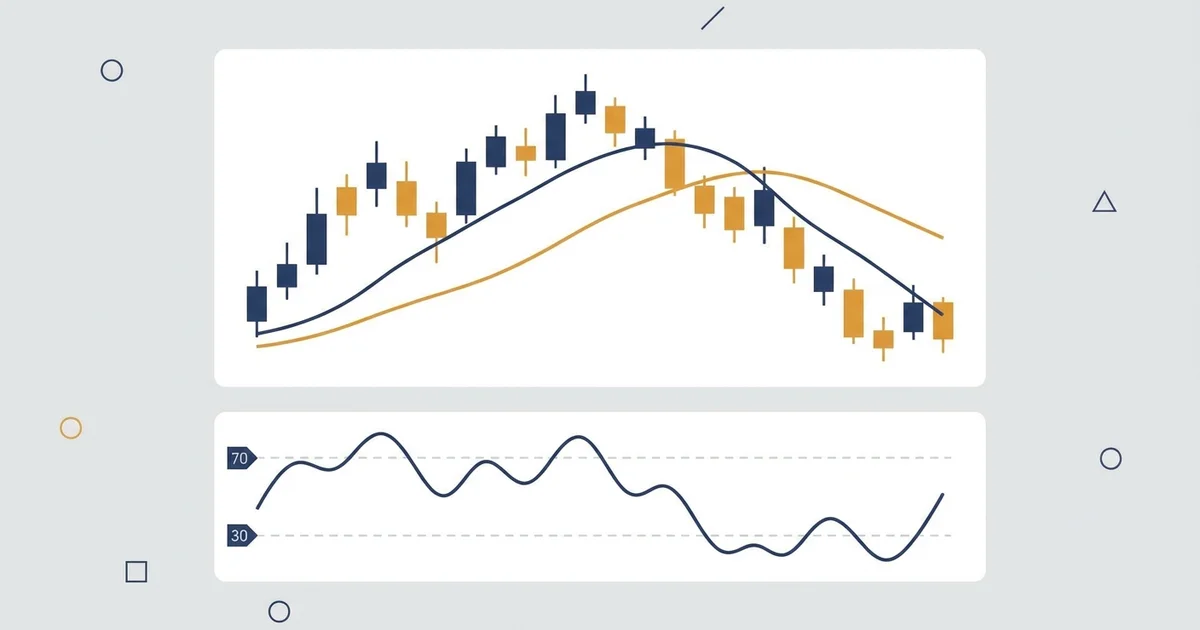

What EUR/USD technical analysis actually is
It is a way to answer three questions from the chart: which way is the pair going, is momentum behind that move, and is now a fair price to act. Here is all three on one screen before we break them apart.
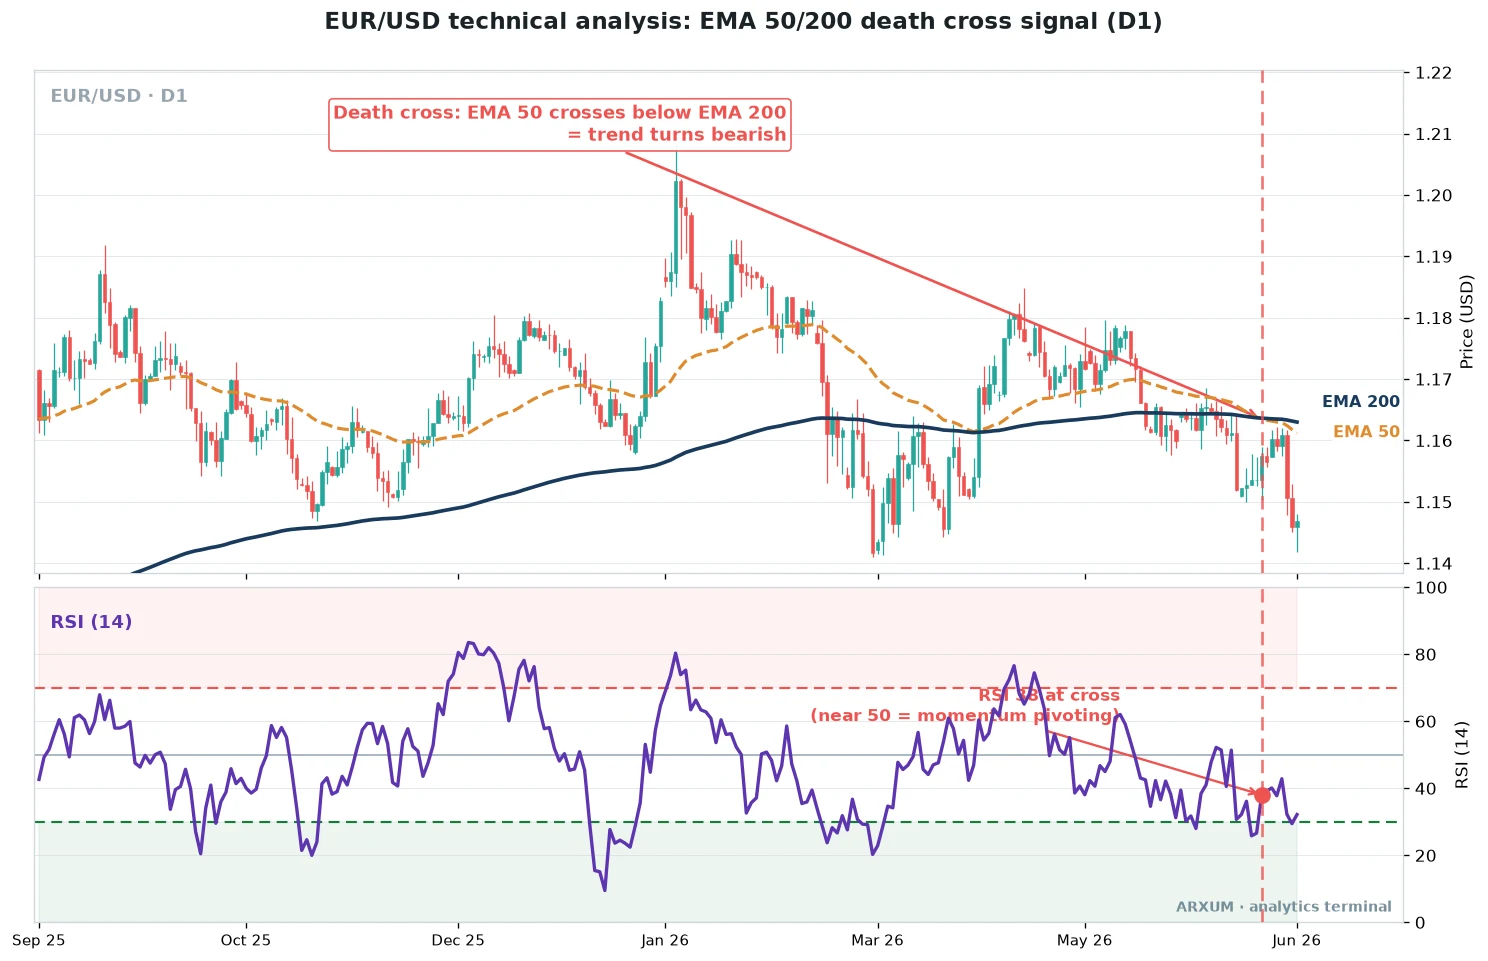
The picture above holds the whole method. What each part is doing:
- The two moving lines are the EMA 50 (orange, faster) and EMA 200 (navy, slower), both exponential moving averages that weight recent price more heavily. Price above both means buyers are in charge; price below means sellers are.
- The cross where the faster line drops under the slower one is a death cross. It flags the trend turning down. The mirror, a golden cross, turns it up.
- The lower panel is RSI (14), a momentum gauge from 0 to 100. The 70 and 30 dashed lines mark overbought and oversold, and the 50 midline marks the tilt between buyers and sellers.
- Read them together. The trend sets your direction, momentum confirms it, RSI times when to step in.
That is the spine of every read below. None of it depends on a EUR/USD forecast or a news call.
You are reading what the pair is doing, not guessing what it will do.
One shorthand runs through the tables below: D1 is the daily chart, H4 the 4-hour, and H1 the 1-hour. Bigger timeframes set the trend, smaller ones time the entry.
Why EUR/USD is the pair TA works on best
Technical reads are only as clean as the market underneath them. The euro against the dollar is about as clean as currency trading gets, and that is not an accident.
| Feature | Why it helps your reads |
|---|---|
| Deepest liquidity | Roughly a quarter of all daily currency turnover runs through it |
| Tightest spread | Low cost per trade, so small edges survive the round trip |
| Fewest gaps | Continuous flow means levels and patterns hold, not jump |
| Clear macro driver | ECB versus Fed policy sets the big trend, so structure is readable |
| Mirrors the dollar index | DXY gives you a second screen to confirm every move |
| Predictable rhythm | The session structure repeats daily, so timing reads keep holding |
| Well-mapped levels | Years of history mean the key round numbers are known in advance |
The one force behind the big swings is the gap between the two central banks. When the Fed keeps rates higher than the ECB, money favours the dollar and the pair drifts down.
When the gap closes, the euro recovers. You do not trade the news, but you respect it: the calendar tells you when a clean chart can turn into a spike.
For the macro side of the coin, see fundamental versus technical analysis.
Read one: trend, with moving averages
Start with direction, because everything else is noise if you fight the trend. The anatomy chart above is the trend read in full: two EMAs and where price sits against them.
How it looks on the chart:
- Price riding above a rising EMA 50 and EMA 200 is a clean uptrend.
- Price pinned under both falling lines is a downtrend.
- The two lines crossing is the trend-change flag: golden cross up, death cross down.
- Price chopping across flat lines is a range, and the cross signals will whipsaw.
The moving-average read is the same tool covered in our moving average crossover guide, and the exponential moving average is the version that reacts a touch faster to fresh price. Here is how to put it to work.
| Role | How you use it | Best read |
|---|---|---|
| Regime read | Above EMA 200 = long bias only, below = short bias only | Daily, EUR/USD |
| Trend trigger | EMA 50 crossing the EMA 200 (golden or death cross) | Daily / H4 |
| Entry filter | Take pullbacks to the EMA 50 in the trend's direction | H4, EUR/USD |
| Trailing guide | Ride the move, trail your stop behind the EMA 50 | H4 / Daily |
| Portable read | The same cross reads clean on gold and other majors | Daily, XAU/USD |
Read two: momentum, with MACD
Trend tells you the way; momentum tells you whether the move has fuel. MACD is the standard gauge, and the reason it belongs in a EUR/USD routine is that it ports.
The exact same read works on gold, which is where the next chart lives.
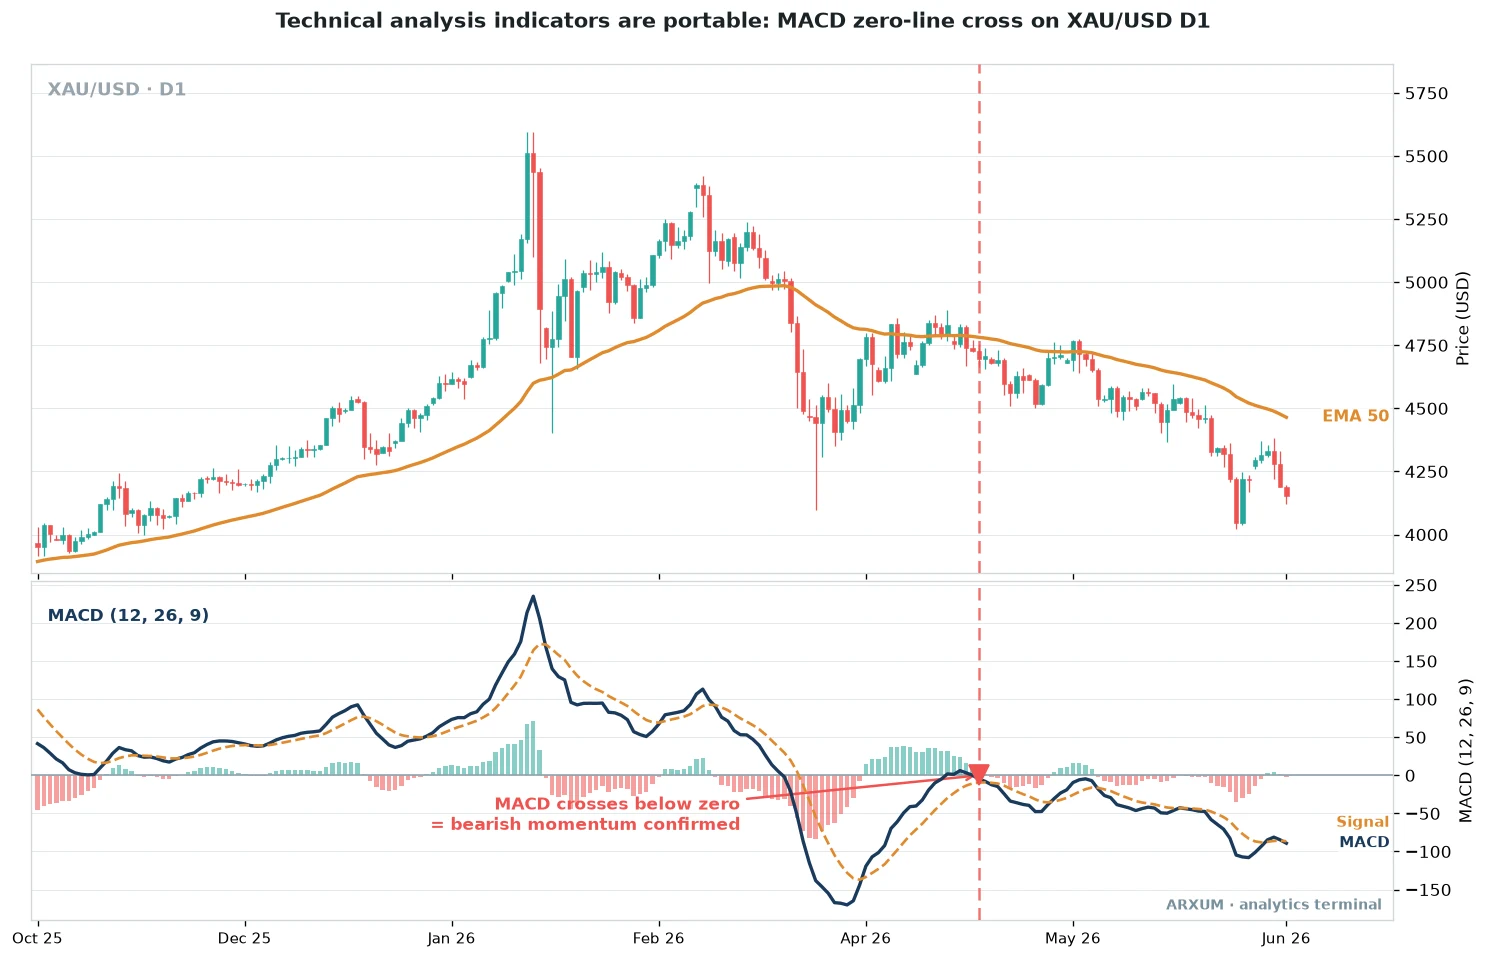
On the chart, MACD (12, 26, 9) is two lines plus a histogram. The read is the same whether you point it at the euro or the metal:
- MACD above zero means momentum is bullish; below zero, bearish.
- The line crossing its signal line is the entry cue, taken in the trend’s direction.
- The line crossing the zero line confirms a bigger momentum shift, as it does on gold above.
- The histogram shrinking toward zero warns the current push is running out.
Full mechanics live in the MACD indicator guide. The point of showing it on gold is simple: learn the read once, use it on any liquid market.
Here is the role table for the euro.
| Role | How you use it | Best read |
|---|---|---|
| Momentum read | Above zero = buyers pushing, below = sellers pushing | Daily, EUR/USD |
| Entry trigger | Signal-line cross in the daily trend's direction | H4, EUR/USD |
| Confirmation | Zero-line cross backs a moving-average trend change | Daily, XAU/USD |
| Divergence tell | Price new high, MACD lower high = the move is tiring | H4 / Daily |
| Filter | Skip a signal when MACD disagrees with the trend | H4, EUR/USD |
Read three: timing, with RSI
The last read is the stopwatch. RSI does not tell you direction, it tells you when the pair is stretched enough that a bounce or a fade is likely.
It is best on the faster charts where entries actually happen.
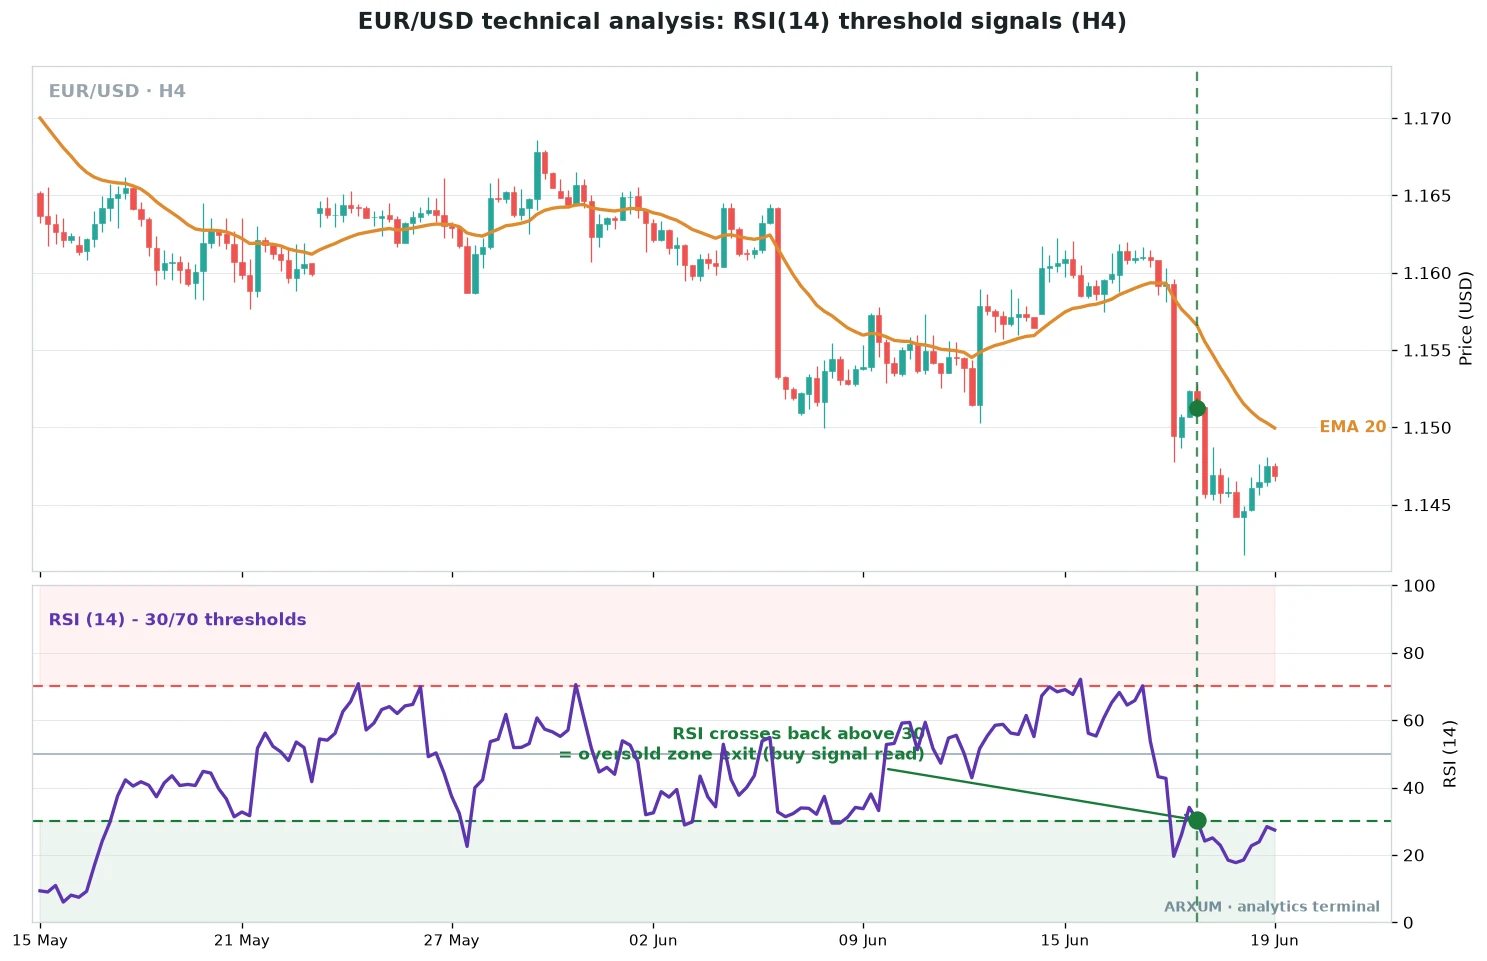
RSI (14) with the 30 and 70 lines is the setup. Note the green marker on the chart: the signal is not RSI touching 30, it is RSI climbing back out.
- The orange line on price is the EMA 20, a faster 20-period moving average used on the lower timeframes to track the short-term trend.
- Above 70 the pair is overbought, stretched to the upside.
- Below 30 it is oversold, stretched to the downside.
- The trade read is the exit, RSI crossing back above 30 (bounce) or back below 70 (fade), not the touch itself.
- The 50 line is the tiebreak: holding above it means momentum still favours the buyers.
One warning that saves a lot of pain: in a strong trend, RSI can sit above 70 or below 30 for a long stretch. Do not fade a runaway move just because RSI is high.
Our RSI indicator guide covers the divergence read, and RSI settings covers when to shift off the default 14.
| Role | How you use it | Best read |
|---|---|---|
| Entry timing | Enter on the cross back out of 30 or 70, with the trend | H4, EUR/USD |
| Trend-adjusted zone | In an uptrend treat the 40 to 50 area as the real oversold | H4 / H1 |
| Momentum read | Holding above 50 = buyers in control | H1, EUR/USD |
| Divergence tell | Price lower low, RSI higher low = selling exhausting | H4, EUR/USD |
| Caveat | In a strong trend RSI stays stretched, do not fade blindly | Daily, EUR/USD |
The levels that have mattered for years
Indicators float on top of price; the levels are price itself. EUR/USD respects a short list of round numbers that have acted as support and resistance for years, and they are worth marking before any indicator goes on the chart.
| Level | Why it matters | How the pair tends to act |
|---|---|---|
| 1.2500 | Old cycle-high zone | Caps big rallies, sellers lean in |
| 1.2000 | Round-number pivot | Battleground, sharp reactions |
| 1.1800 | Interim swing shelf | Minor level, quick reactions on the way through |
| 1.1000 | Long-run midpoint | A magnet, price keeps returning |
| 1.0500 | Recent range floor | Buyers defend, bounces begin |
| 1.0000 (parity) | Psychological floor | Rare, marks deep euro weakness |
Parity is the one to remember. When the pair fell all the way to 1.0000 not long ago, it was its first touch in two decades, and it drew buyers hard.
Round numbers work because everyone can see them, so orders stack there. For drawing the diagonal versions of these lines, see trendline trading.
Trading the sessions
The same chart behaves differently depending on the clock. EUR/USD has a daily rhythm set by which financial centres are open, and reading it stops you trading a dead market.
| Session | Rough UTC window | How EUR/USD moves |
|---|---|---|
| Asian | 00:00 to 07:00 | Quiet, tight range, small moves |
| London open | 07:00 to 09:00 | Ranges break, volatility jumps |
| London / NY overlap | 12:00 to 16:00 | Busiest, cleanest trends, tightest spread |
| NY afternoon | 16:00 to 20:00 | Fades, drift back toward the daily pivot |
The overlap is where the day’s real move usually prints. The quiet pre-London range is fade territory, not breakout territory.
Full session detail sits in our forex market hours guide.
The DXY mirror
The dollar index is your second screen. EUR/USD makes up the biggest slice of DXY, so the two move as near-mirror images, close to a perfect inverse most of the time.
- DXY up, EUR/USD down. If your euro long is working, the dollar index should be falling to match.
- They disagree? Treat the signal as weak and wait. A euro move with no dollar confirmation often stalls.
- Use it to confirm, not to trade. DXY is a health check on the pair, not a separate setup.
This one habit filters out a lot of false starts, since a genuine EUR/USD trend almost always shows up as a genuine dollar trend the other way.
Which read for which job
No single read is the answer. The value is in agreement.
Running the whole menu of confirmations against the pair and keeping only the ones that pull their weight is what we call the filter sweep. On EUR/USD the read that earns its place first is the trend itself, the regime gate that decides longs-only or shorts-only before you check anything else.
| Your question | The read to use | Where it lives |
|---|---|---|
| Which way is the trend? | Moving averages, EMA 50 / 200 | Daily |
| Is momentum with me? | MACD zero line and signal cross | Daily / H4 |
| Is this a fair entry price? | RSI threshold plus a level | H4 / H1 |
| Where do I get out? | Prior support/resistance and EMA trail | H4 |
| Is the whole dollar moving? | DXY, the inverse mirror | Daily |
The best trades are the ones where the trend, the momentum read and the level all point the same way. When they split, that is the market telling you to wait.
A daily routine for EUR/USD
This is how to analyze EUR/USD in one pass, top down, so the fast charts serve the slow ones instead of arguing with them.
- Daily trend first. Price versus the EMA 50 and 200. Note any golden or death cross. This sets long-only or short-only for the day.
- Mark the levels. Draw the nearest round-number support below and resistance above from the table earlier.
- Drop to H4 for structure. Higher highs and lows, or lower ones. Find where the EMA 20 (the faster 20-period average) sits as dynamic support.
- Time the entry on H1. Wait for RSI to leave 30 or 70, or a MACD cross, in the daily trend’s direction.
- Set the stop and target. Stop beyond the last swing or level, then size so the loss is a fixed slice of the account: on a $500 account, a 1% risk is $5, and the entry-to-stop distance sets how big the position can be. Our risk-reward ratio guide shows the 1:X math.
- Cross-check DXY. It should be moving the opposite way. If not, stand down.
Run the same six steps every session and a EUR/USD trading strategy stops being a guess and becomes a checklist.
Pull these up yourself
Every read here is a free, built-in indicator. Type the exact names so you get our chart, not a look-alike variant.
- TradingView. Type EUR/USD, hit the Indicators button, add “Moving Average Exponential” twice (length 50 and length 200), then “MACD” at the default 12/26/9, then “Relative Strength Index” at length 14.
- MT4 / MT5. Insert then Indicators then Trend for the two EMAs; Insert then Indicators then Oscillators for MACD and RSI.
- Set the timeframe ladder. Look at Daily first for the trend, then H4 for structure, then H1 for the trigger.
- Add DXY as a second chart so you can glance at the mirror without leaving your setup.
Common mistakes
- Trading against the daily trend on a five-minute signal. The higher timeframe wins.
- Fading RSI at 70 in a strong trend. It can stay stretched far longer than your stop.
- Treating a EUR/USD forecast headline as a signal. Read the chart, let the calendar set your caution.
- Entering in the dead Asian range and calling the chop a breakout.
- Leaning on one indicator. A single read with no confluence is a coin flip.
- Ignoring the ECB and Fed calendar and getting caught in a policy spike.
Reading it responsibly
Technical analysis stacks the odds, it does not guarantee the next trade. A good read can still lose, so the plan matters more than any single signal.
- Risk a small, fixed slice of the account per trade, so a losing streak is survivable, not fatal.
- Take the trades your rules gave you, not the ones a forecast tempted you into.
- A run of losses usually means the regime shifted (a range turned to a trend, or the reverse), so step back and re-read the daily before pressing on.
- Keep the position size fixed to the stop distance, not to how sure the setup feels, so confidence never quietly doubles your risk.
- Only risk money you can afford to lose. The euro is liquid, not tame.
What actually works
Keep three things and you have most of the edge:
- Trade with the daily trend, set by the EMA 50 and 200. Direction first, always.
- Confirm with momentum, MACD agreeing before you act, RSI timing the entry near a real level.
- Respect the map, the round-number levels, the session clock, and the DXY mirror. Wait for agreement, skip the rest.
Glossary
- EUR/USD: the euro priced in US dollars, the most-traded currency pair.
- EMA: exponential moving average, a trend line that weights recent price more heavily. The EMA 20 is a faster version used on the lower timeframes.
- D1 / H4 / H1: chart timeframes, the daily, 4-hour and 1-hour charts. The higher ones set the trend, the lower ones time the entry.
- Pip: the smallest standard move in EUR/USD, the fourth decimal place, so 1.1000 to 1.1001 is one pip.
- Golden / death cross: the faster moving average crossing above (golden) or below (death) the slower one.
- MACD: a momentum indicator built from two moving averages, read against a zero line and a signal line.
- RSI: relative strength index, a 0 to 100 momentum gauge; above 70 overbought, below 30 oversold.
- Support / resistance: price levels where the pair has repeatedly stalled or bounced.
- DXY: the US dollar index, which moves as a near-mirror of EUR/USD.
- Regime: the current market state, trending or ranging, which decides how a tool behaves.
FAQ
What is EUR/USD technical analysis, in plain terms?
It is reading the euro-dollar chart to decide direction, momentum and timing without relying on news. You use moving averages for the trend, MACD for momentum, RSI for entry timing, and the round-number levels the pair has respected for years.
Does technical analysis actually work on EUR/USD?
It works about as well here as anywhere in currencies, because the pair is deeply liquid with tight spreads and few gaps. That keeps levels and patterns clean. It stacks the odds, it does not promise any single trade.
What are the best indicators for EUR/USD?
Three cover most of the work: moving averages (EMA 50 and 200) for trend, MACD for momentum, and RSI for timing. More indicators rarely help. Agreement between these three matters more than adding a fourth.
Which timeframe is best for EUR/USD technical analysis?
Read top down. The daily chart sets the trend, the 4-hour shows structure, and the 1-hour times the entry. Anything faster than the 1-hour is mostly noise unless you are scalping the London or New York session.
What are the key EUR/USD support and resistance levels?
The round numbers keep mattering: 1.2500, 1.2000, 1.1000, 1.0500 and parity at 1.0000. Price reacts at these because everyone can see them, so orders stack there. Mark the nearest one above and below before you trade.
How do I analyze EUR/USD step by step?
Check the daily trend against the EMA 50 and 200, mark the nearest levels, drop to the 4-hour for structure, then time the entry on the 1-hour with RSI or MACD. Set a stop beyond the last swing, and confirm the move against the dollar index.
Can I use a EUR/USD forecast instead of the chart?
Use it for context, not for signals. A forecast tells you what the crowd expects, but price shows what is actually happening. When a headline and the chart disagree, the chart is what you can trade and manage risk on.
Why does the dollar index matter for EUR/USD?
EUR/USD is the biggest component of the dollar index, so the two move as near-mirror images. If your euro trade is real, DXY should be moving the opposite way. When they disagree, treat the signal as weak and wait.
Do these same reads work on other markets?
Yes, that is the point. The MACD read shown on gold in this guide is the same one you use on the euro, and the moving-average cross reads clean on other majors too. Learn each read once and you can point it at any liquid market.
How much money do I need to start analysing EUR/USD?
None to analyse it, the charts and indicators are free on TradingView and MT4 or MT5. To trade it, most brokers let you size positions small enough for a modest account. Risk only a small, fixed slice per trade whatever the balance.
🌍 Our recommended brokers


Reader Reviews
Be the first to review this — tell other traders what actually helped, or where it fell short.
Leave a Review

Forex Analyst & Senior Trader
Former FX desk trader with 8 years in institutional forex. Works in multi-timeframe analysis and order flow, turning desk experience into systematic, testable rules across forex and metals.