RSI divergence: the setup you came here for
Here is the exact thing you searched for: RSI divergence by the book, both forms. Bullish (price lower low, RSI higher low) points to a turn up. Bearish (price higher high, RSI lower high) points to a turn down.
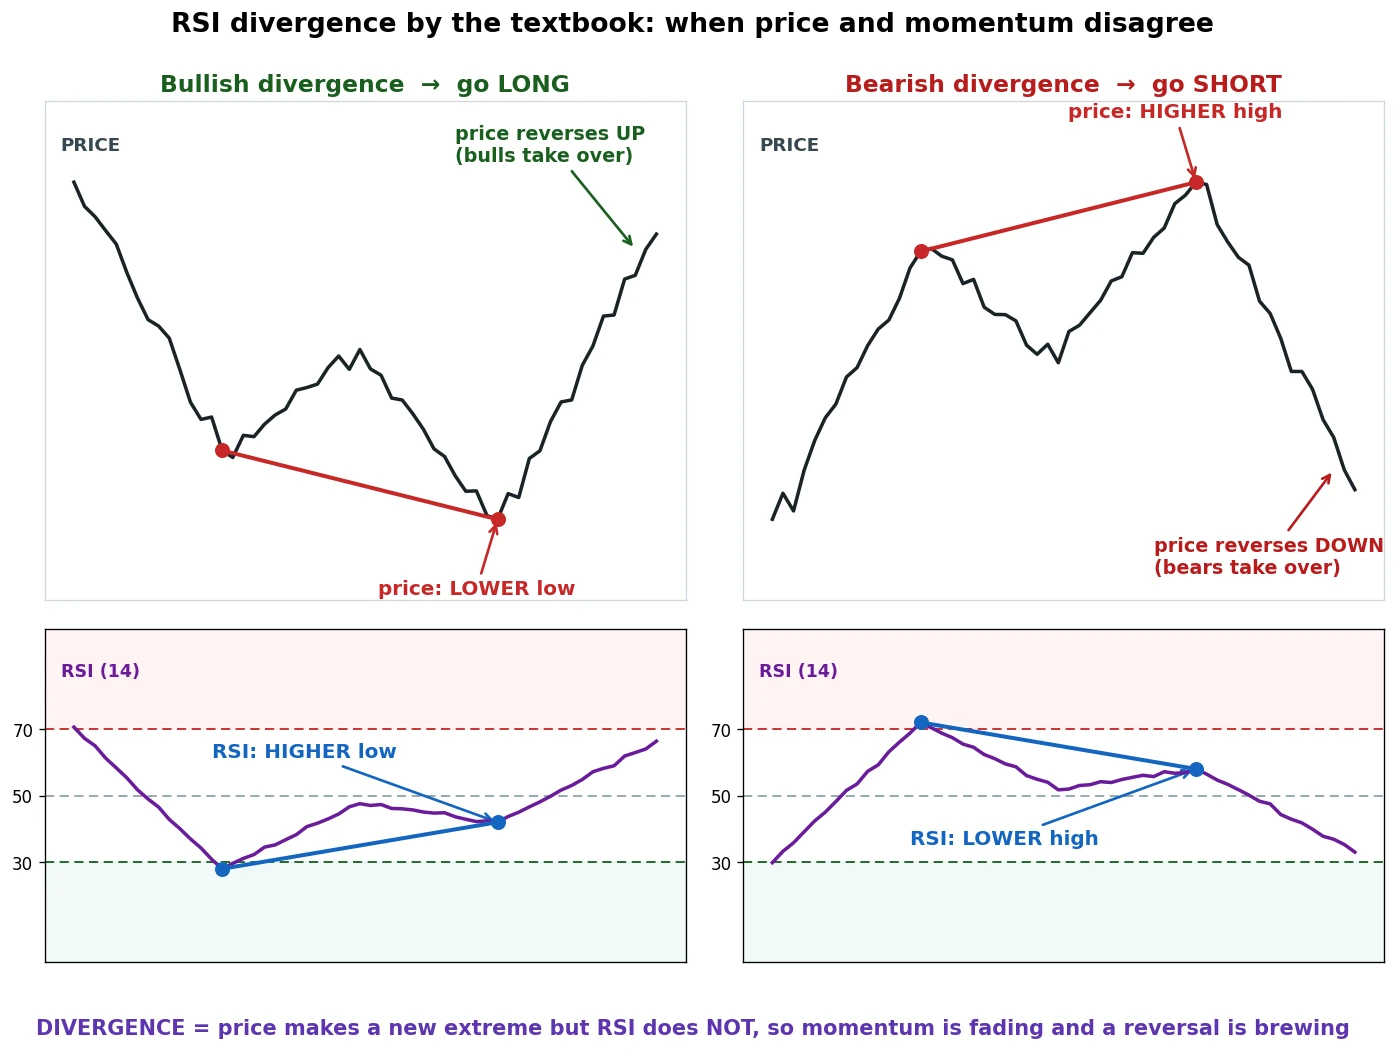
Real RSI divergence means price and the indicator move in opposite directions at two swing points.
Bullish divergence: price makes a lower low, but RSI makes a higher low. Price is still falling, momentum is quietly building underneath. The theory says a bottom is near.
Bearish divergence: price makes a higher high, RSI makes a lower high. Price pushes up, momentum is fading. The theory says a top is near.
The key word is opposite. “RSI went up” is not divergence. You need two clear swing points on both the price and the line, moving against each other, with a visible gap between the RSI readings. Anything looser is just noise dressed up as a signal.
If you trade, you have seen this picture a hundred times. It is the setup every guide sells, because it has one irresistible quality: a high win rate. Price makes a lower low, the RSI line makes a higher low, momentum is “secretly” turning, and you catch the reversal before everyone else. A beautiful idea, and the win rate is real.
So we built a detector that only fires on the real thing, a genuine lower low in price against a higher low in RSI with a clear gap, and let it trade mechanically across eight years on three markets. What came back is the rest of this guide, and it is not what the picture promises.
(One quick note for anyone new: RSI is a momentum gauge from 0 to 100, default setting 14, with 70 marked overbought and 30 oversold. We used the standard 14 throughout and did not tune it. The RSI indicator guide has the full mechanics if you want them.)
The divergence numbers: a trap in plain sight
We ran the bullish divergence entry on the 4-hour chart, net of real spread and fees, over eight years on three markets. Direction was set by the 200-period EMA, so the strategy only bought divergence in line with the bigger trend.
| Market | Win rate | Reward-to-risk | Profit factor |
|---|---|---|---|
| Gold (XAU/USD) | 63% | 1:0.6 | 1.07 |
| Bitcoin (BTC) | 52% | 1:0.9 | 0.98 |
| EUR/USD | 50% | 1:0.6 | 0.54 |
Read the win rate column first, because it is the bait. On gold the divergence entry won 63% of its trades. That is a number most strategies would kill for, and it is exactly what the guides quote at you.
Now read the rest of the row. Profit factor is the whole strategy’s report card: every dollar it won divided by every dollar it lost. Above 1.0 it makes money. On gold it scored 1.07, which means after all that winning it cleared about seven cents on the dollar. On Bitcoin it came in just under break-even. On the euro it lost money outright.
The reason is the reward-to-risk column, written 1:X. The 1 is what the trade risked from entry to stop. The X is what it actually made. At 1:0.6, each gold winner brought back about sixty cents for every dollar it risked. The risk-reward ratio guide walks through reading that number.
Tiny wins, frequent wins. You are right most of the time and you make almost nothing, because the few losses are bigger than the many wins. That is the divergence trap, and a high win rate is what hides it.
Divergence on a chart: the signal that looked perfect
Numbers are easy to wave away, so here is the trap as a real trade on spot gold (XAU/USD).
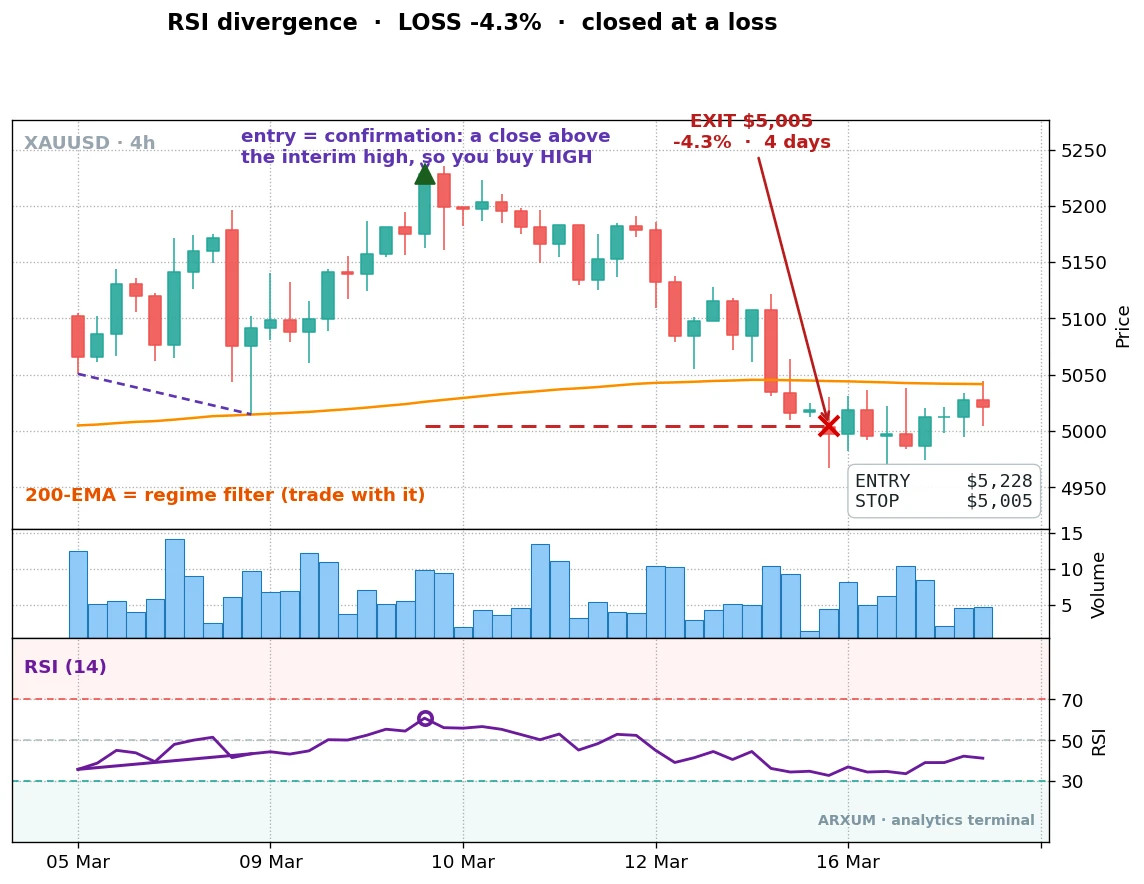
This is the dream setup. Price slid to a lower low. The RSI line, marked on the lower panel, made a higher low at the same time. The two dashed lines show the disagreement: price down, momentum up. By the book, a bottom was forming and the entry was clean.
Notice where the entry sits, though. You do not buy at the low. You wait for confirmation, a close back above the interim high, before pulling the trigger, which means the entry is well above the lows the signal formed at. You are buying high on a bet that the bottom is in. That is part of why the trap bites.
Then it just kept going. The “reversal” never came, price drifted lower, and the trade closed for a 4.3% loss.
Nothing was wrong with the read. The divergence was genuine, the gap was clear, the rules were followed. It still lost, because a divergence is a guess about a reversal that has not happened yet. Sometimes momentum is building. Sometimes it is just a pause before the next leg down.
The takeaway in one line: divergence tells you momentum is disagreeing with price, not that price is about to turn. The market does not owe you the reversal.
The setup that actually pays: the trend-pullback
Here is the RSI trade worth learning. It is the mirror image of divergence, and almost nobody teaches it.
There are really three ways people read RSI, and it helps to see them on one chart before we go on. Two of them bet against momentum. One bets with it.
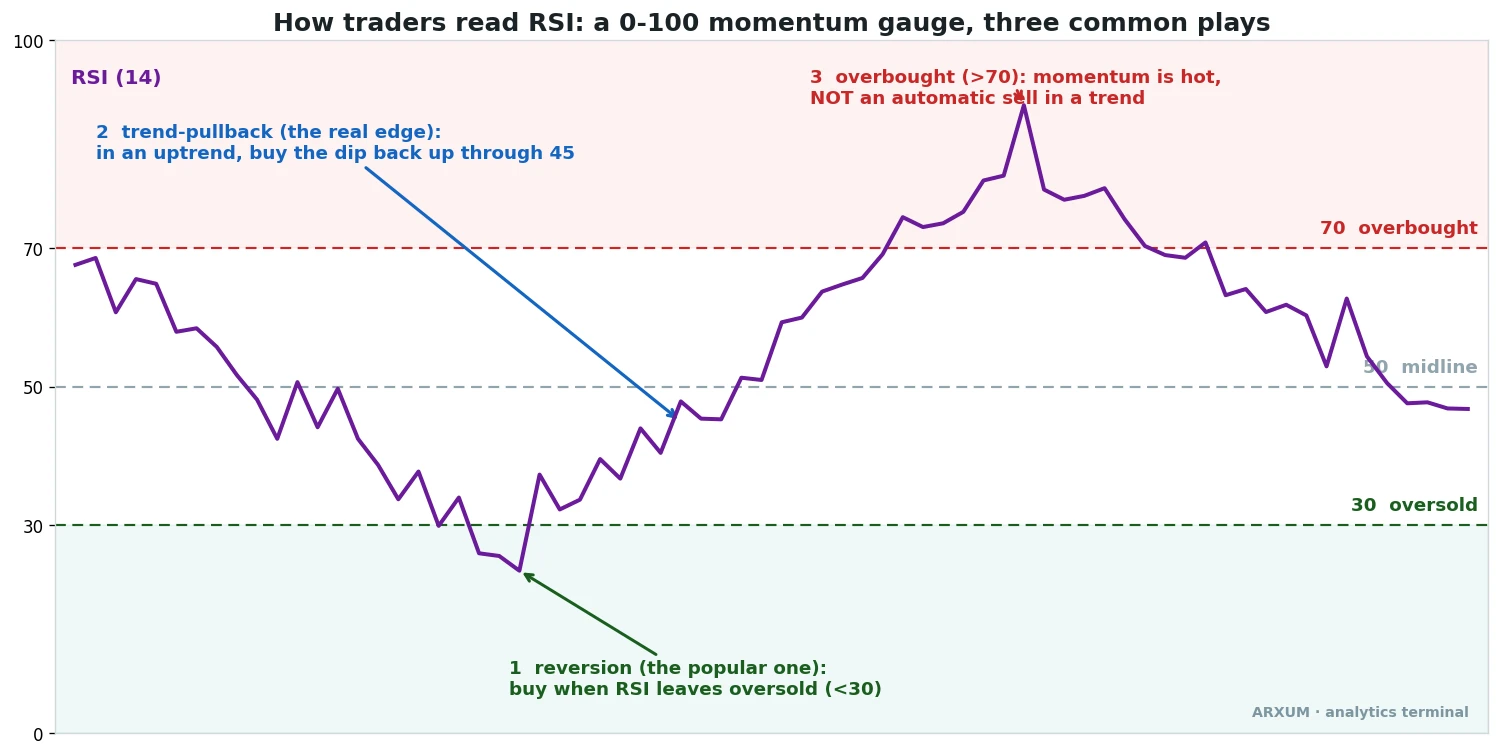
Instead of fighting the trend looking for a reversal, you trade with it. In an uptrend, RSI dips as price pulls back, then turns up. You buy that turn.
The rule is simple:
- Direction: price must be above its 200-period EMA, so the trend is up. The EMA guide covers that line.
- Trigger: RSI dips under 45, then crosses back up through 45. Momentum paused, then resumed.
- Exit: RSI falls back under 40, meaning momentum has rolled over.
That is it. No divergence, no calling tops. You wait for the trend to take a breath, then climb aboard as it gets going again. Here is the eight-year record on the lead market.
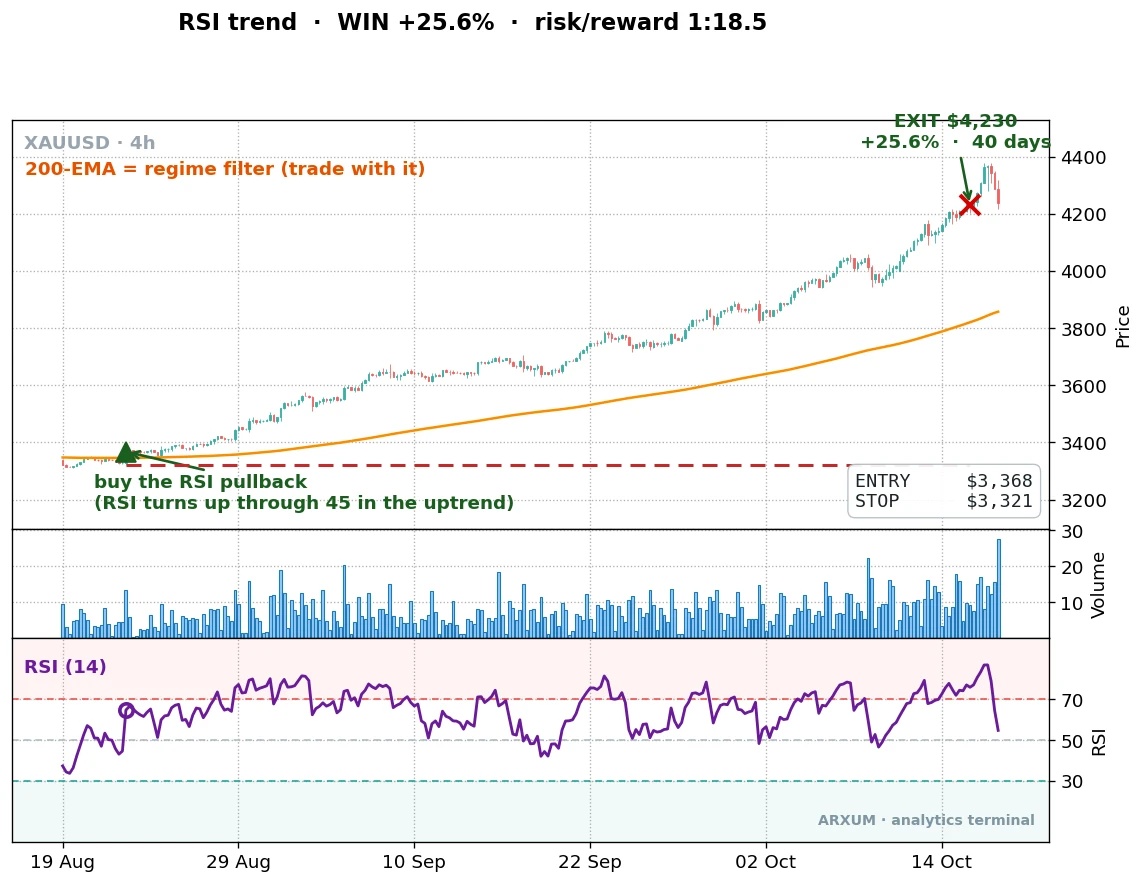
Read the trade left to right. Gold was above its 200-period EMA, so the trend was up and only longs were allowed. RSI dipped, then crossed back up through 45 on the lower panel. That is the trigger. The trade went live and rode the trend for weeks, exiting when momentum finally rolled over near the top.
That single trade made 25.6% at a reward-to-risk of 1:18.5. The winner was nearly nineteen times the size of the risk taken.
That is the whole difference from divergence. Divergence won often and made pennies. The trend-pullback wins rarely and makes multiples. Now the catch, shown honestly.
The honest loser
The trend-pullback wins less than a third of the time. Pretending otherwise would be useless to you, so here is one that failed.
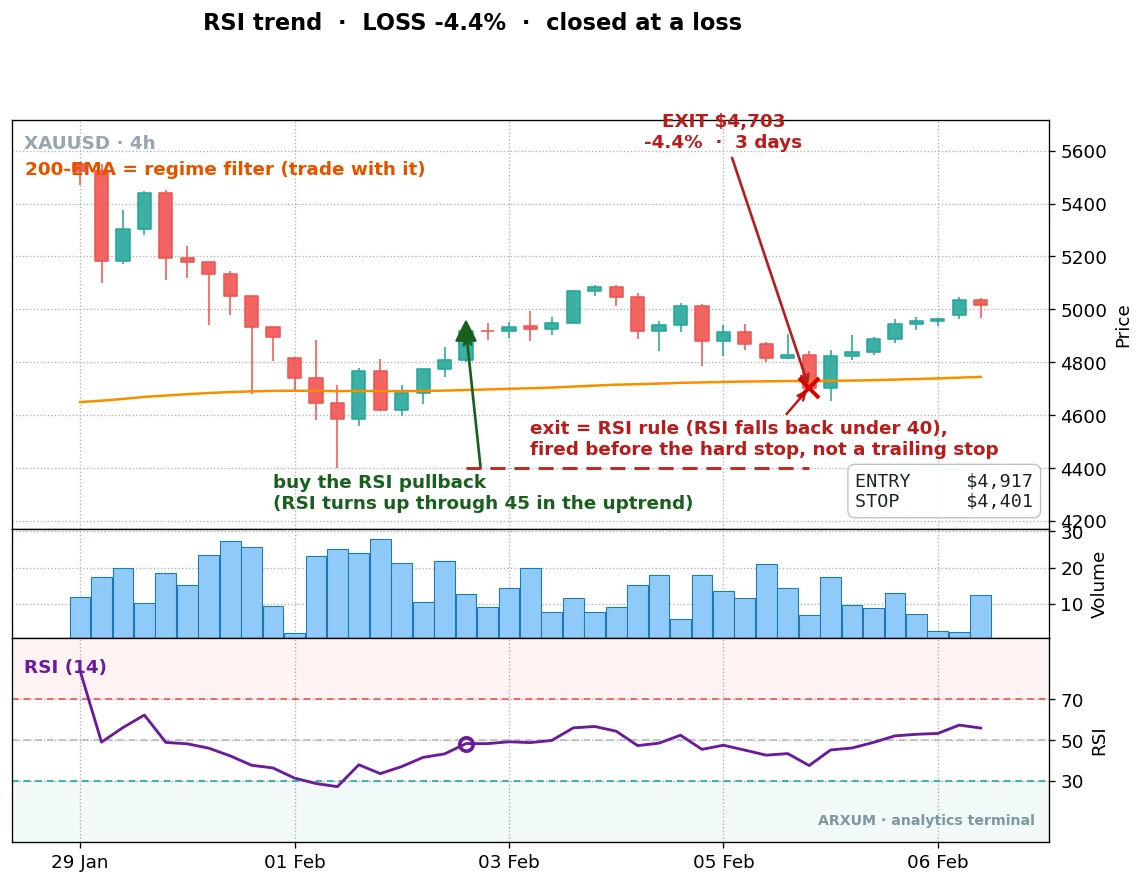
The setup was valid. Price was above the EMA, RSI turned up through 45, the trade triggered by the rules. Then the move stalled, momentum rolled back over, and the exit fired for a 4.4% loss.
One detail on that exit, since the chart can mislead. The trade closed on the RSI rule, RSI falling back under 40, which happened above the hard stop. That is not a trailing stop creeping up. The hard stop is your worst case if price gaps against you. The RSI exit is the normal way out, and here it cut the loss to 4.4% rather than letting it run to the full stop.
No mechanical signal avoids this. What it does is keep the loss small, under 5%, while the winners run to 25%. That gap is the entire engine of the strategy.
The rule of thumb here: this is a low-accuracy, high-reward setup. You will be wrong most of the time and still make money, because one big winner pays for a long string of small losers. A trader who needs to be right will hate it.
The proof over time, not two trades
Two charts are an anecdote. Here is what the gold trend-pullback did across the full eight years, compounding a $1,000 account at 2% risk per trade.
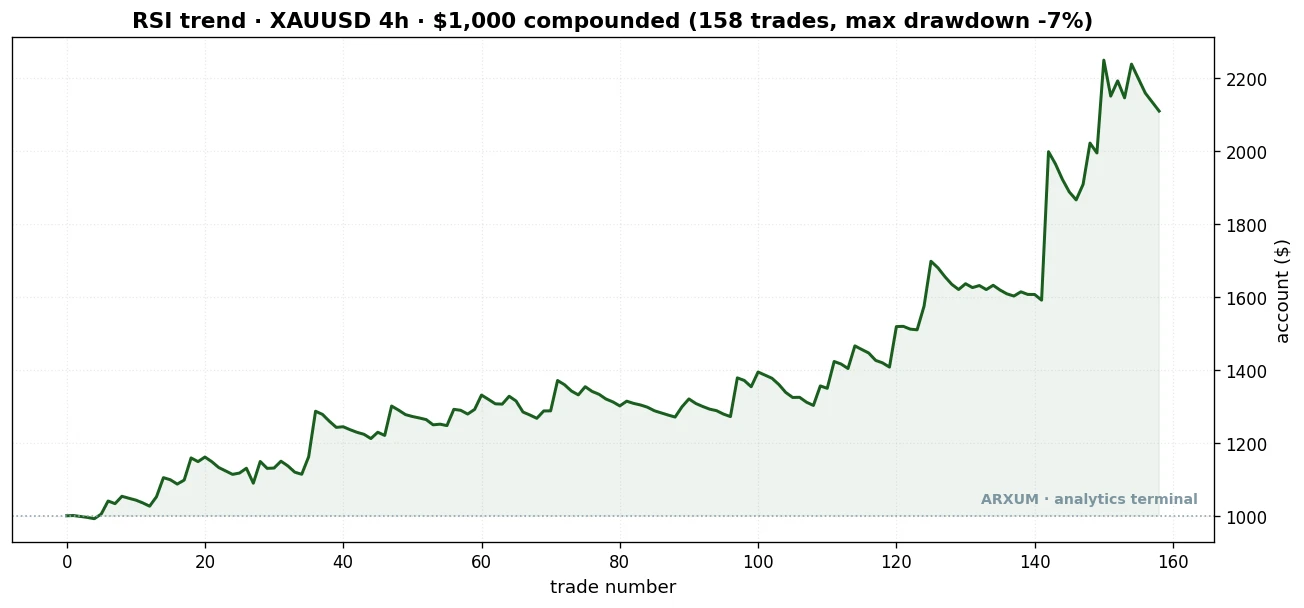
| Trades | 158 |
| Win rate | 32% |
| Reward-to-risk | 1:3.9 |
| Profit factor | 1.85 |
| Expectancy | +0.52% / trade |
| Out-of-sample profit factor | 1.92 |
| Max drawdown | 7% |
| Net return on $1,000 | +111% |
That curve grinds rather than gallops, which is exactly right for a 32% win rate. Long flat stretches, then a few big winners carry it.
Expectancy is the plain version of the edge: each trade, win or lose, was worth about +0.52% on average over the whole set. Small and positive, compounded over 158 trades, is what built the curve.
Compare that to divergence on the same market, same window. Divergence had a 1.07 profit factor. The trend-pullback had 1.85. One barely cleared its costs. The other nearly doubled the account.
Does the edge survive on data it never saw?
A strong profit factor over eight years could just be a pattern fitted to the past. The test that matters is out-of-sample: build the read on the early years, then run it on later years it has never touched. A real edge survives. A fitted one falls apart.
We split the data and ran both strategies on the unseen half.
| Market | Divergence: in then out | Trend-pullback: in then out |
|---|---|---|
| Gold (XAU/USD) | 2.03 then 0.58 | 1.73 then 1.92 |
| Bitcoin (BTC) | 0.87 then 1.09 | 1.85 then 1.61 |
| EUR/USD | 0.59 then 0.49 | 0.89 then 1.31 |
This is the part that settles it. Look at the gold divergence cell: a 2.03 profit factor on the years it was built on, then 0.58 on the years it had never seen. It went from making money to losing money the moment the data was fresh. That is the signature of a fitted result, and it is why the high win rate is dangerous.
Now the trend-pullback column. Gold held and actually got stronger, 1.73 to 1.92. The euro went from below break-even to a clean 1.31. Bitcoin stayed well above 1.0. The edge survived data nobody tuned it to, on all three markets.
An edge that holds up on years it never met is one you can lean on. An edge that collapses on them is a story. The two columns above are the difference, in one table.
Where the alpha really shows: a flat market
The gold and Bitcoin numbers are impressive, but there is a fair objection. Those markets trended hard for eight years, so maybe the trend-pullback is just riding the wave.
The honest test is whether it makes money where holding makes nothing. Look at EUR/USD. Over the eight years, simply holding the euro returned roughly nothing, it drifted sideways. The trend-pullback still worked on it.
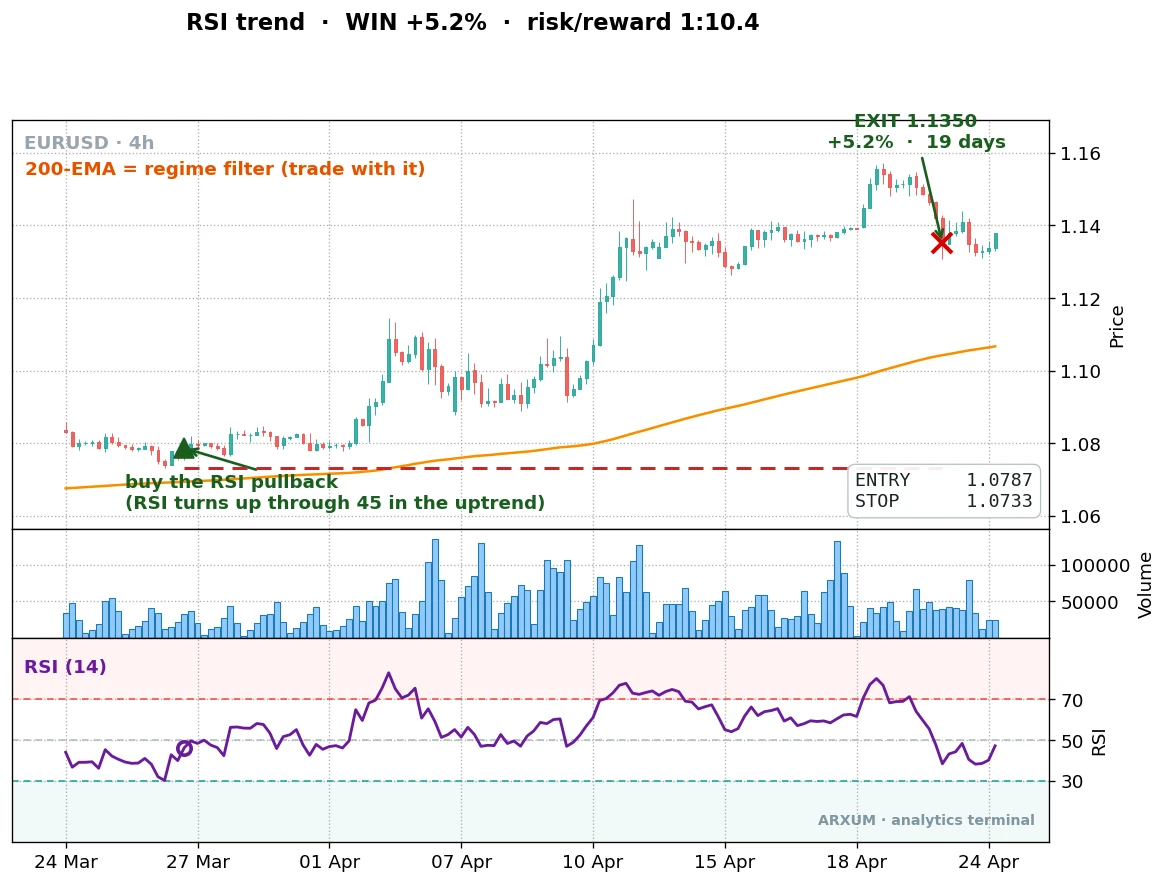
This is one of those trades, a long that ran more than 560 pips, the small increments a currency moves in, while the pair as a whole went nowhere for years. Across the full set the euro trend-pullback held up out-of-sample at 1.31, in a market where buy-and-hold paid nothing.
One caveat for forex specifically. Most charting platforms show tick volume, a count of price updates, not the true traded volume you get on a stock or a crypto exchange. So any volume-based read is softer on a currency pair, which is one more reason the calm-volatility filter, measured off price ranges, travels better than a volume one.
That is real alpha, not borrowed trend. Beta is the return you get just for holding a rising market. Alpha is what the strategy adds on top. You only see alpha cleanly on a flat market, because there is no underlying trend to flatter the result.
For contrast, here is the same setup on Bitcoin, where the trend was enormous.
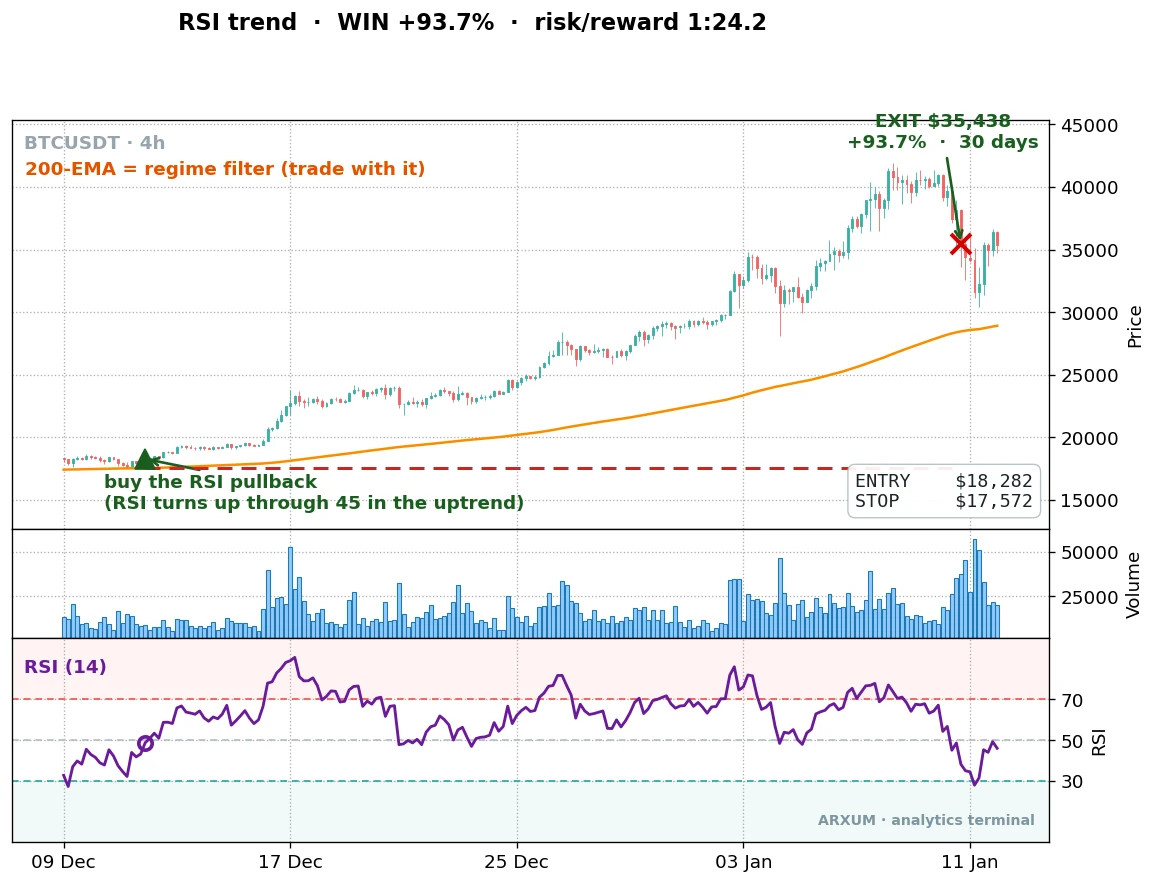
A 93.7% gain on one trade looks spectacular, and it was a real run in late 2020. Bitcoin’s full-set profit factor was 1.75, with the winners stretched out by the size of the moves. The shape is the same as gold, just louder: rare wins, huge when they land.
The third RSI method, and why it is weak
There is one more popular way to trade RSI: the classic reversion play. Buy when RSI leaves oversold by crossing back up through 30, sell when it leaves overbought through 70. It is the first thing most people are taught.
We tested it too. It is the weakest of the three.
| Market | Profit factor | Out-of-sample |
|---|---|---|
| Gold (XAU/USD) | 1.16 | marginal (1.10) |
| Bitcoin (BTC) | 0.91 | loses |
| EUR/USD | 0.75 | loses both halves |
Gold scraped a small edge. Bitcoin and the euro lost money. The reason is the same trap that catches new traders live: in a trend, RSI can sit oversold for a long time while price keeps falling, or stay overbought while price keeps climbing. Buying every dip below 30 means catching a lot of falling knives.
The lesson across all three: RSI is a momentum tool, and momentum tools work best traded with the move, not against it. Reversion and divergence both bet against momentum. The trend-pullback bets with it. That is why it is the one that pays.
Here are the three methods side by side, scored by profit factor across all three markets.
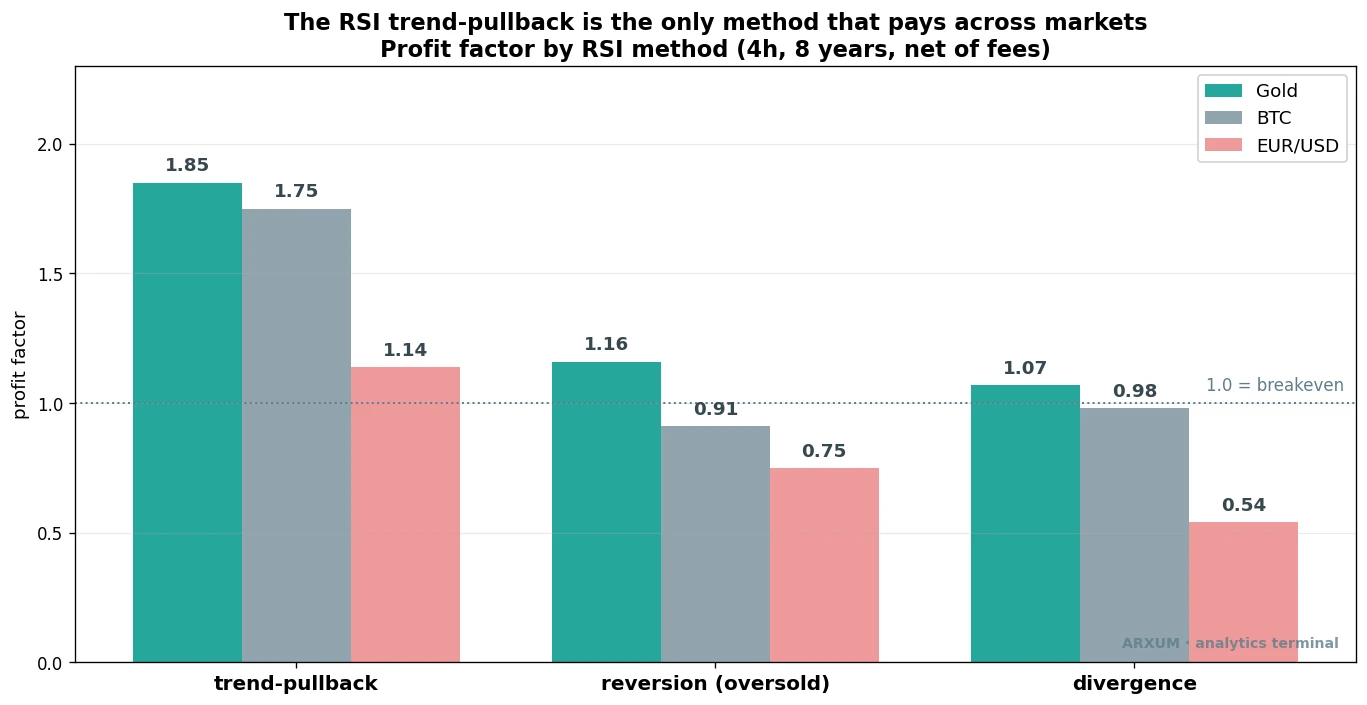
One picture, the whole finding. The trend-pullback bars are the only ones above the line on every market. Reversion and divergence sink below it on the markets that matter most.
The confirmation that travels: a calm market
Once you have the trend-pullback, the natural next question is whether a filter can lift it further. We tagged every trade with a wide menu of confirmations, volume, trend strength, momentum, and a calm-or-wild volatility read, then checked which one actually helped.
It was not volume. On the gold trend-pullback, the filter that lifted the edge most was a calm market.
In plain terms, the setup works better when the pullback happens during a quiet, low-volatility stretch rather than a wild, whippy one. Demanding that calm read lifted the gold profit factor from 1.85 to 4.39, more than doubling it.
You can read this off the chart without a new tool, the candle ranges tighten before the entry. We measured it with average true range, the standard gauge of how much a market is moving. The average true range guide explains it.
The point worth keeping: this is the same lesson our Bollinger Bands and Darvas box research landed on, but flipped. There, a volume surge was the edge. Here, on a momentum pullback, calm volatility is. You discover the confirmation per setup, you do not assume the last one carries over.
Profit factor is not reward-to-risk
Two numbers in this guide look alike and measure different things, so let me separate them cleanly, because a beginner blurs them constantly.
Reward-to-risk is one trade. Written 1:X, the 1 is what you risked from entry to stop, the X is what that one trade made. The gold winner ran 1:18.5. That is a single trade’s shape.
Profit factor is the whole strategy. Total dollars won across every trade, divided by total dollars lost. The 1.85 on gold is the entire eight-year record, winners and losers netted together.
They answer different questions. Reward-to-risk tells you how one trade is built. Profit factor tells you whether the strategy makes money over hundreds of trades. The trend-pullback has a strong profit factor partly because its reward-to-risk is high: rare wins, but each one is large against the small capped losses.
Which way to trade it, and when
Everything above is the long side, because the eight-year window was a powerful bull run in gold and Bitcoin, and longs carried it. The trend-pullback is not a permanent long bias, though.
Direction comes from the 200-period EMA. Long while price is above it, short while below. The short side is just the mirror: in a downtrend, RSI rallies to the midline then turns down, and you sell that turn.
The honest caveat: across this bull-market window, most shorts bled, because shorting a market that keeps rising is a losing game. On a market that genuinely cycles, the short side pays on its own. On a one-way bull like gold over these years, it needs a real down-regime to be worth taking.
The regime rule, in one line: let the 200-period EMA pick the side, trade long above it and short below, and respect that a runaway trend makes one side much harder than the other.
How to size and place the trade
Numbers stay abstract until you put your own account behind them, so here is the gold trend-pullback worked all the way through, on a small account.
Say you have $1,000 and you risk 2% per trade. That is $20 at stake.
Take the gold winner. Entry was around $3,368, with the stop below the recent swing low. Suppose that stop sat $47 below entry, a typical distance for a 4-hour gold swing at that price.
- Risk budget at 2% of $1,000: $20.
- Risk per ounce, entry to stop: $47.
- Position size: $20 ÷ $47 = 0.43 ounces.
Gold is quoted per ounce but sized in lots. One standard lot is 100 ounces, a mini lot is 10, a micro lot is 1. Your honest size here, 0.43 ounces, is below even a single micro lot.
That is the math telling you the truth, not a flaw. On a $1,000 account at honest 2% risk, this trade is smaller than the smallest standard lot. There are two clean options, and neither is “just risk more”:
- Use a broker that offers fractional or cent-lot sizing, so you can hold 0.43 ounces directly.
- Or trade a lower-priced market like the euro, where the dollar stop per unit is far smaller.
Either way the risk stays $20. The size bends to the risk, never the reverse.
Once the size is set, placing it is a few fields on the order ticket:
- Buy at the market on the close that crosses RSI back up through 45, or a buy-stop just above it.
- Stop-loss field at the swing low below your entry.
- Take-profit is loose here, since the strategy exits on momentum rolling over, not a fixed target. Set a wide target at your reward-to-risk and plan to exit manually when RSI falls back under 40.
The free tier of TradingView is enough to add RSI, the 200 EMA, and read the volatility off the candles. Set the stop when you place the order, and never widen it to fit a bigger position.
Risk and the discipline that powers it
This strategy wins less than a third of the time, and that fact is the discipline. The edge lives in the size of the winners, not their frequency, so you have to be comfortable being wrong often.
A few rules keep you on the right side of it, tied to this strategy’s own numbers:
- Expect long losing runs. At a 32% win rate, five or six losses in a row is ordinary, not a sign the method broke. The big winners in this guide each followed a string of small losses you did not see.
- The drawdown is the price of admission. On gold the deepest dip was about 7%. Size so a normal drawdown is survivable and boring, not frightening.
- Watch the regime, that is what powers the edge. Direction comes from the 200-period EMA. If you string together more losses than usual, check whether price is still cleanly above that line or chopping across it. A pullback strategy in a flat, EMA-straddling market is the worst case.
- Only risk capital you can afford to lose, and keep each trade small enough that a run of losses stays dull.
And keep a calm eye on whether live results track the test. One quiet stretch is just variance, do not panic-quit on a bad week. But if the setup runs materially worse than its trade history over a real run of trades, the trend may have flattened into chop, the exact condition that dulls this edge. Don’t ignore a sustained gap, step back and read the regime.
The honest gaps
Three things to be straight about, so you size your confidence correctly.
- The settings are the defaults, not curve-fit. We used RSI 14, the standard every platform ships, on the 2018 to 2026 window we tested. We did not tune the period, which is good, but the entry thresholds were chosen on that window, so some in-sample comfort remains.
- No walk-forward yet. We split the data in half for the out-of-sample check, and the trend-pullback held. We have not run a rolling walk-forward, the stricter test that re-fits on each new slice. The split survival is encouraging, not the final word.
- The 4-hour chart is where this lives. Drop to the 1-hour and RSI fires far more often and far noisier. The numbers in this guide are all 4-hour.
None of this sinks the result. The trend-pullback survived data it never saw, on three markets. But honest scope is part of the edge, so there it is.
What works, on a matchbox
- Be careful with the RSI divergence strategy. It wins often, between 50% and 63%, but each win is tiny, it barely breaks even on gold and loses on the euro, and the gold edge collapses out-of-sample. High win rate, no real edge.
- Trade the trend-pullback instead. Buy the RSI dip back up through 45 in an uptrend. It wins less than a third of the time and still pays, because the winners are several times the small losses.
- Let the 200-period EMA pick the side. Long above it, short below. The trend filter aims the setup.
- Confirm with a calm market, not volume. Below-median volatility lifted the gold trend-pullback from 1.85 to 4.39. The filter is discovered per setup, not borrowed from the last one.
- Expect it to work where holding does not. On flat EUR/USD, where buy-and-hold made nothing, the trend-pullback still posted a positive return that held up out-of-sample.
Where to go from here
If you want to use this yourself, the natural next steps are the tools and markets the method leans on.
- RSI indicator guide covers the mechanics of the indicator from the ground up.
- RSI trading strategy goes deeper on building entries around the line.
- Exponential moving average is the 200-period line that sets your direction.
- Average true range is the gauge behind the calm-volatility confirmation that did the heavy lifting.
- MACD indicator is the other momentum tool we tested, where calm volatility also turned out to be the confirmation that travels.
FAQ
What is RSI divergence, in plain terms?
Does the RSI divergence strategy actually work?
Why is a high win rate a problem?
What is the RSI trend-pullback strategy?
Which RSI strategy is the best?
What RSI settings should I use?
What timeframe is best for RSI?
Does RSI work on forex and gold, or just crypto?
What is the best confirmation to add to RSI?
What is profit factor, and how is it different from reward-to-risk?
How much money do I need to start?
How do I place an RSI trend-pullback trade?
What do the key terms mean?
🌍 Our recommended brokers
Reader Reviews
Be the first to review this — tell other traders what actually helped, or where it fell short.
Leave a Review

Quant Researcher & Systems Builder
Quantitative researcher who builds the automated systems behind Arxum strategy testing. Works in Python and Pine Script, using AI alongside classic backtesting to validate strategies on years of real data.