The two RSI settings you actually control
Here is what you came to see. RSI, the relative strength index, is a momentum gauge that runs from 0 to 100.
You change two things on it, and only two: the period and the levels.
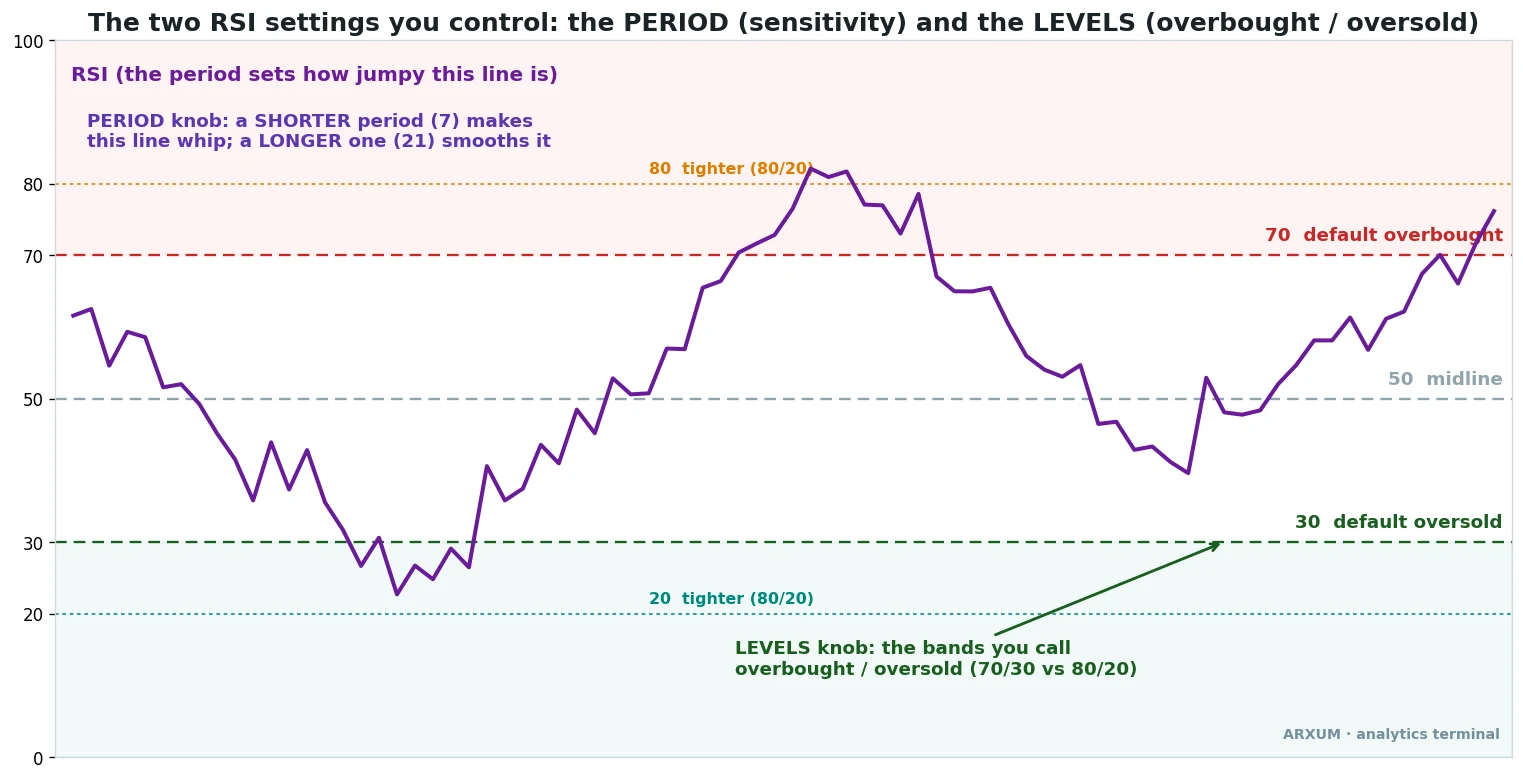
The period is the lookback. RSI(14) averages momentum over 14 bars.
Drop it to 7 and the line whips around, reacting to every small move; raise it to 21 and the line smooths out, reacting slower. That is the sensitivity dial.
The levels are the horizontal lines you call overbought and oversold. The textbook default is 70 and 30.
Some traders pull them in to 80/20 to demand a bigger stretch before they act, and a few go to 90/10. That is the threshold dial.
J. Welles Wilder published RSI in 1978 with 14 as the default.
He picked 14 because it was half of a 28-day cycle he was working with, not because he optimized it on decades of price history. The number stuck because everyone watches it, which is a real reason but not a mathematical one.
So the question is fair: if 14 was a guess, can you do better by changing it? We ran it on years of real data instead of guessing.
The short answer is that the period and the levels each do a specific job, and the job depends on which RSI play you are running.
What “more signals” actually costs you
The most common settings advice is to shorten the period for faster entries. It sounds right.
A faster line reaches the levels sooner, so you get in earlier.
The catch is that a faster line reaches the levels far more often, and most of those extra touches are noise.
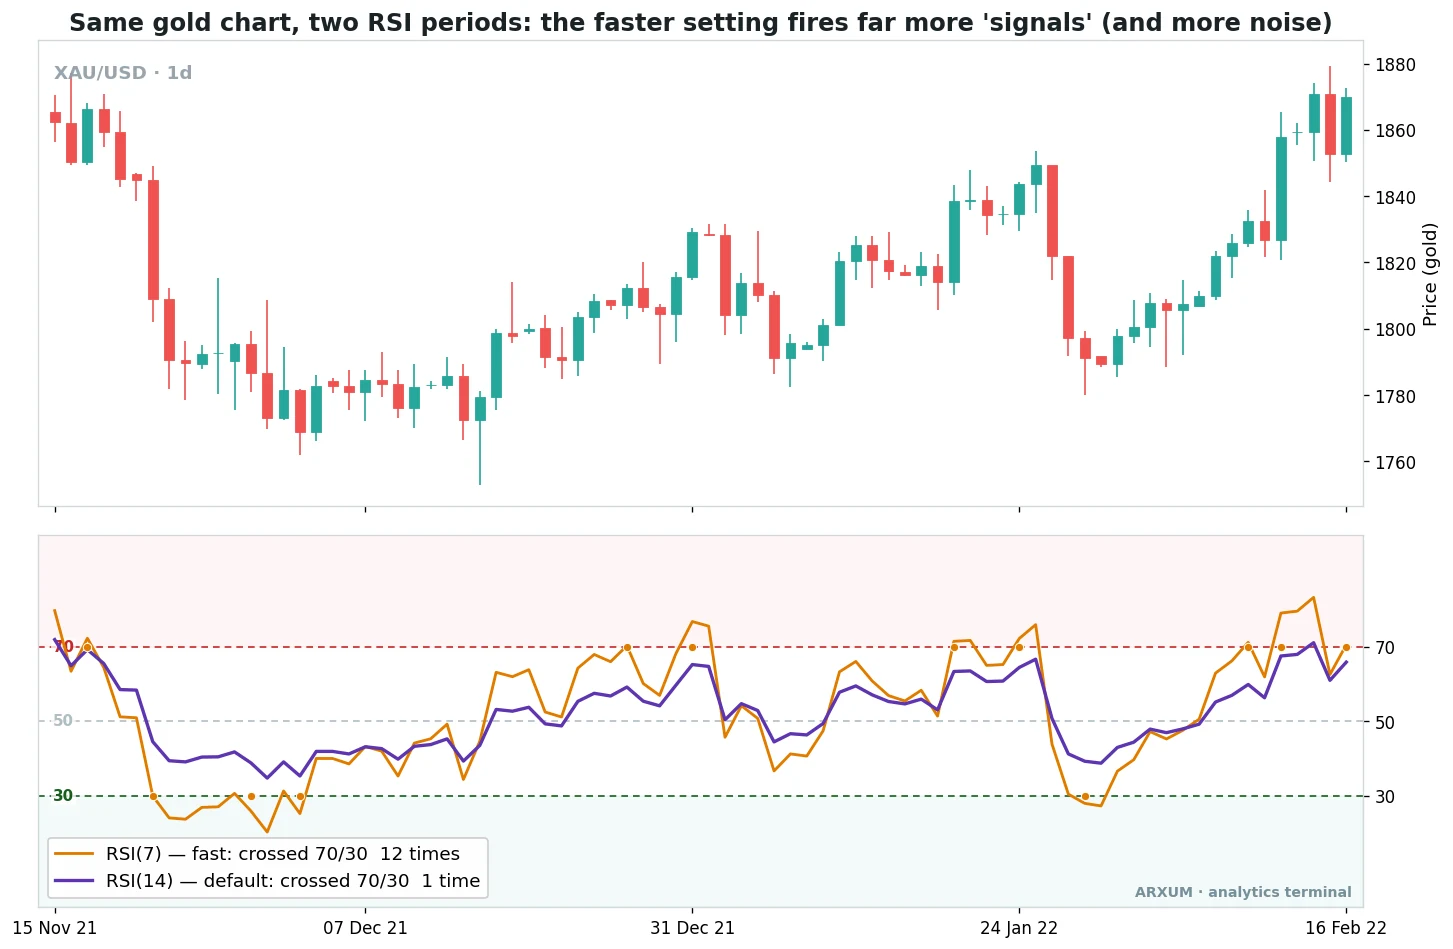
That is one real stretch of spot gold (XAU/USD) on the daily chart. The price action is identical for both lines.
The only difference is the setting.
RSI(7) tagged the overbought or oversold bands a dozen times. RSI(14) did it once.
If each band touch is a potential trade, the faster setting just handed you eleven extra “signals” in a market that only made one real turn.
The data agrees. On gold’s 1-hour chart, the classic oversold-bounce play with 70/30 levels lost money at every short period we ran: RSI(7) ran a 0.85 profit factor, RSI(9) was 0.90, RSI(14) was 0.86.
All below 1.0, all bleeding.
Quick definition, because it carries the whole guide. Profit factor is the strategy’s total dollars won divided by total dollars lost.
Above 1.0 you made money; 1.20 means roughly $1.20 came back for every dollar the losing trades cost. Below 1.0 you lost.
So on a fast chart, cranking the period down floods you with signals and the profit factor sinks below breakeven. “More signals” is not “more edge.” It is usually the opposite.
The play that pays, and the period that suits it
Before settings can mean anything, you need to know which RSI play you are setting them for. The two are completely different.
The first is reversion: buy when RSI leaves oversold, sell when it leaves overbought. This is the one that uses the 70/30 levels directly.
The second is the trend-pullback: in an uptrend, wait for RSI to dip and then turn back up through the 45 midline, and buy that. This one barely touches the extremes.
It is the play the gold data keeps crowning as the real edge, and it is covered in depth in the RSI trading strategy guide.
For the trend-pullback, the only setting that matters is the period, and here the data is clear and a little surprising.
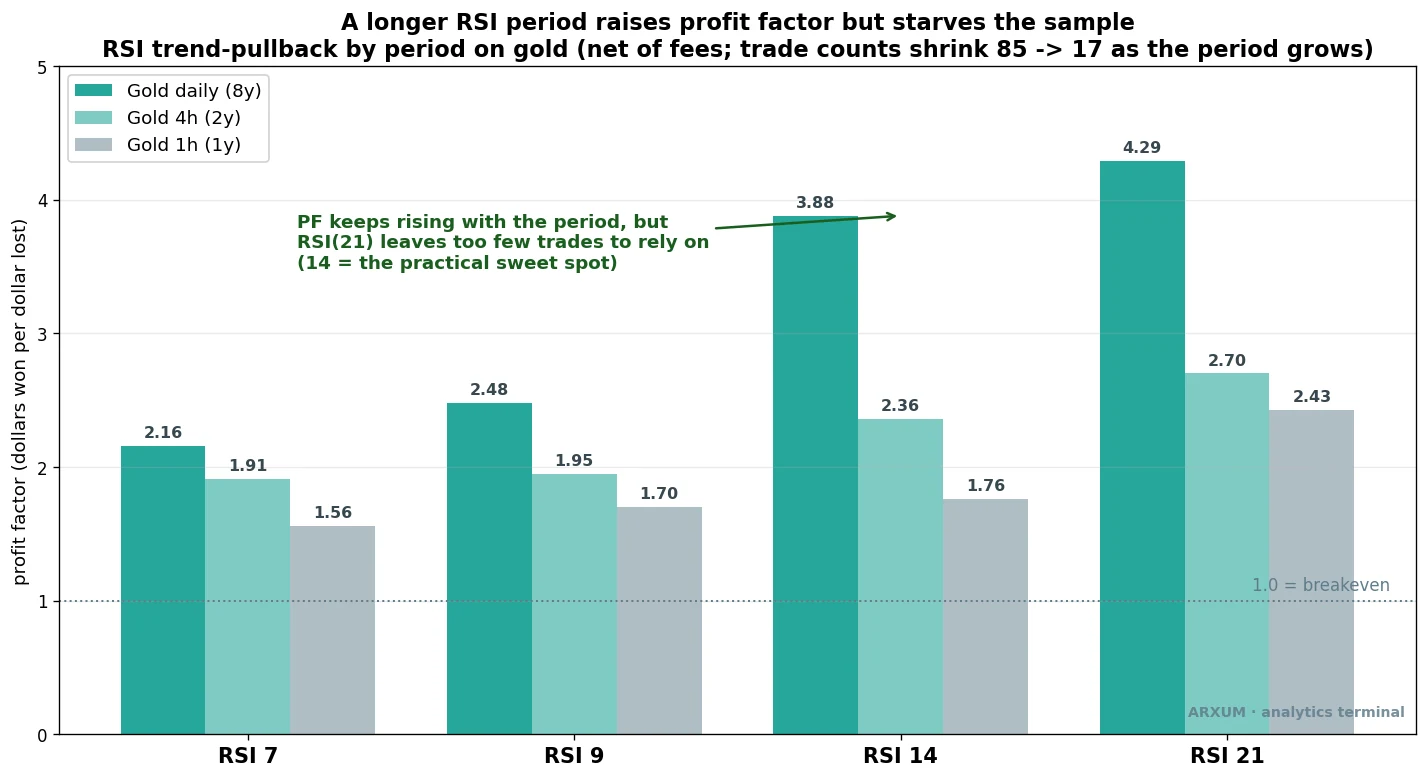
Read the bars left to right. On gold daily, the profit factor climbs steadily: RSI(7) at 2.16, RSI(9) at 2.48, RSI(14) at 3.88, RSI(21) at 4.29.
A longer period is genuinely cleaner.
So why not just use 21? Because the trade count collapses.
RSI(7) gave 85 trades over eight years; RSI(21) gave 17.
Seventeen trades across eight years is barely two a year. The profit factor looks great, but you cannot build a strategy on a sample that thin, and you would spend most of the decade waiting.
The takeaway: for the trend-pullback, RSI(14) is the practical sweet spot. It carries a strong profit factor (3.88 on gold daily) while still firing often enough, 32 trades, to be a real strategy you can actually trade.
The same shape holds on the 4-hour and 1-hour charts, where you lean toward a slightly faster period only to keep enough trades on the table.
The RSI(14) trend-pullback on gold
Here is one of those trades, start to finish.
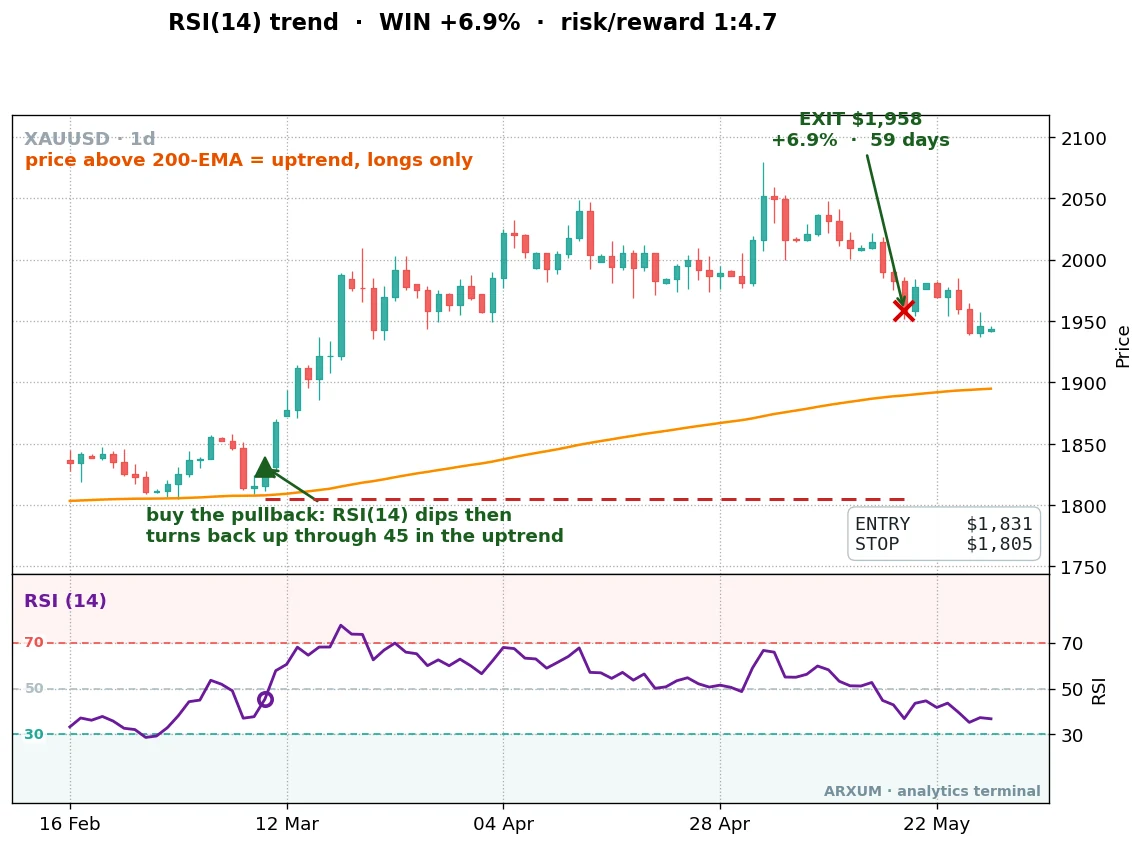
The rules are short:
- Regime first. Only buy when price is above its 200-period EMA, a long moving average (the average price over the last 200 bars) drawn as a smooth line that shows the overall trend without the day-to-day noise. Above a rising 200-EMA the market is in an uptrend, below a falling one a downtrend; that up-or-down state is what “the regime” means.
- The dip. Inside that uptrend, wait for RSI to fall under the 45 midline, not the textbook 30.
- The trigger. Buy when RSI turns back up through 45. Momentum has re-ignited with the trend.
- The stop. Below the recent swing low.
- The exit. When RSI falls back under 40, the move has given out.
Why 45 and not the textbook 30? In a strong uptrend RSI rarely falls all the way to oversold, because buyers step in before it gets there.
So you wait for a shallow dip toward the centre instead.
The 45 line sits just below the 50 midpoint, deep enough to mark a real pause but still on the bullish side of the gauge. It is the dip you can actually catch, and in the data it held up better than waiting for a 30 that mostly never arrives in a trend.
Notice the RSI panel at the bottom. The 70 and 30 levels are marked, but the entry does not happen anywhere near them.
This play reads the midline, not the extremes. That is why the levels setting barely matters here, and the period is the only dial worth touching.
Across eight years, here is the full trade history of that setup on gold, not two cherry-picked winners.
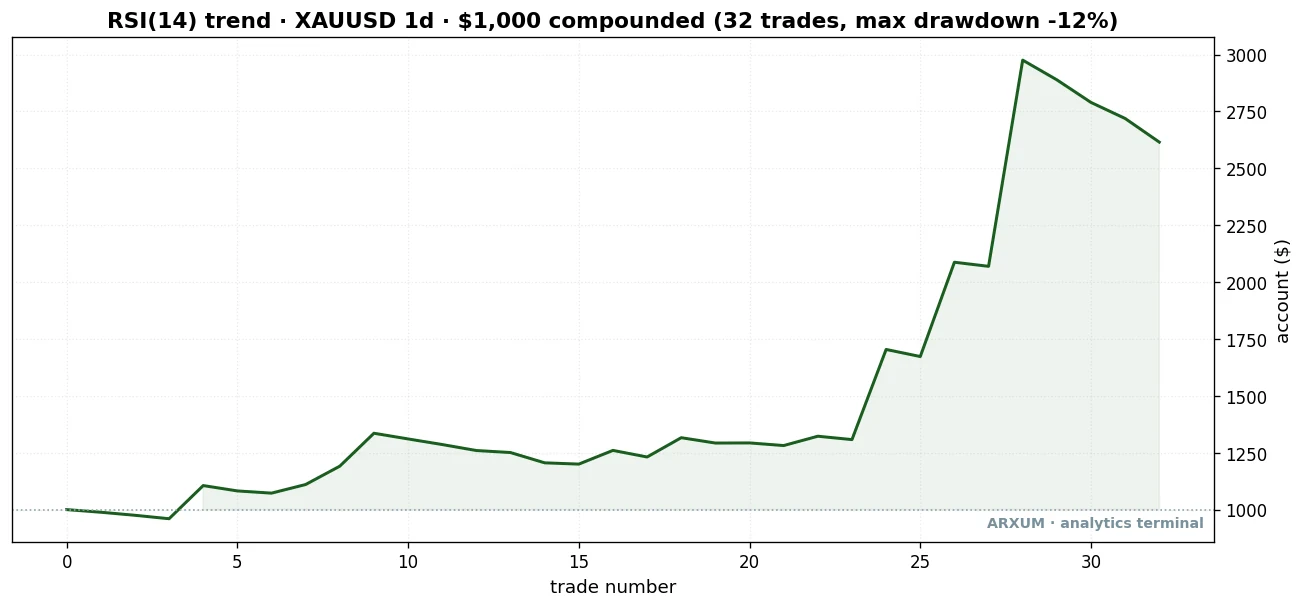
| Trades | 32 |
| Win rate | 34% |
| Reward-to-risk | 1:7.4 avg |
| Profit factor | 3.88 |
| Max drawdown | −12% |
| Net return on $1,000 | +161% |
Look at the win rate first: 34%. You lose roughly two trades out of three.
That sounds broken until you read the next row.
Reward-to-risk is written 1:X. The 1 is your risk, the distance from entry to stop.
The X is how many times that risk the average winner made back.
Here it is 1:7.4, so the average winner returned more than seven times what the average loser cost. A deep dive on that math lives in the risk-reward ratio guide.
That asymmetry is the whole engine. A low win rate with big winners still pays handsomely, because the few trades that work pay for all the small losses and then some.
The equity curve shows it honestly: long stretches of going nowhere, punctuated by a handful of trends that carry the year.
One more honesty check. We split the eight years in half, built nothing on the second half, and the edge held: in-sample profit factor 2.4, out-of-sample 5.1.
Out-of-sample just means the rules ran on the half of the data they were never built on, so the result is not bent to fit the past.
The second half scoring higher than the first is not a magic improvement. With a small trade count these halves swing around a lot, and a few big winners can land in either one.
The point is not that the second half was better, it is that both halves stayed clearly profitable.
An edge that survives data it was never fit to is one you can lean on.
The levels play, where the settings finally matter
Now switch to reversion, the play that actually uses the 70/30 lines. This is where the period and the levels both pull their weight, and where the default 14 is not the winner.
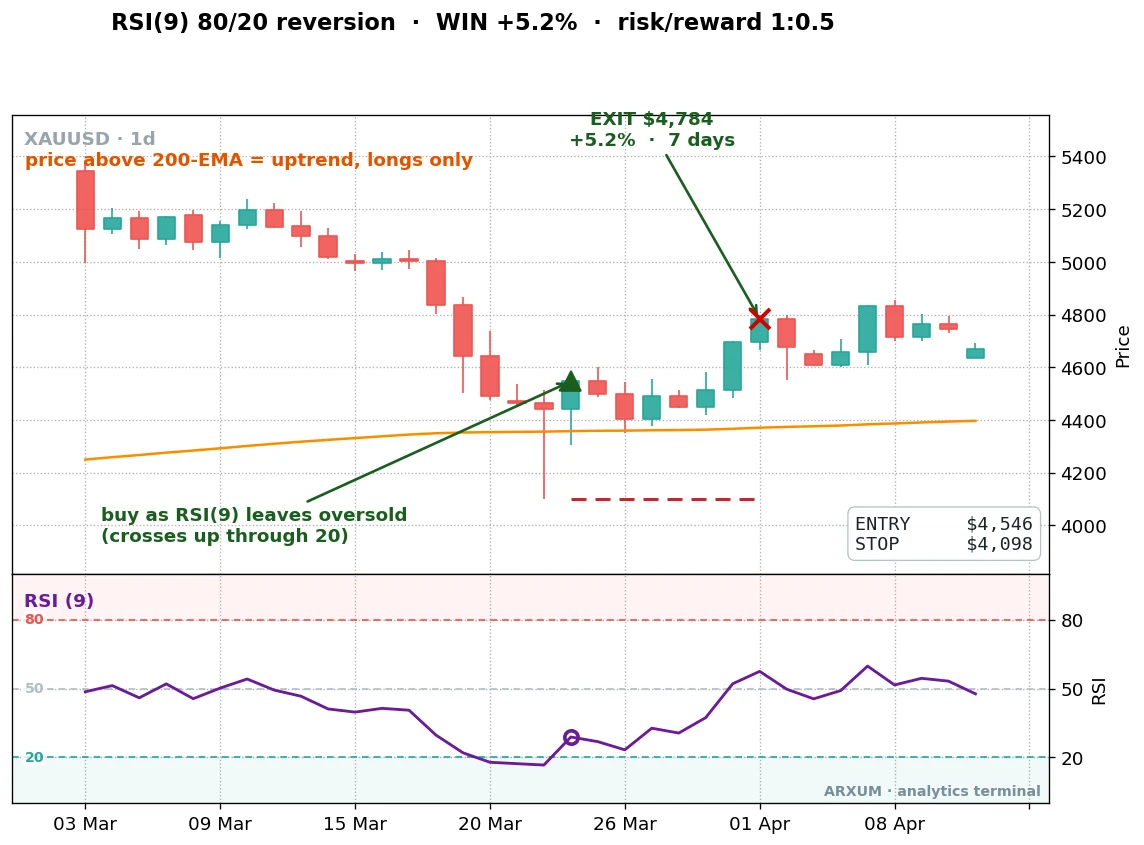
The setup is the textbook bounce: RSI drops into oversold, then ticks back up through the lower level, and you buy. The two settings change how strict that is.
The trade above is the long side: spot gold drops, RSI(9) plunges below the tighter 20 line into deep oversold, then crosses back up, and you buy the bounce. The stop sits under the recent swing low and the target is a return toward the middle of the range.
Seven days later it closed up 5.2%. It is a quick, mechanical trade with a clear trigger, exactly what the bounce play is supposed to be.
On gold daily, the period runs the other way for reversion than it does for the trend-pullback. A faster period wins. These figures take both the long and short bounce together, net of fees:
- RSI(7), 70/30: profit factor 1.21
- RSI(9), 70/30: profit factor 1.38
- RSI(14), 70/30: profit factor 1.04 (basically breakeven)
- RSI(21), 70/30: profit factor 0.62 (loses)
Read that bottom line twice. The slow RSI(21) reversion actually loses money on gold.
By the time a 21-period RSI registers oversold, the bounce it was meant to catch is usually over. For the bounce play, slow is too slow.
Then the levels. Tightening from 70/30 to 80/20 demands a deeper stretch before you act, which lifts the quality of what is left.
Here is the long side of RSI(9) with 80/20 on gold across the full eight years, the same setting as the trade above. The curve is gentle because the bounce play takes small, frequent profits rather than riding big trends.
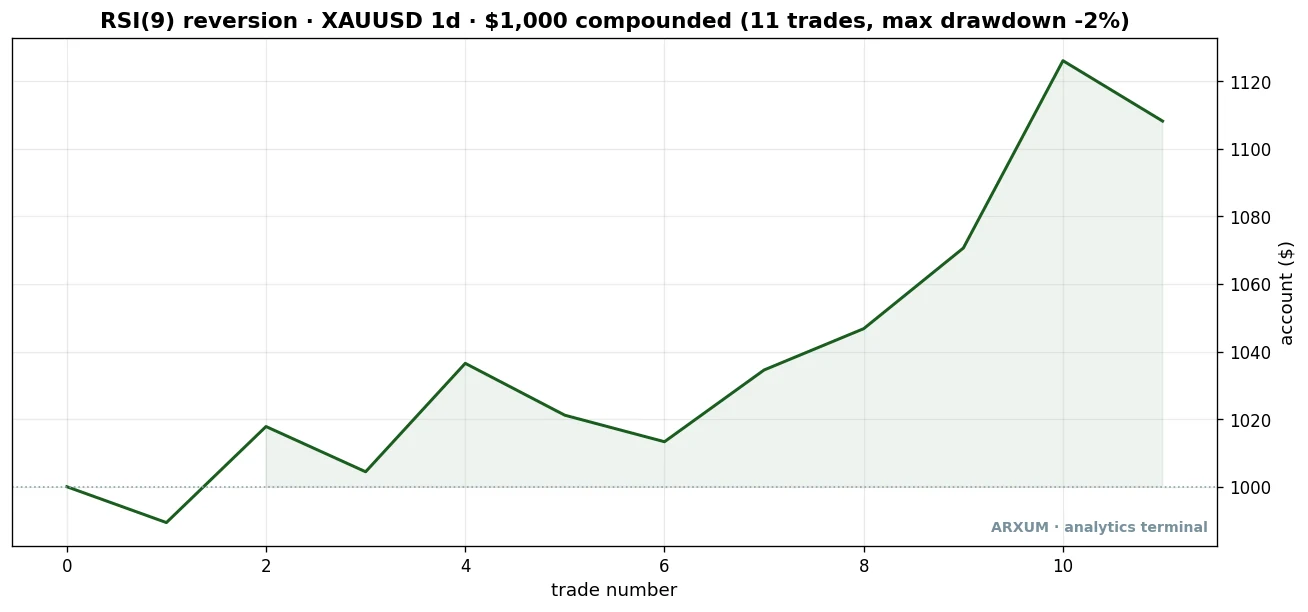
| Trades | 11 |
| Win rate | 55% |
| Reward-to-risk | 1:2.3 avg |
| Profit factor | 2.70 |
| Max drawdown | −2% |
| Net return on $1,000 | +11% |
Notice how different this profile is from the trend-pullback. The win rate is higher, 55%, because a deep oversold bounce in a strong market usually does snap back at least a little.
The reward-to-risk is smaller, 1:2.3, because you are scalping a bounce, not riding a trend. The net return is modest at +11%, but it came with almost no drawdown, which is the trade-off the bounce play offers: steadier, smaller, calmer.
The takeaway for the bounce play: a faster RSI(9) with tighter 80/20 levels beat the default 14 with 70/30 on gold, whether you read the full long-and-short run or the cleaner long-only results above. The 90/10 levels looked even better on paper but fired so rarely, often fewer than a dozen times in eight years, that there is no reliable strategy in them.
Tighter is better only up to the point where you still get trades.
The euro plays by different rules
This is where a single “best setting” falls apart. Most readers here trade Forex, so the euro matters, and the euro does not behave like gold.
EUR/USD spent most of the last eight years going sideways. Buy-and-hold returned almost nothing.
The trend-pullback, which needs a trend to pull back into, failed at every period on the euro: profit factors of 0.98, 0.94, 0.54, 0.08 for periods 7, 9, 14 and 21. There was no trend, so there was nothing to ride.
But a range is exactly where the reversion play lives. Price keeps reverting to its middle, which is what mean-reversion trades.
And here the standard settings come back into their own. On the ranging euro, plain RSI(14) with 70/30 was the cleanest pick of the bunch.
The euro’s swings are smaller and slower than gold’s, so it does not need a faster period or tighter levels. The textbook default fits it.
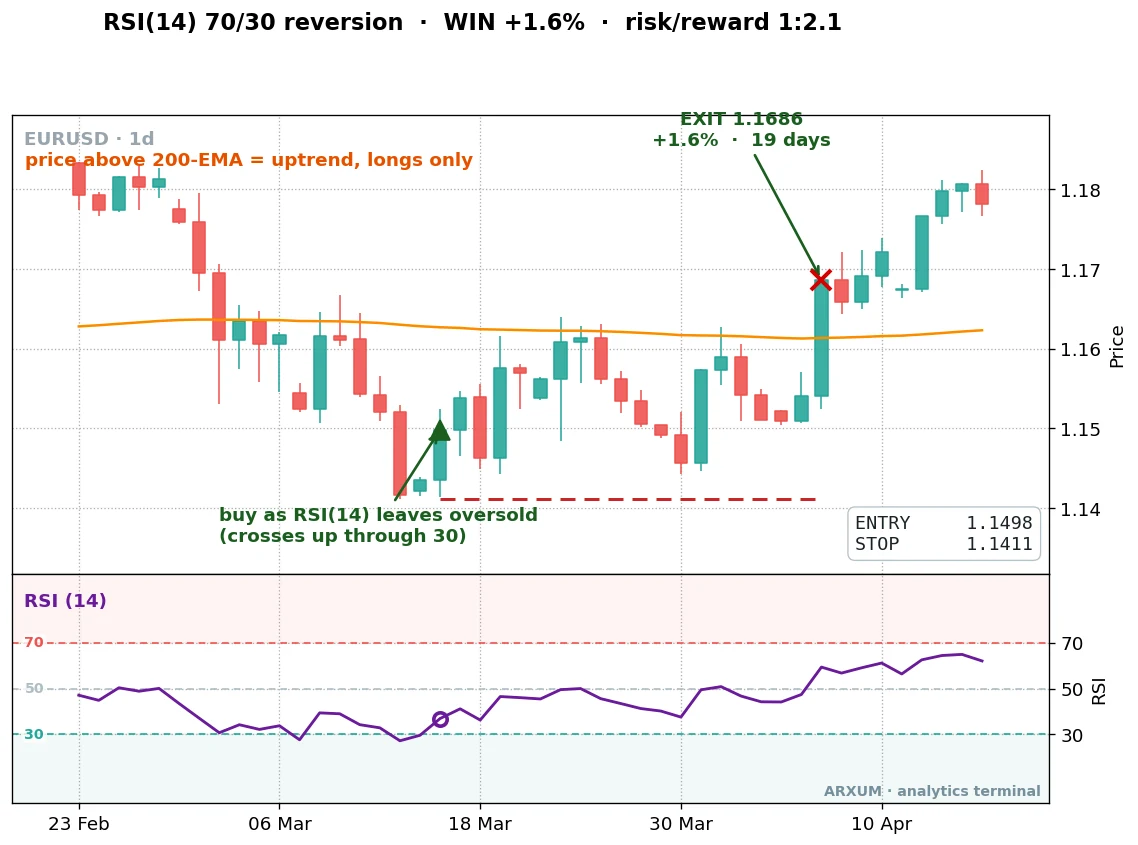
Here is that play’s full trade history on the long side, the same RSI(14) 70/30 setting as the trade above.
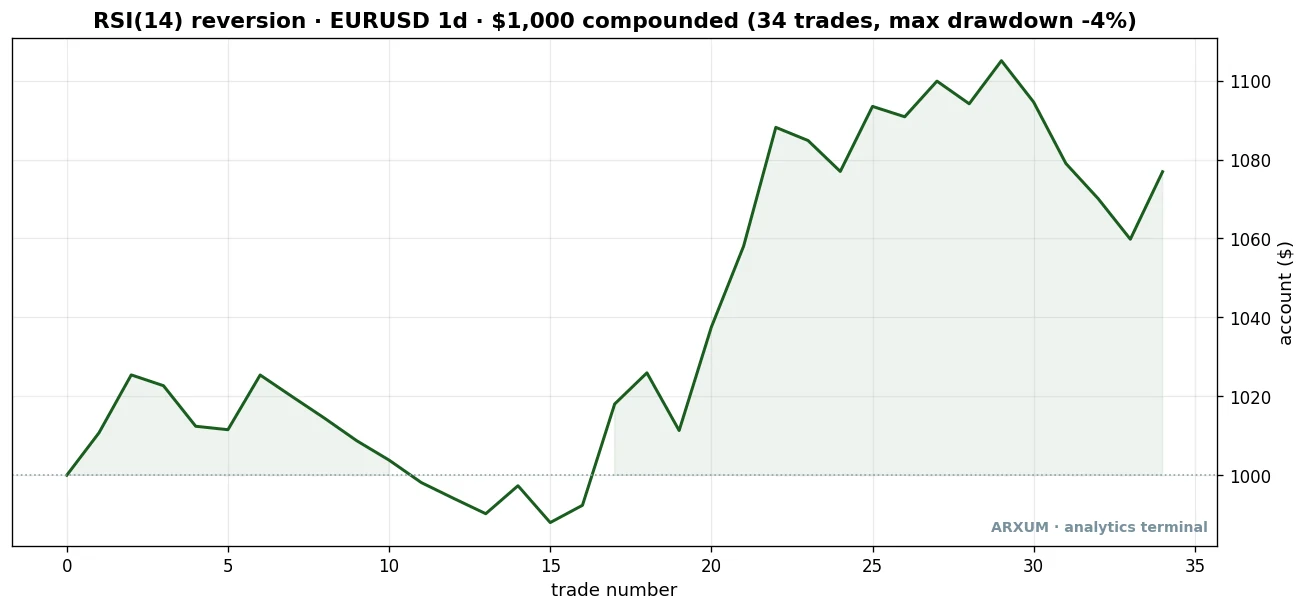
| Trades | 34 |
| Win rate | 41% |
| Reward-to-risk | 1:2.3 avg |
| Profit factor | 1.58 |
| Max drawdown | −4% |
| Net return on $1,000 | +8% |
The euro never made anyone rich here, +8% over eight years on a market that buy-and-hold left flat. But that is the point: it found a small, real edge in a market with no trend at all, using nothing but the default RSI(14) and the standard 70/30 lines.
The curve is shallow and patient, which suits a slow-moving major. You would run this for steady singles, not home runs, and you would not switch the period chasing a number, because the period was never the problem on the euro.
The lesson that actually answers “what are the best RSI settings”: match the play to the market first, then the setting follows. A trending market like gold wants the trend-pullback on RSI(14).
A ranging market like the euro wants reversion on RSI(14) with 70/30. Same period, opposite play, because the market decided, not the indicator.
The confirmation that travels, and it is not volume
Once you have a setting that pays, the next lever is a filter that tells you which signals to skip. Most guides reach for volume.
The data says skip it.
On the gold trend-pullback, adding a volume filter, only taking trades where volume spiked above 1.5 times its average, dropped the profit factor from 3.88 to 0.99. It actively destroyed the edge.
The strong RSI pullbacks in gold do not come on volume spikes; demanding one threw away the good trades.
What worked instead was calm. The precise way to measure it is ADX, a standard trend-strength gauge where a low reading means a quiet, orderly market.
Add it to your chart and treat a reading under about 22 as the calm zone, then only take the RSI entry when ADX is in that zone.
We split the trades exactly that way. The calm half ran a 5.08 profit factor against 3.88 for the full set, while the wild half barely cleared breakeven.
Splitting by raw volatility told the same story, the calm half of gold’s trades ran 5.56.
You are not adding a new signal here. You are adding a veto, a reason to pass on the noisy setups that look identical on RSI but behave nothing alike.
If you would rather not add another indicator, you can eyeball the same thing off the candles. A calm market draws small bodies and short wicks that drift in one direction, the pullback unfolding in tidy steps.
A choppy market draws long candles with big wicks that lurch up and down with no clear direction.
If the recent bars are getting smaller and the range is tightening into your entry, that is the calm ADX would confirm. If they are wild and overlapping, skip the trade and wait for the market to settle, even if the RSI rule fired.
The indicator and the eyeball are reading the same condition; use whichever you prefer.
The takeaway: the confirmation that pays is a quiet, orderly market, discovered per asset, not a volume spike. We have found the same thing running other indicators on the data, and the reasoning is laid out in the note on how filters are discovered, not assumed.
Do not bolt a volume rule onto RSI out of habit just because every guide tells you to; the data on this asset said the opposite.
When the settings still fail
No setting saves a play from the wrong market. Here is the same RSI(14) trend-pullback on gold, but a losing trade.
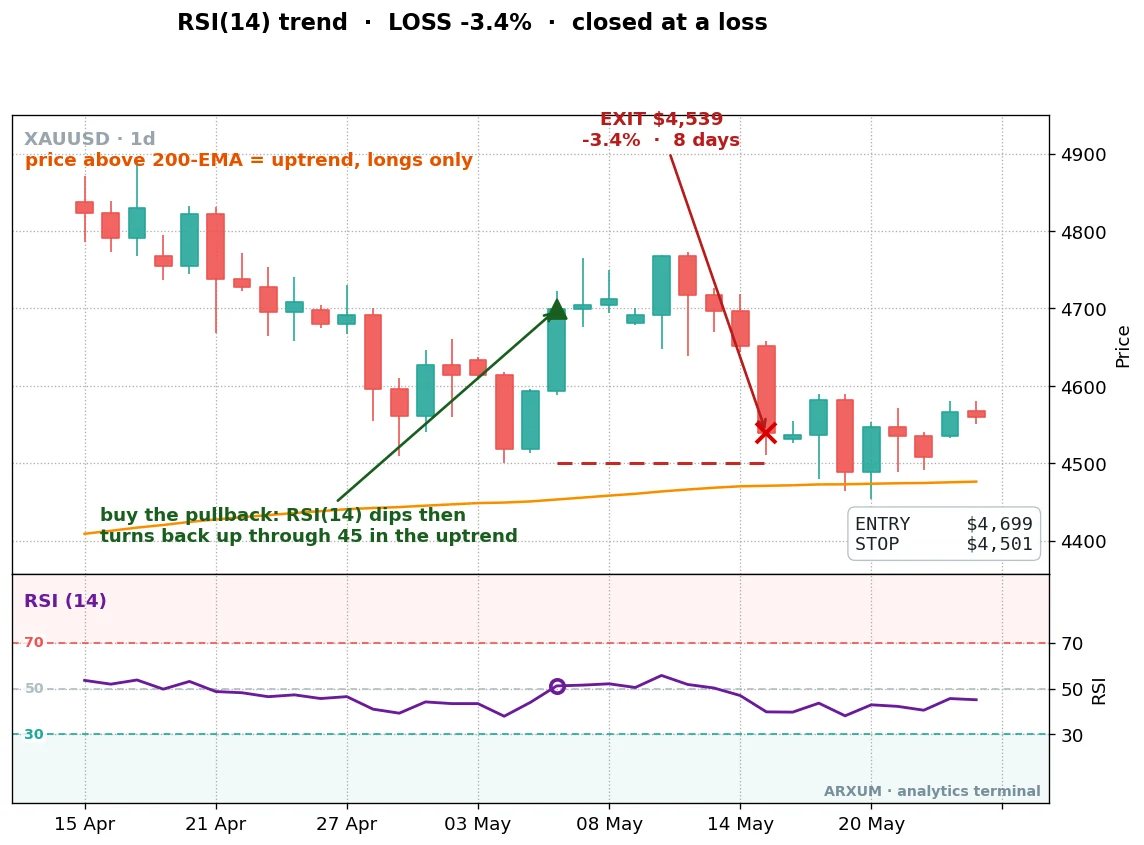
The signal was clean. Price was above the 200-EMA, RSI dipped and turned back up through 45, exactly the rule.
Then gold reversed anyway.
No setting prevents this. A low win rate means losses like this are normal and expected, which is why the stop sits right under the swing low and the loss stays small.
Three settings mistakes show up again and again, all of them traceable to the data above:
- Treating overbought as an automatic sell. RSI above 70 in a strong uptrend is momentum, not a signal to short. Gold can hold RSI over 70 for weeks during a run. The level is context, not an order.
- Optimizing after a losing streak. Switching from RSI(14) to RSI(9) because the last few trades lost just fits the setting to the recent past. The losers come with every period; the edge is in the play and the regime, not the number.
- Using one period for everything. A 14-period RSI on a 5-minute chart measures 70 minutes of momentum. The same 14 on the daily measures 14 days. They are not the same signal. Match the period to the timeframe you actually trade.
How to trade it, step by step
Say you have a $1,000 account and want to run the gold trend-pullback. Here is the whole thing, including the math beginners usually get stuck on.
- Pick the play for the market. Gold trends, so use the trend-pullback on RSI(14). For a ranging pair, use reversion on RSI(14) with 70/30 instead.
- Set RSI to 14 in your charting tool. Free TradingView does this in two clicks: add RSI, change the length field to 14, leave the levels at 70/30.
- Check the regime. Only look for longs when price is above the 200-EMA.
- Wait for the trigger. RSI dips under 45, then turns back up through it.
- Place the order. Set a buy order at the trigger price. In the stop-loss field, enter the price just below the recent swing low. In the take-profit field you can leave it open and exit when RSI drops back under 40, or set a target at a sensible level above.
- Size the trade to risk 2%. This is the part that protects the account.
Work the sizing from the account down. Risk 2% of $1,000, so $20 is the most you will lose if the stop is hit.
Say the entry is $3,300 and the stop is $3,200, a risk of $100 per ounce. Your position size is the risk budget divided by the per-ounce risk: $20 ÷ $100 = 0.2 ounces.
Here is the honest catch on an expensive market like gold. A 0.2-ounce position is a fifth of a micro lot, below what most standard brokers let you trade.
On a $1,000 account at honest 2% risk, you often cannot take a gold trade at all without a broker that offers cent or micro lots.
The fix is not to widen the stop to make the math work, that just risks more than 2%. It is to use a smaller-lot broker or trade a lower-priced market where 2% buys a real position.
Sizing always comes first; the entry is worthless if one bad trade can dent the account.
What this costs you, and the discipline that pays it back
The RSI trend-pullback wins about a third of its trades. That means losing streaks are not a malfunction, they are the cost of the edge.
The numbers say it plainly. The gold run dug a 12% drawdown to earn its return, and with a 34% win rate you should expect runs of several losses in a row.
If you hit six or so losing trades back to back, that is not necessarily the strategy breaking; it is the normal texture of a low-win-rate edge. The rule is simple: if you string together that many losses, pause for a week and check whether the market regime has actually changed, rather than tearing up the settings.
A few things keep a real trader out of trouble here:
- An edge wins over many trades, never every trade. No RSI setting is a holy grail. The profit comes from running the same play many times, not from any single entry.
- Do not chase or revenge-trade. A loss is data, not an insult. Changing the period after every bad trade is how you end up with a setting fit to noise.
- Only risk money you can afford to lose, and only watch the gap calmly. If your live results run materially worse than the data over a real sample, the edge may be fading. One bad week is variance; a sustained gap is worth stepping back to check the conditions.
None of this is a reason not to trade it. The data is honest, the scope is explicit, and the small fixed risk is the safety.
Use it if it fits how you trade.
Where to go from here
The settings question has a clean answer once you stop looking for one magic number. The play picks the period; the market picks the play.
If you want the full mechanics of the trend-pullback that did the heavy lifting here, the RSI trading strategy guide walks the entries and stops in detail. For the indicator itself, start with the RSI indicator guide.
And if you have read that RSI divergence is the secret edge, we ran that on the data too, and the result is worth knowing before you trade it. For a faster cousin of RSI with its own settings debate, the stochastic RSI covers the same ground on a more sensitive oscillator.
FAQ
What are RSI settings, in plain terms?
What is the best RSI setting?
Is RSI 14 still the best period?
Should I lower the RSI period for faster signals?
Should I use 70/30 or 80/20 levels?
What RSI settings work best for crypto?
What RSI settings are best for day trading and scalping?
Why did Wilder choose 14 as the default RSI period?
Does changing the RSI period actually improve results?
Does RSI work better on some timeframes than others?
How much money do I need to trade an RSI strategy?
Glossary: the key terms in this guide
🌍 Our recommended brokers
Reader Reviews
Be the first to review this — tell other traders what actually helped, or where it fell short.
Leave a Review

Quant Researcher & Systems Builder
Quantitative researcher who builds the automated systems behind Arxum strategy testing. Works in Python and Pine Script, using AI alongside classic backtesting to validate strategies on years of real data.