What on balance volume actually shows
Before any results, here is the thing itself. OBV is one line under your price chart, and it answers a single question: is the volume backing the price move, or quietly disagreeing with it?
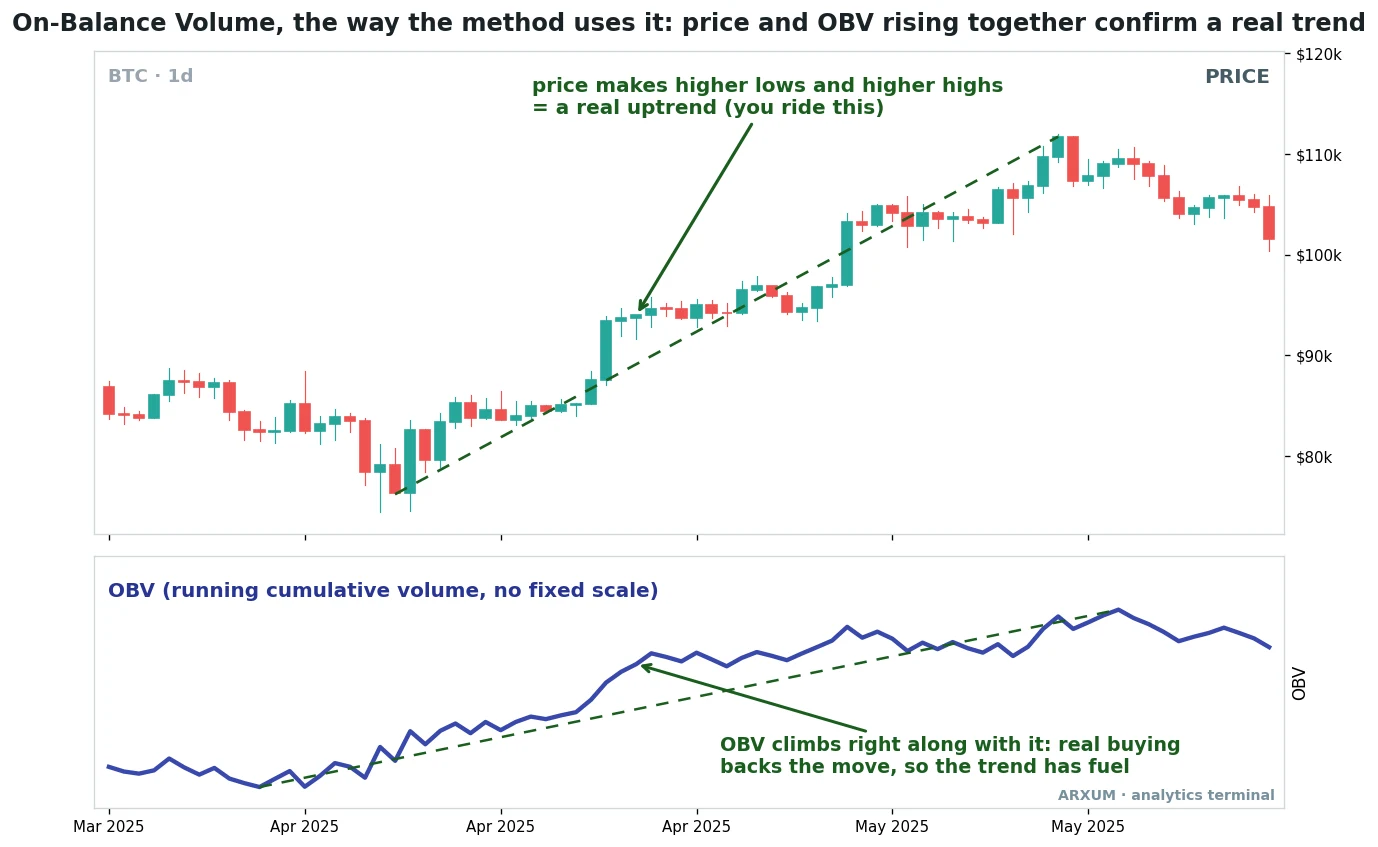
Look at how the two lines move together. Bitcoin rallied hard, and OBV rose step for step with it, higher lows and higher highs the whole way up. That is the confirmation read: real buying is backing the advance, so the trend has support underneath it rather than running on fumes.
Bitcoin is the honest place to show this, because its volume is real exchange volume rather than a proxy, a point that matters a lot later.
The math behind the line is simple. Each bar, if the close is higher than the last close, add that bar’s volume to the line. If the close is lower, subtract it, and if it is flat, leave the line alone. That running total is the whole indicator.
The absolute number means nothing. What matters is the direction of the line and whether it agrees with price.
There are two reads. The chart above shows the first one:
- Confirmation. Price is rising and OBV is rising with it, as in the chart above. Buyers are committing real volume to the move, so the trend has support behind it. This is the read the whole strategy below is built on.
- Divergence. Price grinds to a new high but OBV flattens or turns down. The new high is happening on thin, fading volume, so the move is unsupported and prone to fail. It is the rarer read, and it gets its own section later.
That is the textbook. Now the honest part: what the data says you can actually do with it.
Why not just watch the volume bars? Because OBV has memory. The bars show one bar at a time, while OBV carries the whole running balance of buying and selling into one line, which is what exposes a rally quietly running on fading volume.
Two quirks follow from how it is built. The starting value is arbitrary, so you read the slope and the crosses, never a level. And every up-close counts the same regardless of the size of the move, so OBV measures participation, not magnitude. Now to what the data says you can actually do with it.
The raw signal is barely a signal
The mechanical way traders use OBV is to smooth it with a moving average and trade the crosses. When the OBV line crosses up through its own 20-period average, that is called accumulation, meaning buyers are quietly stepping in, so you buy. A cross down is distribution, meaning sellers are taking over, so you sell.
I ran exactly that across four markets, long and short, over eight years of daily data and six years of Bitcoin, net of fees. The result was underwhelming.
| Gold (XAU/USD) profit factor | 1.37 |
| Silver (XAG/USD) profit factor | 1.35 |
| Bitcoin (4h) profit factor | 1.12 |
| EUR/USD profit factor | 0.79 |
A word on the metric, so the table reads right. Profit factor is every dollar the strategy won divided by every dollar it lost. Above 1.0 it makes money, below it loses. A 1.35 means it won $1.35 for every dollar given back.
Read against that 1.0 line, the raw cross is weak. Gold and silver scrape a small edge, Bitcoin barely clears breakeven, and EUR/USD loses outright. This is the reality behind most indicator videos: the signal on its own is a coin flip with a slight lean.
The fix is not a better OBV setting. It is refusing to take the signal unless the bigger trend agrees.
The setup that works: OBV as a trend confirmation
Here is the play that actually paid. Instead of trading every OBV cross, take the cross only when it lines up with the trend, and use OBV to confirm the trend is real rather than to call it.
The rule has three parts, and each one earns its place:
- The regime gate. Only go long when price is above its 200-period exponential moving average, and only short when it is below. The 200-EMA is a slow average of the last 200 closes; above a rising one is an uptrend, below a falling one is a downtrend. This single filter is what separates a coin flip from an edge.
- The OBV cross. Wait for OBV to cross up through its 20-period average, the accumulation signal, and only in an uptrend.
- The slope check. Take it only while OBV’s own average is still rising. That is the confirmation: volume is flowing in, not draining out, so the trend has fuel.
The stop sits under the recent swing low, which is the bottom of the most recent dip before price turned up. You place the stop just beneath it, so a real reversal takes you out but ordinary wobble does not. The target is twice the risk, so a winner makes back double what a loser costs.
Here is the key-finding chart, comparing the three OBV plays across markets. It shows why the trend-confirmation version is the one worth trading.
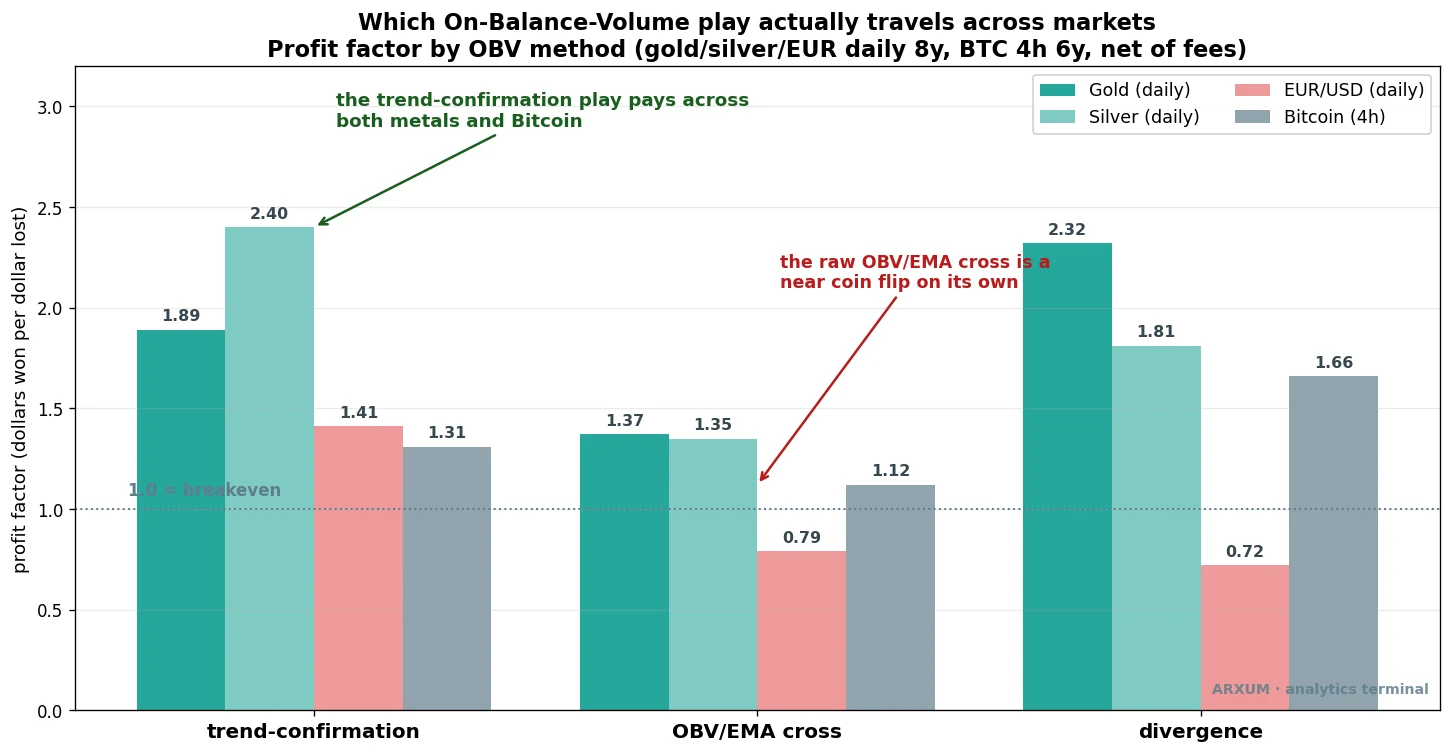
The trend-confirmation play clears breakeven on every market and posts strong numbers on the metals. The raw cross in the middle is the coin flip we just saw. Divergence on the right looks strong too, with a caveat worth its own section later.
Now the trades.
Lead with gold, because that is what is trending now
Spot gold (XAU/USD) has been in a record bull run, so it is the cleanest place to watch a trend-confirmation setup work. And to answer the question that matters most, does this still work today, both trades below are recent, pulled from the current bull run rather than dusted off from a decade ago.
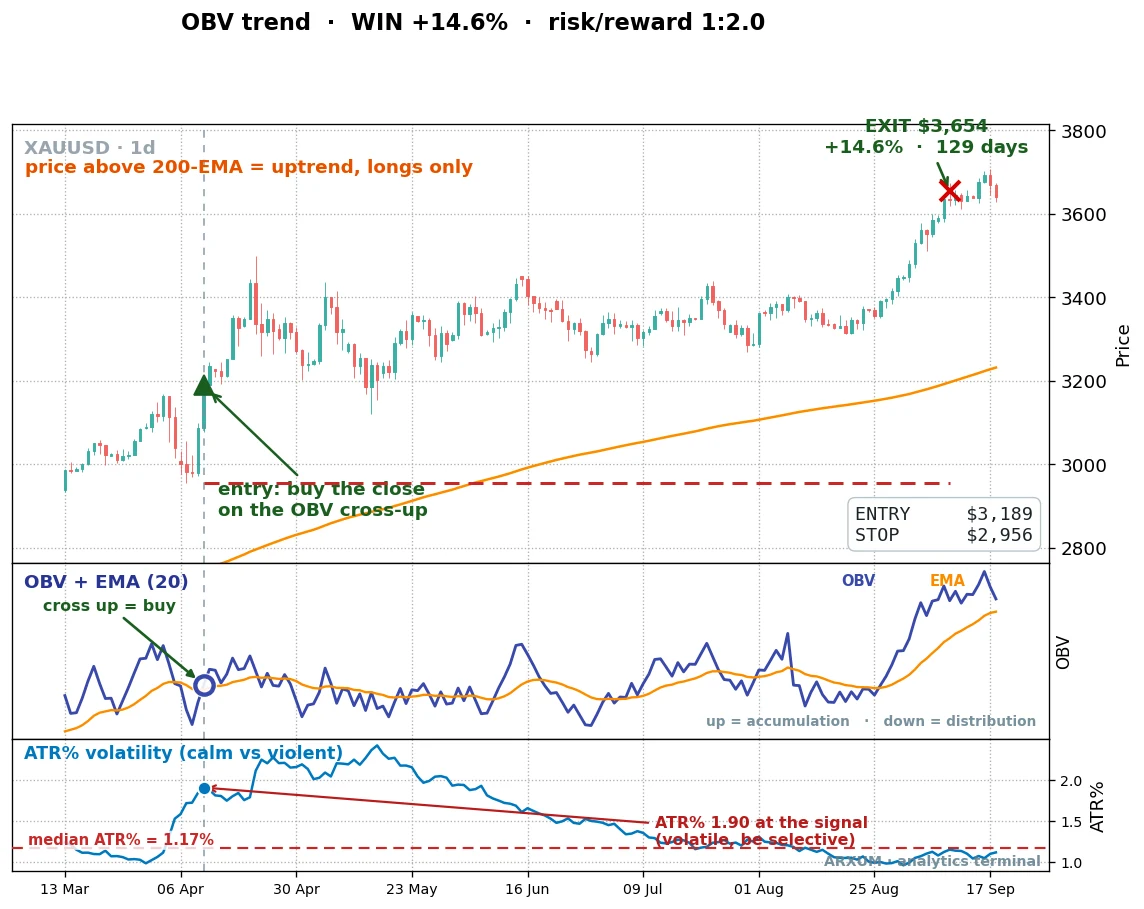
Trace the setup. Price was above the 200-EMA, so longs only. OBV then crossed up through its own average with the average still climbing, marked by the ring in the middle panel.
Notice how decisive that cross is: OBV sat below its average for several bars, then pushed up through it and stayed above. That is volume confirming the uptrend, so you buy the close.
The stop went just under the swing low at $2,956, circled on the chart, the bottom of the dip before this leg began. The target sat at twice that risk. Price ran to $3,654 and you were out for +14.6% at a reward-to-risk of 1:2.
That figure, written 1:X, is worth defining once. The 1 is your risk, the distance from entry down to the stop, and the X is the reward, how many times that risk the trade made back. A 1:2 means the winner earned double what it put on the line. The risk-reward ratio guide walks through reading that on any trade.
Notice the bottom panel too. It plots ATR%, a measure of how volatile the market is, which becomes the real story later. For now, just note it sits on the chart.
Here is a second gold trade, this one firing in a calmer market.
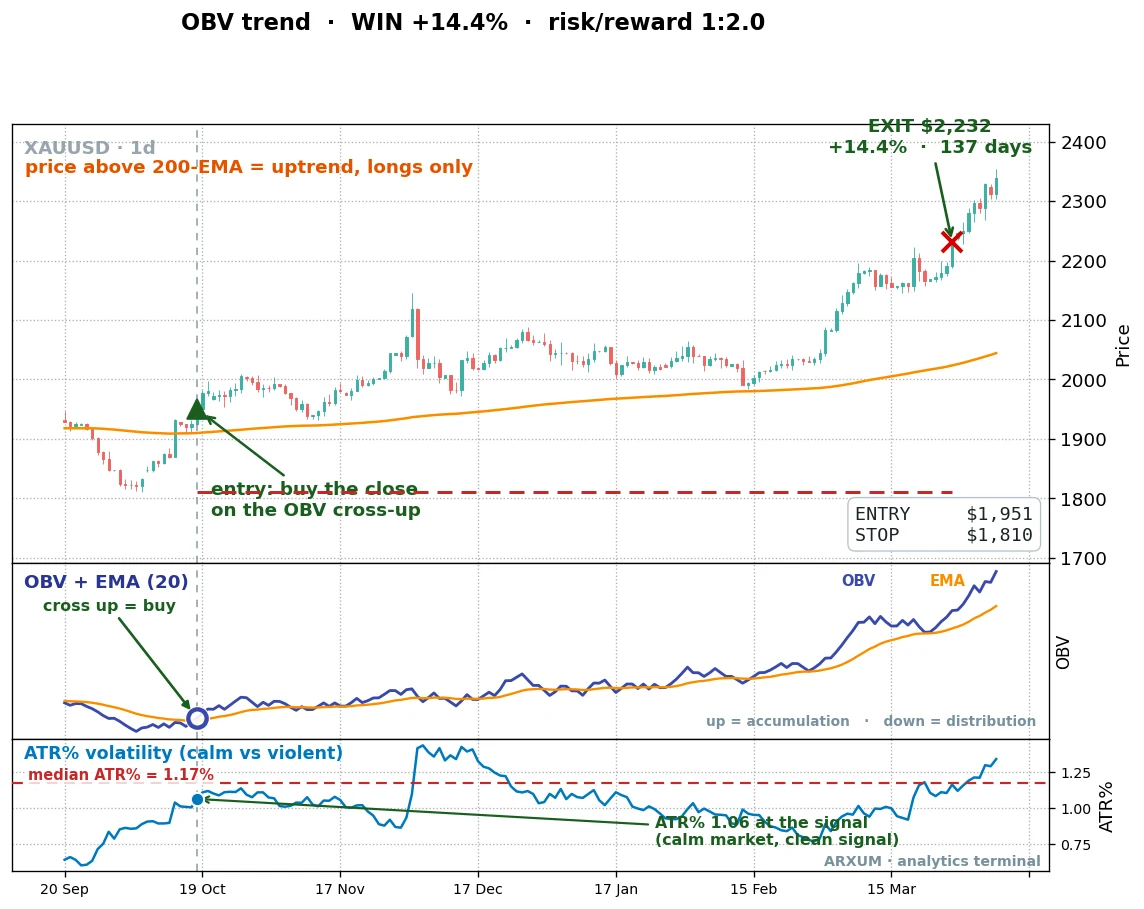
Same rules, and this time the entry landed while the market was calm, with ATR% in the quiet half of its range (that bottom panel, and why it matters, comes up shortly). OBV crossed up cleanly in an uptrend with the average rising, and the move paid the same 1:2. Two trades are anecdotes, though. A strategy has to prove it pays across the whole run, losers included.
The proof over time, not just two trades
Here is the full gold record, every trade the rule took over eight years, compounding a $1,000 account.
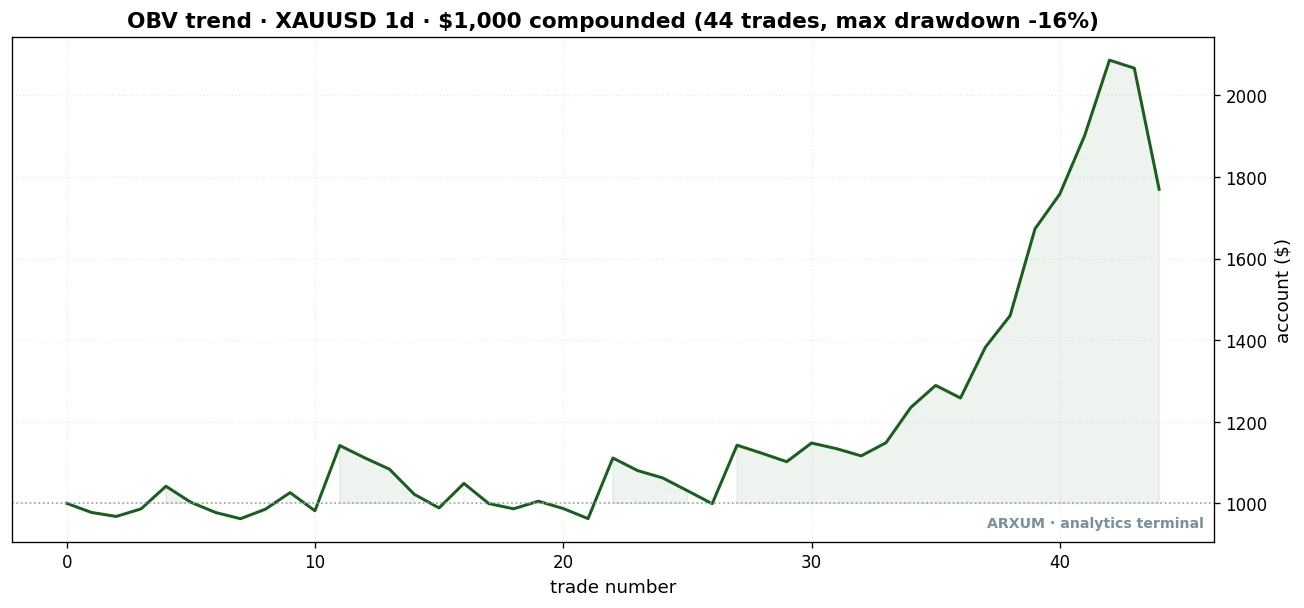
| Trades | 44 |
| Win rate | 43% |
| Reward-to-risk | 1:2.5 |
| Profit factor | 1.89 |
| Net return on $1,000 | +77% |
Look at the shape, not just the end point. The account is flat for the first stretch, a long run of small wins and small losses cancelling out. Then the back half climbs. That is the honest face of a trend-confirmation rule: a sub-50% win rate, a lot of nothing, then a handful of runners that carry everything.
The win rate is worth sitting with. It is below half, and it still makes money. That works because the 1:2.5 reward means the winners are far bigger than the losers. Win rate tells you how often you are right; reward-to-risk tells you how much it matters when you are. A low win rate with a high reward beats a high win rate with a poor one.
Here is the honest cut both ways. Most of the gold edge sits in the recent years: split the eight years in half and the early stretch barely broke even, while the recent half ran a 2.95 profit factor. That is the good news for anyone asking whether it still works, the last few years are where it worked best.
The flip side is the reason. The rule shines when gold trends and grinds when it does not, so it is riding a live bull run, not a law of nature. If gold stops trending, this edge cools with it.
Silver told the same story, louder
Silver (XAG/USD) is gold’s more volatile cousin, and it ran the same rule with bigger swings.
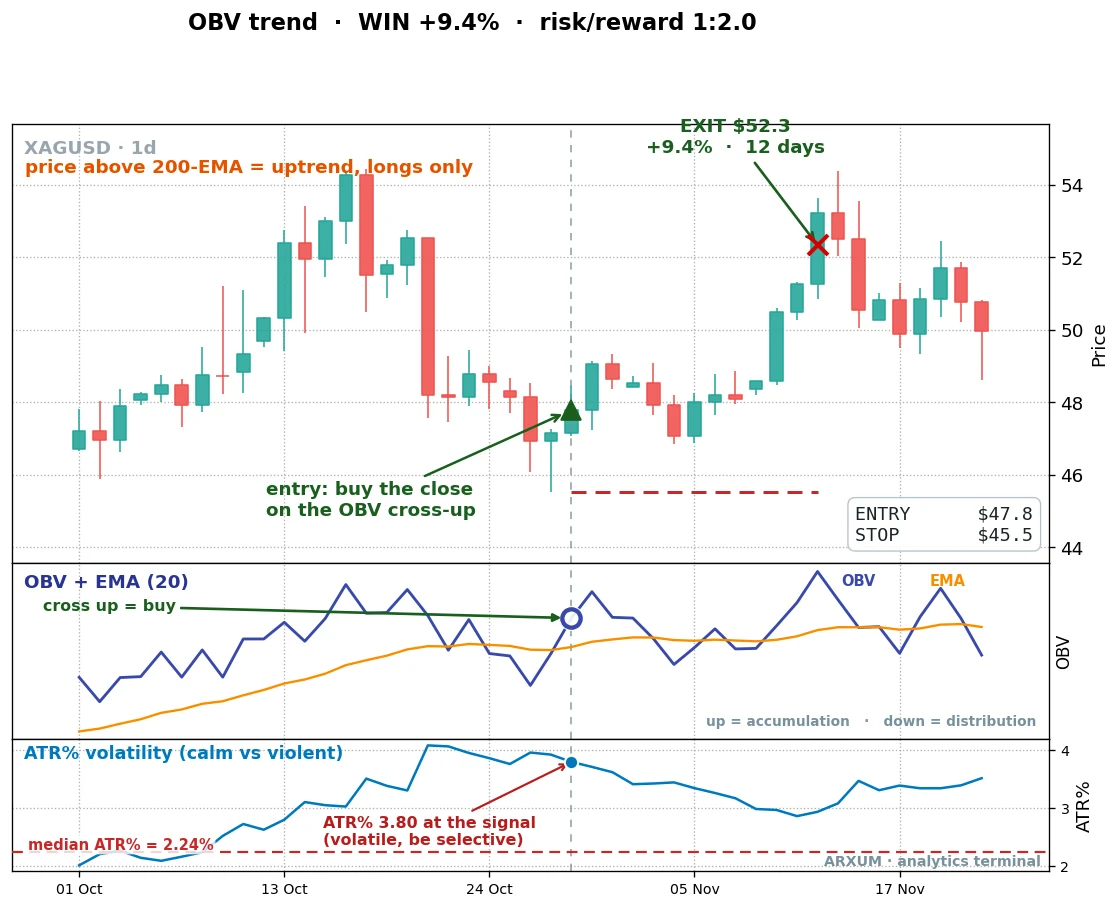
Same setup, wider range. Silver moves harder than gold, so both the winners and the losers are larger. Over the full run the numbers were stronger than gold’s.
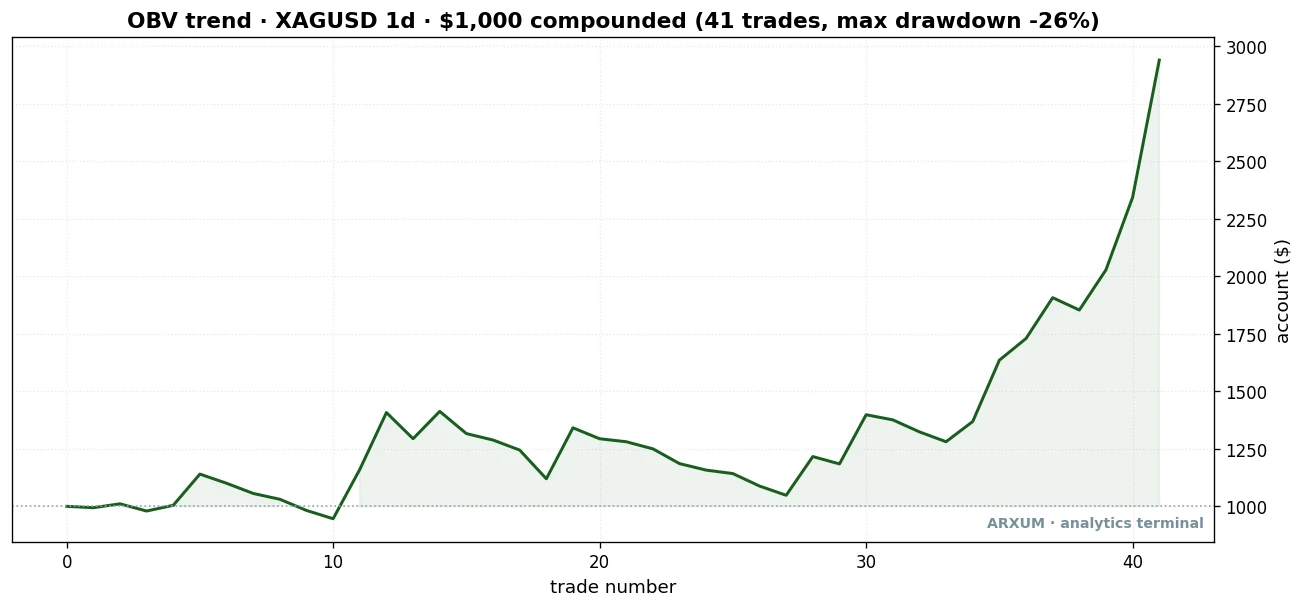
| Trades | 41 |
| Win rate | 39% |
| Reward-to-risk | 1:3.8 |
| Profit factor | 2.40 |
| Net return on $1,000 | +127% |
The trade-off is drawdown. Drawdown is the deepest drop from a high point in your account along the way, and silver’s reached 26% against gold’s 16%. Bigger returns, bigger dips. Same rule, more volatile ride.
Silver also held up better across the full history. Both halves of the eight years paid, so its edge is less dependent on the recent trend than gold’s. If you want the OBV trend play on one metal, silver has the sturdier record.
The twist: volume helps Bitcoin and wrecks Forex
Here is the finding that makes this piece worth reading, and it is the opposite of the obvious move.
OBV is built from volume. So the instinct is to add a volume filter on top: only take the trade when the entry bar has heavy volume, at least 1.5 times its 20-day average. A big-volume entry feels more real.
On Bitcoin, it worked. On gold and silver, it backfired.
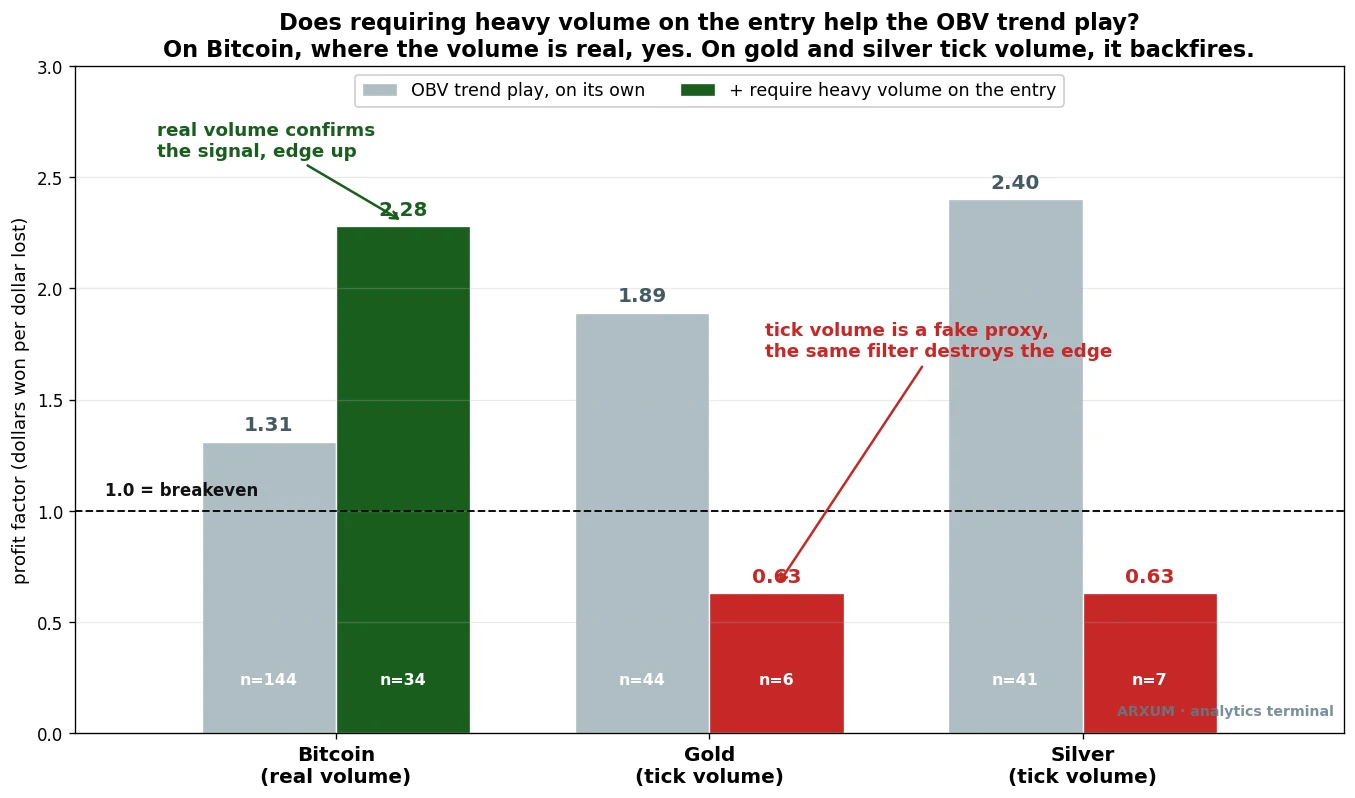
The split is stark, and the chart above tells it in one look. On Bitcoin the volume filter lifted the edge and pushed the win rate past half. On gold and silver the same filter dragged both metals below breakeven, turning winners into losers.
One honesty note on those metal numbers. The filtered-metal results sit on only six gold trades and seven silver, because demanding heavy volume throws most signals away. That is too thin to prove anything on its own. Read it as a strong hint that agrees with the real reason, not as proof by itself.
And the real reason is not the markets. It is the data feed behind them.
Bitcoin trades on exchanges that report real volume, the actual coins that changed hands. When that volume spikes, real buying happened, and it genuinely confirms the OBV signal.
Forex and metals have no central exchange, so retail platforms report tick volume instead, a count of how many times the price updated. It is a rough proxy, not real money. A busy, noisy hour can print high tick volume with no real commitment behind it. Filter on that and you are filtering on noise, so the edge falls apart.
This is the whole lesson of trading OBV honestly. Because OBV already is a volume line, stacking a raw volume filter on top double-counts, and on tick-volume markets it actively hurts.
So the rule splits by market. On Bitcoin, demand heavy real volume on the entry. On gold, silver and Forex, never add a volume filter to OBV. What the metals want instead is a calm market, which we will get to.
Here is the Bitcoin trade with the volume filter doing its job.
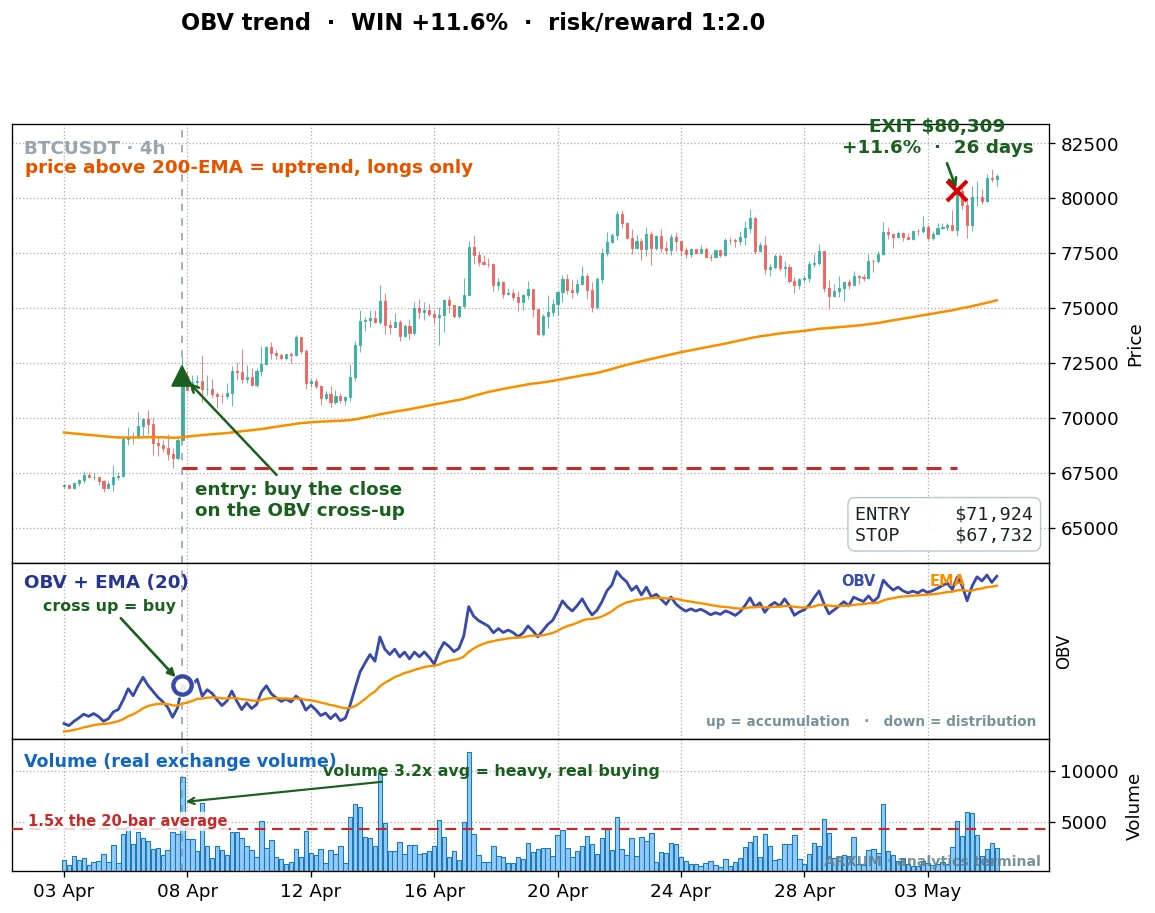
The bottom panel is the volume, with the dashed line marking 1.5 times the 20-bar average. The entry bar’s volume towered over it, more than three times the average. That is real buying confirming the OBV cross, and the trade ran to its target for a 1:2 win. On Bitcoin, this is the confirmation that earns its keep.
Line the three Bitcoin numbers up and the payoff is plain: the raw 4-hour OBV cross on its own is a coin-flip 1.12, the trend-confirmation play lifts it to 1.31, and adding the real-volume filter on top carries Bitcoin all the way to 2.28. Each layer of confirmation adds real edge, because on an exchange the volume is real.
Read calm instead of loud on the metals
If volume is the wrong filter for gold and silver, what is the right one? The data pointed at the opposite of volume: a calm market.
The metric is ATR%, which is the Average True Range as a percentage of price. In plain words, it measures how much the market typically moves in a bar. A low ATR% means small, quiet candles; a high ATR% means wide, violent ones. The Average True Range guide covers how it is built.
When I split the gold trades by volatility, the calm ones did better. Entries taken while ATR% sat in the quieter half of its range outperformed the violent ones. A trend that builds quietly tends to keep going; a market thrashing around is more likely to whipsaw you out.
You can see this on the trade charts. The bottom ATR% panel plots the market’s volatility with a dashed line at the median, and the label shows the exact level. When the reading at entry sits near or below that line, the setup is on cleaner ground.
It is a lean, not a hard gate. The two gold trades above show both sides of it: the first fired with ATR% well above the median and still won because the regime and OBV agreed, while the second fired in the calm half. Over many trades, taking the calmer entries tilts the odds your way, but a volatile reading is a caution, not a veto. On the metals, that calm read replaces the volume filter that does not work.
What about OBV divergence
Divergence is the second read introduced at the top: price makes a lower low while OBV makes a higher low, hinting the selling is drying up. In testing it did post strong numbers, a 2.32 profit factor on gold and 1.66 on Bitcoin.
Here is the honest catch. Real divergence, with a clear gap between the two lows, is rare, so those results rest on only a couple of dozen trades each. That is too thin to bank a strategy on.
So treat divergence as a bonus tell, not a signal to trade alone. If a divergence lines up with the trend-confirmation setup above, it adds conviction. On its own, it is a hint, and a small-sample one at that.
Where the setup fails
A rule is only trustworthy if you know where it breaks. This one has two clear failure modes, and both come down to the same thing: the market, not the indicator, decides.
First, the short side dies in a bull run. Here is a real gold loss.
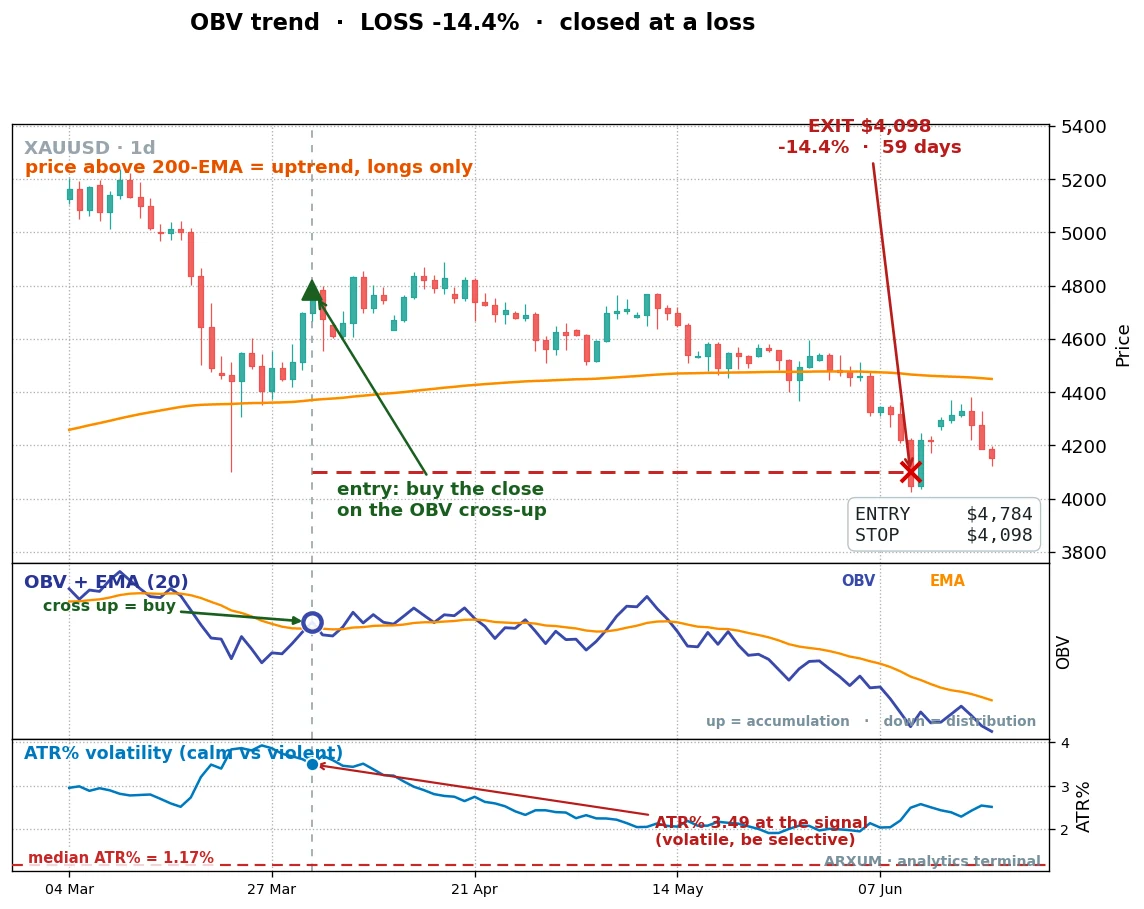
This one bought near a high in a violent market. Look at the panels: OBV turned down right after entry, the confirmation failing in real time, and ATR% at entry was 3.49%, well above the median, so the calm filter was flashing a warning. Price reversed and the trade closed for -14.4%. It is the honest picture of what a losing trend trade looks like, and why the calm read matters.
The failures cluster in two places:
- Shorting a trending market. In the test period gold and silver were in bull runs, so every OBV short flip fought the trend and lost. Gold shorts posted a 0.78 profit factor, silver 0.34. You never sell into a rising market just because OBV turns down.
- Choppy, cyclical markets on the long side. Oil ran a losing profit factor on the long trend play and fell apart out of sample, meaning on the years the rule was never built on. Oil turns in cycles rather than trending cleanly, so a with-trend long gets chopped. Notably, the oil short did pay, because oil actually reverses. Match the direction to how the market moves.
The pattern is consistent. OBV as a trend confirmation works where price trends and fails where it churns.
A straight answer on Forex
Most readers here trade Forex, so this needs to be plain rather than sold. On the currency majors, OBV is weak. I ran the same trend-confirmation rule on both big pairs, and neither paid.
- EUR/USD came out with a 0.79 profit factor on the raw signal, a loser, and thin even with the trend filter.
- GBP/USD landed at 0.98 with the trend filter, essentially breakeven across 36 trades, and negative in the first half of the test.
The reason is not a flaw in OBV. It is that the majors mostly range, chopping sideways instead of trending, and a trend-confirmation tool needs a trend to confirm. Gold, silver and Bitcoin make long directional runs; EUR/USD and GBP/USD grind in a box. OBV is a metals-and-crypto trend tool, not a Forex one.
So if you trade Forex, the honest move is to point this rule at gold rather than force it on a quiet pair, or wait for one of the rare stretches where a major genuinely trends. That said, EUR/USD is still where a small account can afford to place a trade, which is exactly why the worked example below is sized on it rather than on gold.
Two OBV-specific traps
Beyond matching the tool to the market, two mistakes are unique to reading OBV itself:
- Reading the absolute level. OBV’s number depends on where your chart history starts, so “OBV is high” is meaningless. Only the slope and the crosses carry information.
- Fading a strong trend on a divergence. A bearish divergence in a raging bull market is a warning, not a sell signal. The divergence hints; the regime decides.
Neither needs a fancier indicator to fix, just discipline about when the signal is valid.
How to trade it, step by step
Here is the whole method as a checklist you can run on a free charting platform like TradingView, which has OBV and the 200-EMA built in.
- Set the chart. Daily timeframe for gold, silver, or the metals. Add OBV, its 20-period moving average, and the 200-period EMA.
- Check the regime. Price above the 200-EMA means longs only. Below means the setup is off unless you have a confirmed downtrend.
- Wait for the cross. OBV crosses up through its own average, with that average already rising. That is your entry trigger.
- Read the market’s mood. On the metals, prefer entries when volatility is calm rather than violent. On Bitcoin, require the entry bar’s volume at 1.5 times its average or more.
- Place the order. Enter at the close of the signal bar. Put the stop-loss just under the recent swing low. Set the take-profit at twice the risk distance. Then let it run.
Now a worked example a small account can actually place. The catch with gold is its price. At over $4,000, a 2% risk on a $1,000 account will not reach a single micro lot, so the honest answer is you cannot place the gold trade on $1,000 without a fractional or cent-lot account.
So size it on a market a small account can afford. Take EUR/USD, where the same rule applies once a real trend shows up.
- Account: $1,000. Risk 2% per trade, so $20 at stake.
- Entry: a buy at 1.0850, on the OBV cross in an uptrend.
- Stop: below the swing at 1.0810, which is 40 pips away. A pip is the smallest standard price step, the fourth decimal, and on a standard lot it is worth $10.
- Position size: risk budget divided by risk per lot. At 40 pips, a standard lot risks $400, so $20 ÷ $400 = 0.05 lots, which is 5 micro lots. Every broker offers micro lots, so this fills on a $1,000 account.
- Target: twice the risk, so 80 pips at 1.0930. If it hits, the trade makes $40, a 1:2 reward.
That trade is placeable, the risk matches the 2% rule, and the arithmetic is all there: $20 at stake, 40-pip stop, 0.05 lots, $40 target. The gold and silver charts above show the same logic on a bigger instrument.
Keeping it honest with yourself
The numbers here come from testing, and a live account behaves a little differently, so keep a calm eye on how your trades track this record.
A few losing trades in a row is normal, not a broken system. At a 43% win rate, three or four losses back to back will happen, and the flat stretches on that equity curve are exactly where they live. One bad week is variance, so do not tear up the rule, and do not pile on risk after a good one either.
A sustained gap is different. If results run much worse across a real sample, the trend may have faded. Step back and check conditions before adding risk, and only ever trade money you can afford to lose.
Remember this
If you take three things from all of this, take these:
- Trend first, always. The raw OBV cross is a coin flip. Only trade it with price on the right side of the 200-EMA, longs above and shorts below. That gate is what turns the signal into an edge.
- The volume filter is for crypto only. On Bitcoin, real exchange volume confirms the entry. On gold, silver and Forex, the volume is a tick-count proxy, so a volume filter backfires; read a calm market instead.
- If you are small, size on EUR/USD, not gold. Gold’s wide dollar stops price a $1,000 account out of a micro lot. A cheaper instrument lets you place the same setup at honest 2% risk.
Where to go from here
The natural next steps are the tools and cousins this method leans on:
- The Average True Range guide explains the volatility measure behind the calm-market filter, and how to use ATR for stops on any trade.
- Money flow index is OBV’s close relative, a volume-weighted oscillator with the same real-versus-tick-volume catch. Read the two together to see how volume tools behave across markets.
- Wyckoff accumulation is the framework OBV grew out of, reading accumulation and distribution phases by hand.
- Volume profile trading shows volume by price level instead of over time, a different lens on the same force.
FAQ
What is on balance volume, in plain terms?
Does the on balance volume indicator actually work?
What is the best on balance volume indicator setting?
What is an OBV trading strategy that actually pays?
What is OBV divergence and should I trade it?
Why does adding a volume filter hurt OBV on Forex?
Which markets and timeframes work best for OBV?
Can I use OBV to trade the short side?
How much money do I need to start trading OBV?
How do I place an OBV trade step by step?
How many losses in a row should I expect?
What do the key terms mean?
🌍 Our recommended brokers

Quant Researcher & Systems Builder
Quantitative researcher who builds the automated systems behind Arxum strategy testing. Works in Python and Pine Script, using AI alongside classic backtesting to validate strategies on years of real data.