

The Ichimoku Cloud, by the textbook
Here is the thing you came to see. This is what an Ichimoku chart actually shows, drawn the way every platform draws it.
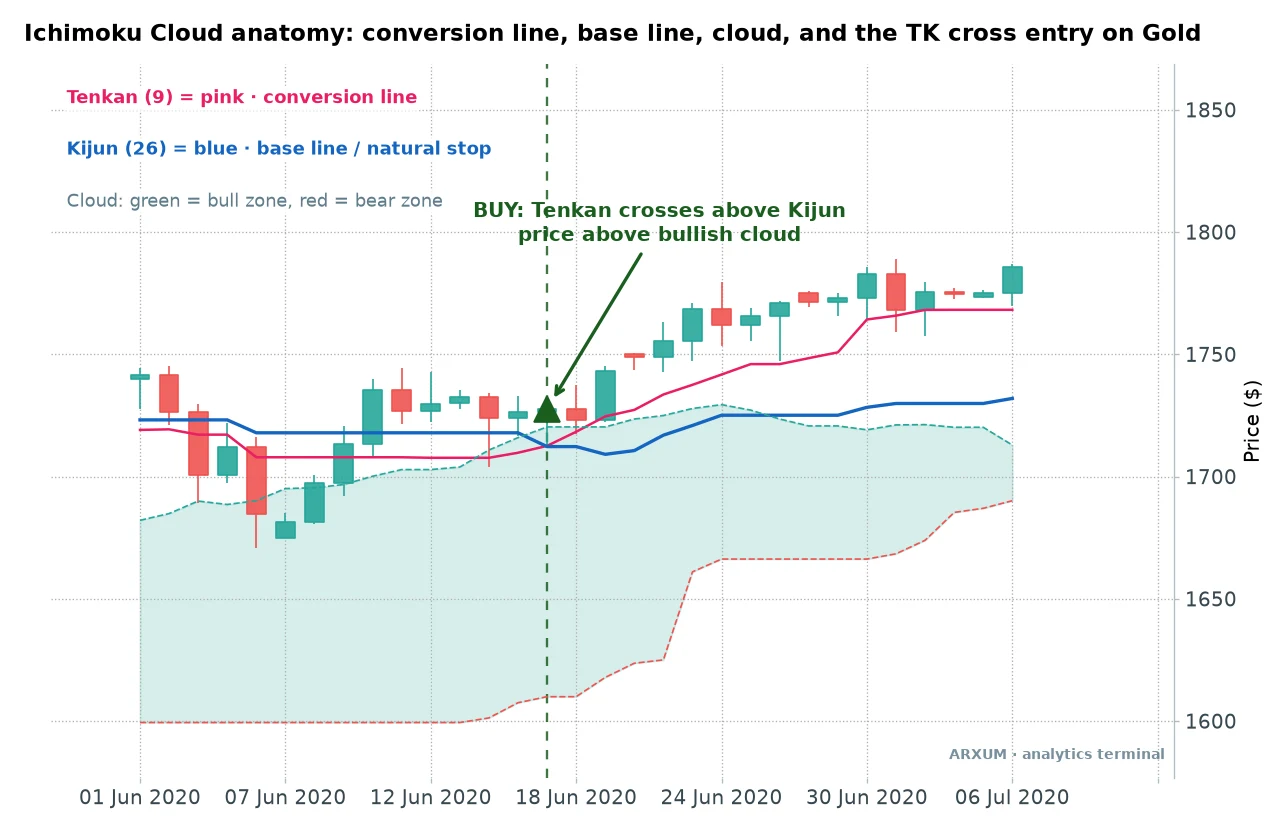
Most traders close this chart within thirty seconds. Five lines and a colored cloud looks like noise next to a clean price chart with one moving average.
It is not noise. Each line answers one question about price, and once you know the question, the chart reads fast.
Here are the five pieces, front to back.
Tenkan-sen, the conversion line (9 periods). The midpoint of the last nine bars’ high and low. It is the fast line, tracking short-term momentum.
On its own it whipsaws too much to trade.
Kijun-sen, the base line (26 periods). The midpoint of the last twenty-six bars. Think of it as fair value for the recent range.
Price tends to snap back toward it, which is why it also works as a trailing stop.
Senkou Span A and B, the two cloud edges. Span A is the average of the Tenkan and Kijun, pushed twenty-six bars into the future. Span B is the midpoint of the last fifty-two bars, also pushed forward.
The shaded area between them is the cloud.
Chikou Span, the lagging line. Today’s close, plotted twenty-six bars back. When it sits above the old price, momentum leans bullish.
It is the piece most people ignore.
The cloud itself, the Kumo, is the heart of it. A green cloud means Span A is above Span B, bullish structure.
A red cloud is the reverse. When price sits above a green cloud, you have a trend worth trading with, and the top of the cloud becomes support on the way down.
That is the whole anatomy. Now for the part that pays.
The three signals a trader actually acts on
You do not trade all five lines at once. Three signals do the real work, and they build on each other from loose to strict.
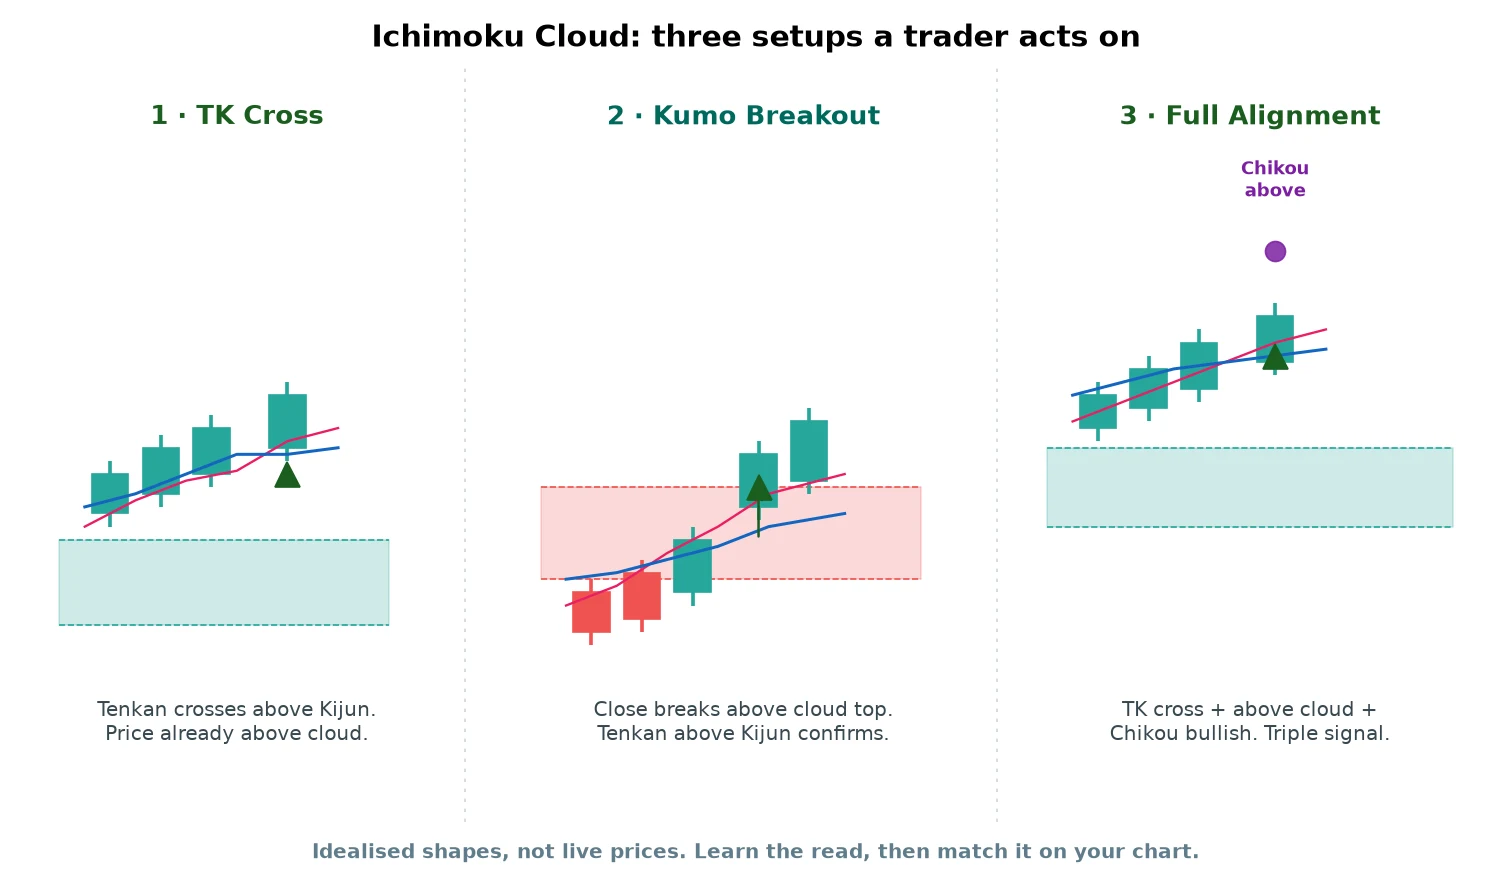
The TK cross. The Tenkan crosses up through the Kijun while price is already above the cloud. The classic Ichimoku entry, and the one we lead with.
The kumo breakout. Price closes up through the top of the cloud, with the Tenkan already above the Kijun to confirm. This catches a fresh trend as it leaves a range.
Full alignment. All three line up at once: price above the cloud, a TK cross, and the Chikou above the price from twenty-six bars ago. Rare, strict, and the version that waits for everything to agree.
Each one is a long setup here, mirrored for shorts. The question is which of them actually made money, and on what.
What the data says: Ichimoku is a trend engine
We ran all three setups, long and short, across eight years of daily data on three markets. One picture carries the whole finding.
Profit factor is the number that matters here. It is total dollars won divided by total dollars lost across every trade, so above 1.0 means the setup made money and 1.8 means it won $1.80 for every $1 it gave back.
Every bar below uses the same fixed exit, a target set twice the risk away, which the chart marks as 2R on its axis.
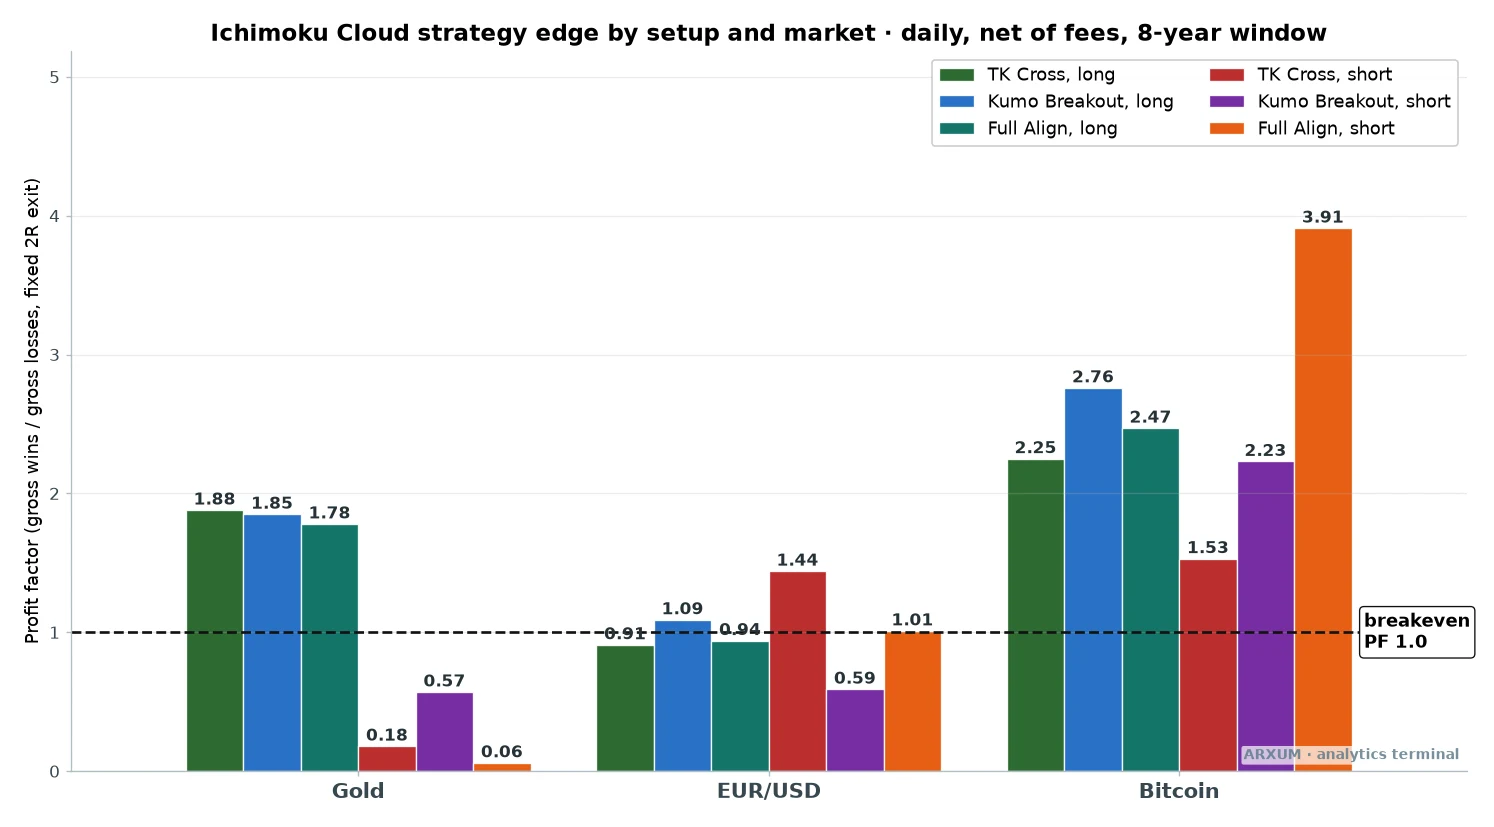
Here is the long side, side by side.
| Setup (long) | Gold | EUR/USD | Bitcoin |
| TK cross | 1.88 | 0.91 | 2.25 |
| Kumo breakout | 1.85 | 1.09 | 2.76 |
| Full alignment | 1.78 | 0.94 | 2.47 |
The pattern is hard to miss. Every long setup paid on gold and paid more on Bitcoin.
Both markets trended hard over the window, and a trend tool feeds on trend.
The euro is the tell. It spent those years grinding sideways in a range, and every Ichimoku long there landed within a whisker of breakeven.
No trend, no edge. One euro short bar on the chart does poke above the line, but a lone winner in a sideways market is noise, not an edge you can lean on.
The shorts make the same point in reverse. On gold, which climbed almost the whole time, the short setups were a bloodbath, with profit factors from 0.06 to 0.57.
On Bitcoin, which fell in real stretches too, the shorts actually paid, some above 2.0. The tool works both ways.
It just needs a market that moves in one.
The takeaway: trade Ichimoku longs in an uptrend and shorts in a downtrend, and only in a market that trends at all. That is not a hedge.
It is the entire edge.
One honest note before the setups. Over this window, simply buying and holding gold returned far more than any timed setup, because a screaming bull run rewards sitting still.
That is bull-market arithmetic, not a knock on the method.
What the setups give you instead is a defined risk on every trade, a much shallower account drawdown, and a system that also shorts when the market finally turns. Buy-and-hold offers none of that.
Setup 1: the TK cross
This is the one to learn first. It fires the most often and carries the cleanest story.
Before the rules, one tool you need on the chart. ADX is a trend-strength gauge, a single line that rises when a trend is real and falls when the market chops.
It runs from zero up past forty. The 22 level is the common line between chop and trend.
You can add it free on any platform, and I lean on our ADX indicator guide for the full read. Here it is context, not a trigger.
The rules, on the daily chart:
- Price is fully above the cloud, so the trend is up.
- The Tenkan crosses up through the Kijun at or above the cloud.
- Enter on the close of the cross candle.
- Stop goes below the Kijun, which trails up as the trend runs.
- Aim for a target twice your risk, a 1:2 reward, and trail the Kijun once you are ahead.
That is the raw setup. Here is one running on spot gold (XAU/USD) in the current market.
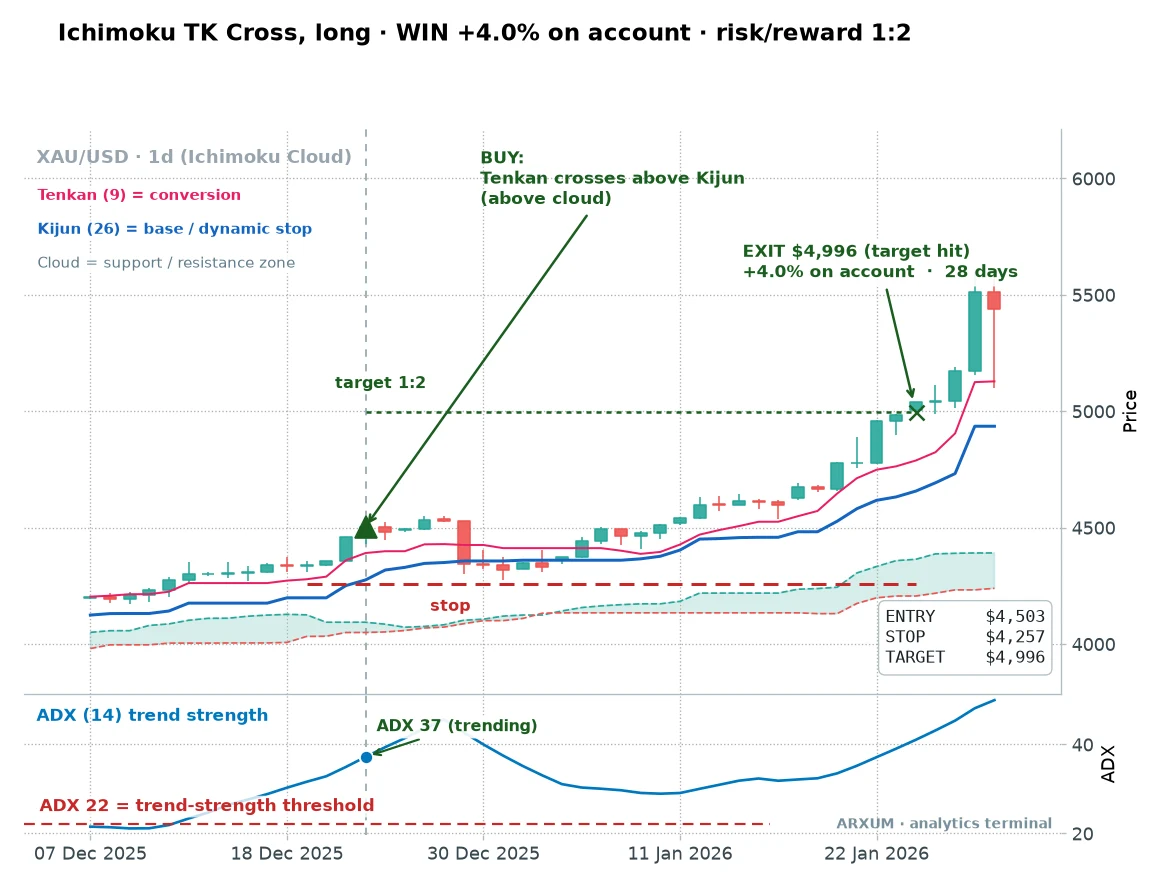
The read is clean. Price is already above a green cloud, the Tenkan flips up through the Kijun, and you buy the close.
Risk was the gap from entry to the stop under the Kijun, about $246 an ounce. The target sat twice that distance away, and price walked there over twenty-eight days while the Kijun trailed underneath, a textbook 1:2.
Here is a second one, on gold again, from an earlier stretch when the metal traded near $2,180.
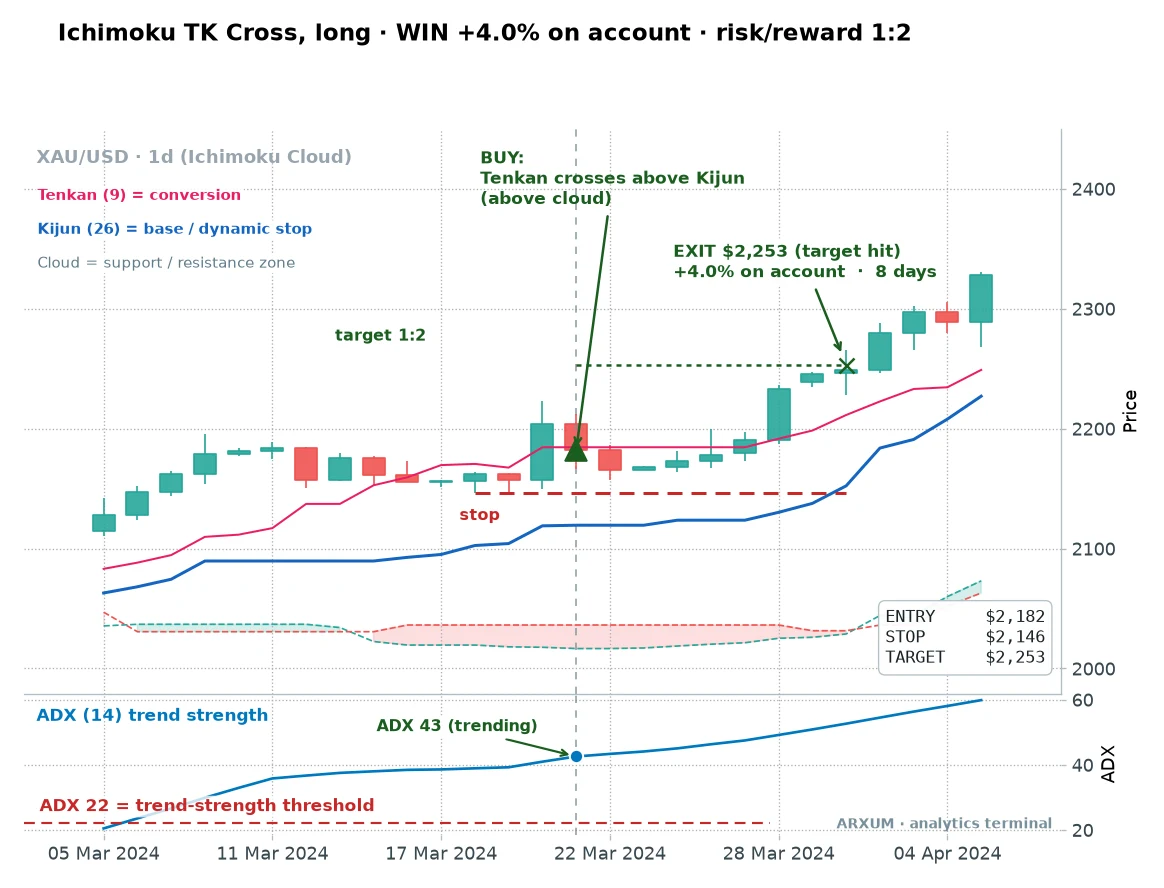
Same signal, tighter stop, quicker payoff. The point of two winners from different price eras is that this is not one lucky trade.
The cross has been doing this job for years, and it is still doing it now.
Across the full eight years on gold, the raw TK cross took sixty-eight trades, won 59% of them, and ran a 1.88 profit factor. Turned into an account, that is what the next chart shows.
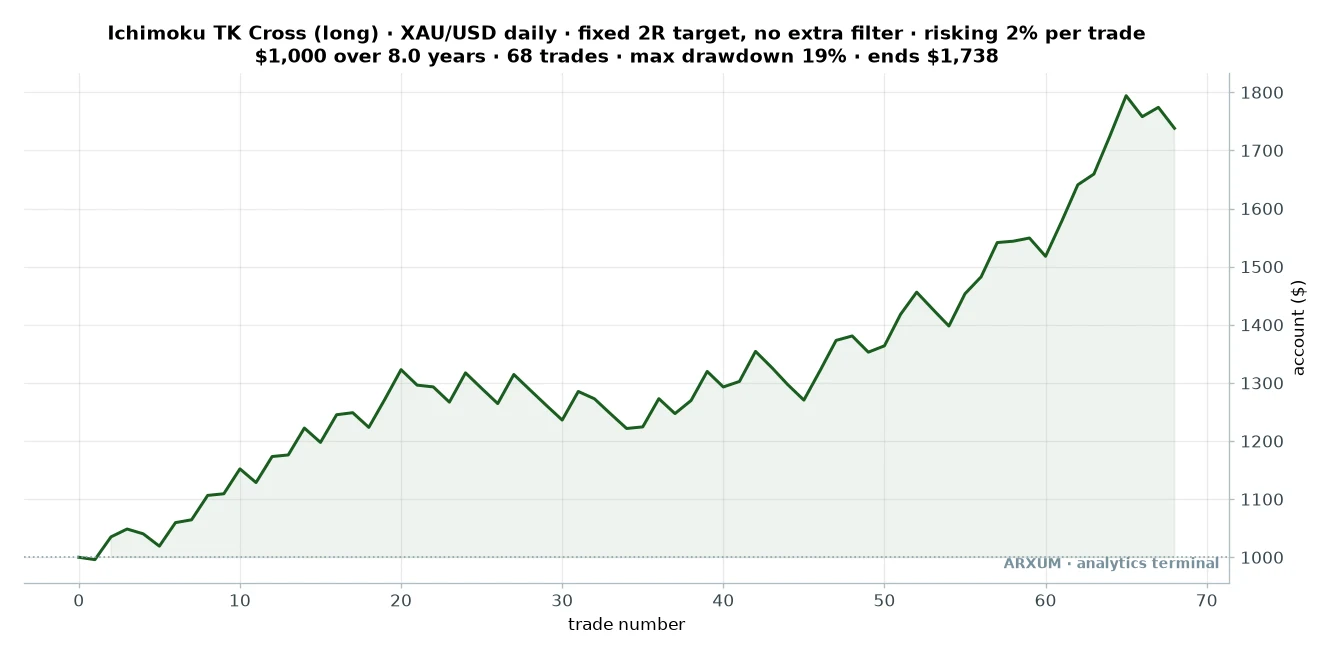
Read that curve for what it is. It climbs, then chops sideways for a long middle stretch, then climbs again.
That deepest dip from a peak, the drawdown, reached about 19% here before the account recovered.
That flat middle is the part that breaks most traders, and it is completely normal.
One term in the table below. Reward-to-risk, written 1:X, is how many times its risk an average trade made back, so 1:1.3 means the typical trade returned about 1.3 times what it put at stake.
| Trades | 68 |
| Win rate | 59% |
| Reward-to-risk | 1:1.3 avg |
| Profit factor | 1.88 |
| Max drawdown | −19% |
| Avg hold | 22 days |
| Net return on $1,000 | +74% |
A word on reward-to-risk. The setup aims for 1:2 on every trade, a target twice the risk, but the average realised reward comes in near 1:1.3, because some winners get trailed out early and the odd loss slips past the stop.
That gap between target and reality is honest, and it is why the win rate has to stay high.
The filter that cuts the drawdown
The raw cross works, but a 19% account drawdown is a lot to sit through. So we swept the market conditions at each entry to see what separated the good crosses from the ugly ones.
One filter stood out.
When the TK cross fired in a calm market, with ADX under 22, the profit factor jumped from 1.88 to 2.85, and the drawdown collapsed from 19% to about 4.5%. Fewer trades, thirty-two instead of sixty-eight, but far smoother.
The logic is intuitive once you see it. A calm reading means you are buying a quiet pullback inside a trend, not chasing a move that has already gone vertical.
Here is the flip side, a loss, to make the danger concrete.
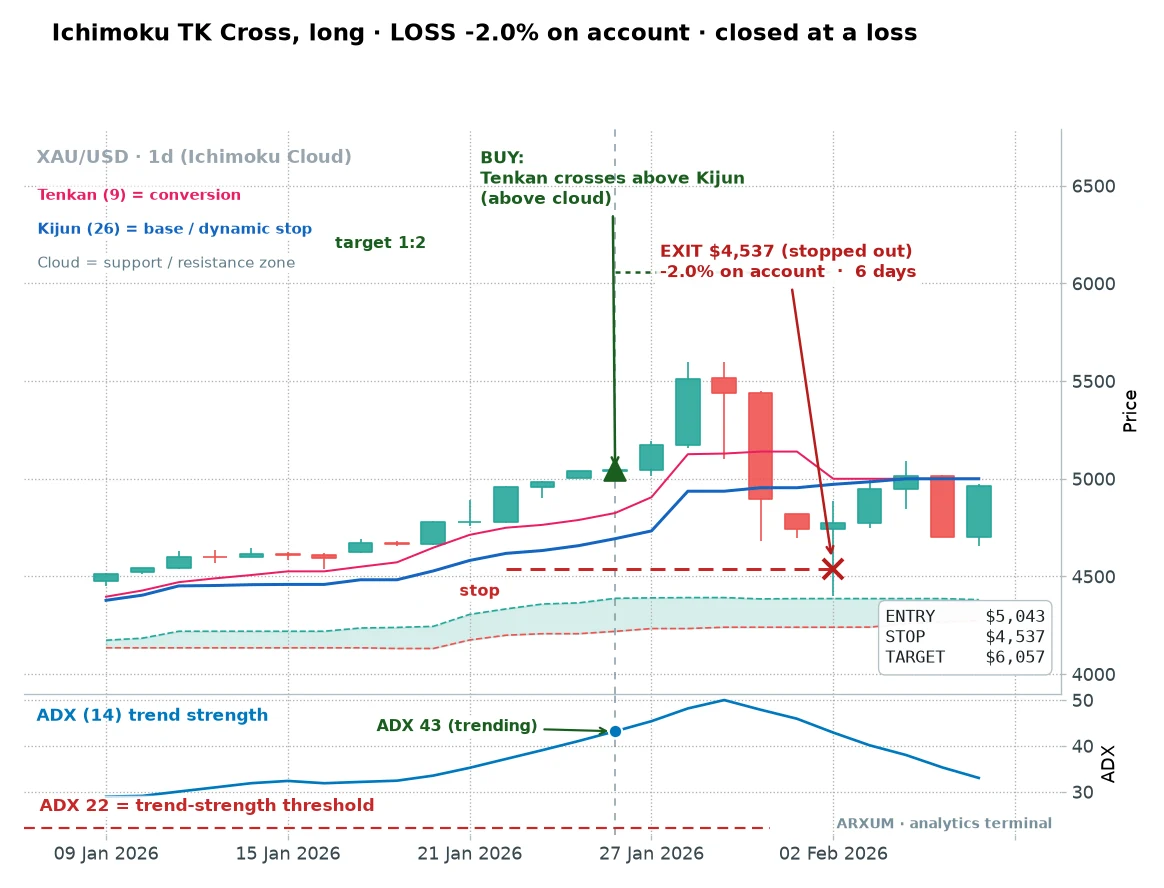
This cross was valid by the rules. Price above the cloud, Tenkan over Kijun.
But it fired with ADX at 43, deep into an extended move, and the trend simply ran out of room. Six days later it hit the stop.
So read ADX as context, not a gate. A reading above 22 confirms a real trend exists.
A reading well above it, in the forties, is a warning that you may be late.
This is why the winning cross earlier, taken at ADX 37, still worked while this loss at 43 did not. The thirties are fine.
The thirty-two calm trades under 22 were simply the smoothest of the lot, and the danger zone is the forties, not the low-to-mid thirties. The cleanest entries came in the quiet before the next leg, not the roar of the last one.
Setup 2: the kumo breakout
The second setup trades the moment a trend is born rather than one already running. It caught the shallowest drawdown of the three.
The rules, on the daily chart:
- Price has been stuck inside or under the cloud, going nowhere.
- A candle closes clean above the top of the cloud.
- The Tenkan is above the Kijun, confirming the breakout.
- Stop below the cloud, target twice the risk.
Here is one on gold, and notice the ADX reading at entry.
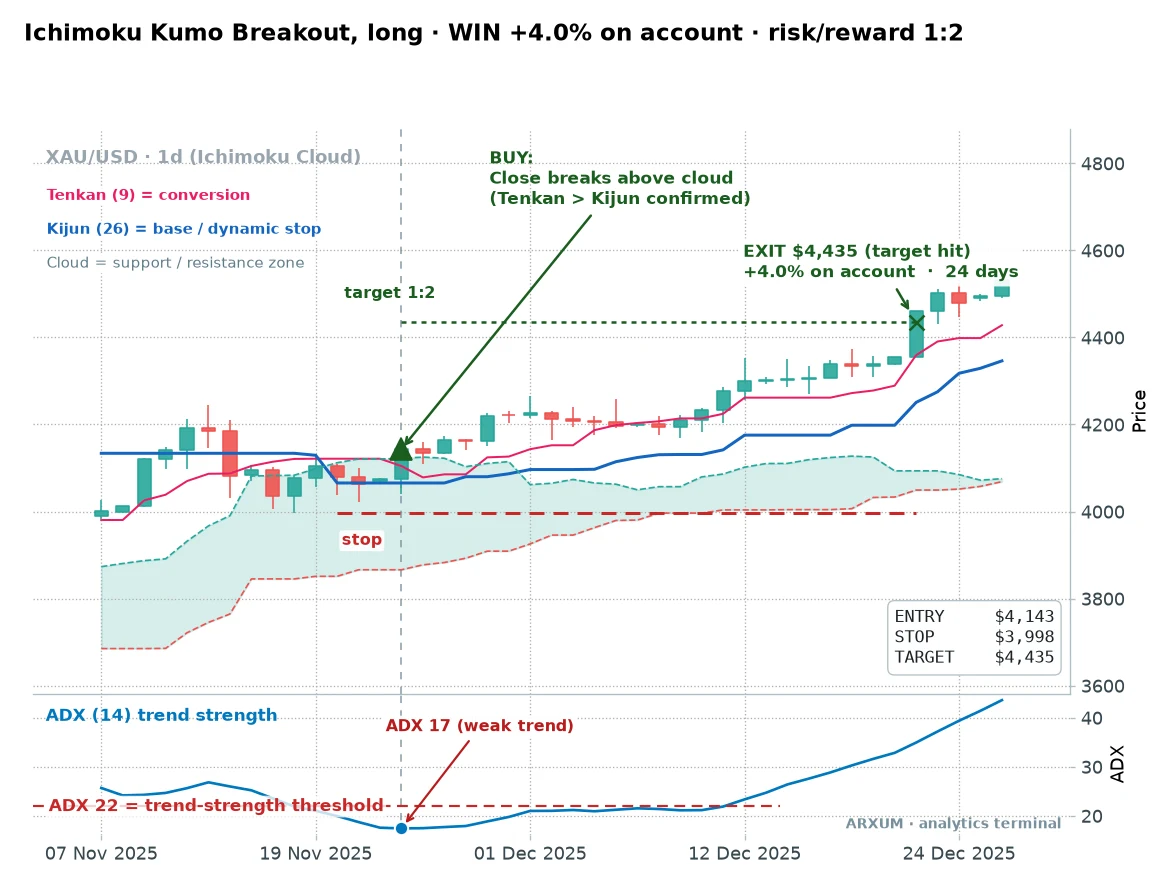
ADX 17 is a calm, almost sleepy market. That is the kumo breakout at its best, catching the first push out of a flat cloud before the crowd notices.
Price had drifted inside the cloud for weeks. The moment it closed above the top with the Tenkan leading, the trend was on, and it walked to a 2:1 over the next three-and-a-half weeks.
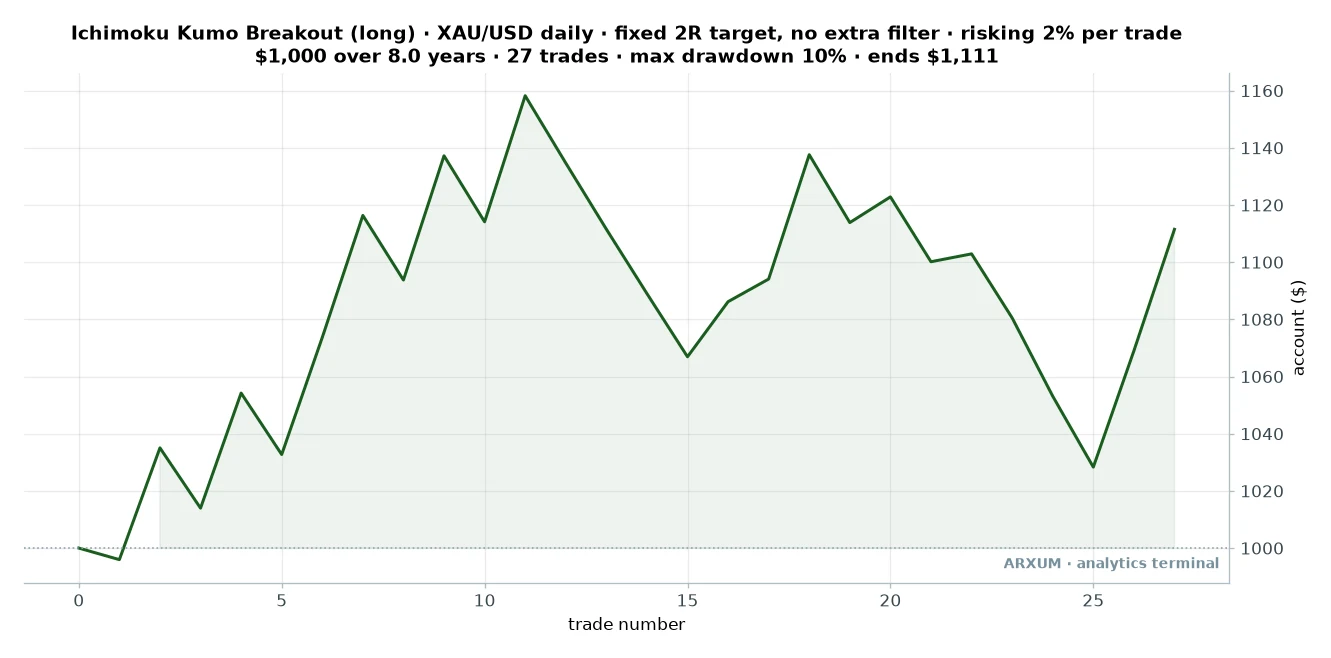
That curve is tamer than the TK cross. Fewer trades, a lower total return, but the shallowest drawdown of the three setups, which is the trade-off you are buying.
| Trades | 27 |
| Win rate | 48% |
| Reward-to-risk | 1:2.0 avg |
| Profit factor | 1.85 |
| Max drawdown | −10% |
| Avg hold | 16 days |
| Net return on $1,000 | +11% |
The win rate is under half, but the reward-to-risk holds a clean 1:2, so the winners more than cover the losers. This is the setup for a trader who hates deep drawdowns more than they love big totals.
Setup 3: full alignment
The third setup waits for every signal to agree before it commits. It is the conservative one.
The rules, on the daily chart:
- Price above the cloud.
- A TK cross.
- The Chikou above the price from twenty-six bars back.
- Stop below the Kijun, target twice the risk.
Because it demands all three at once, it takes about the same number of trades as the raw TK cross but screens out some of the marginal ones. On gold it posted the highest total return of the three.
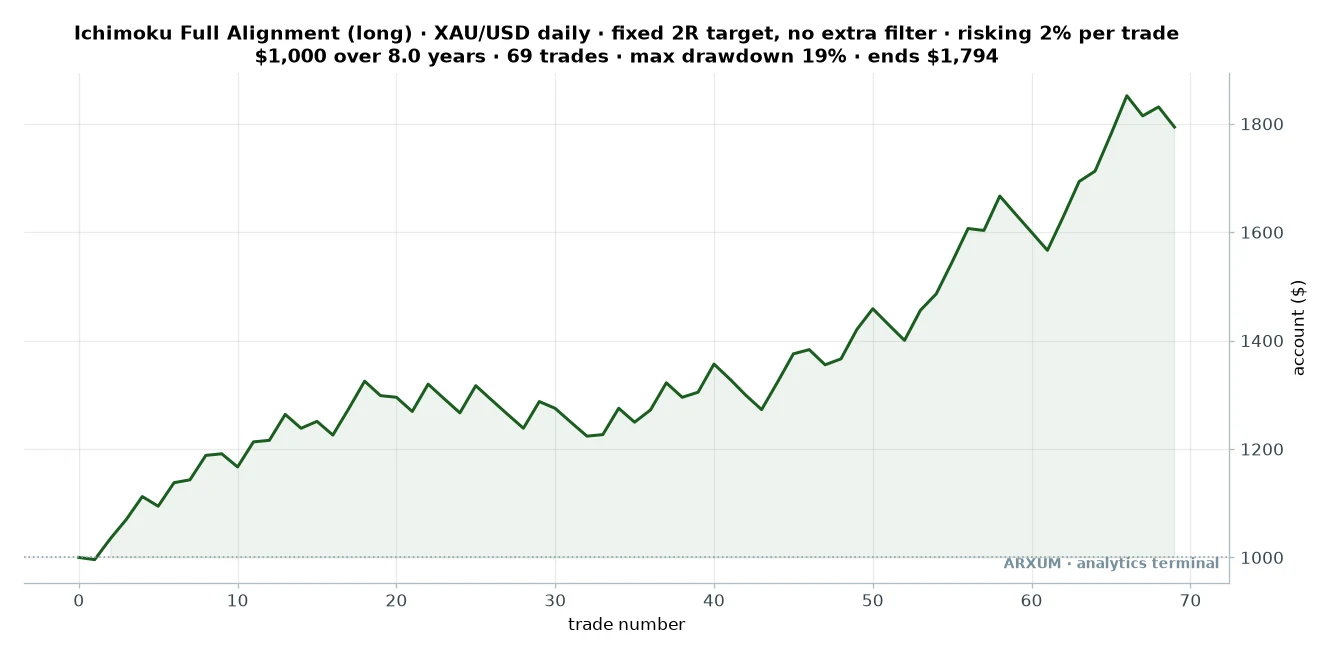
| Trades | 69 |
| Win rate | 57% |
| Reward-to-risk | 1:1.4 avg |
| Profit factor | 1.78 |
| Max drawdown | −19% |
| Avg hold | 21 days |
| Net return on $1,000 | +79% |
Here is the catch, and it matters. Full alignment carried the same 19% drawdown as the raw TK cross, so the extra Chikou filter bought total return, not a calmer ride.
If you want a smoother account, the calm-market ADX filter on the plain TK cross did far more for the drawdown than waiting for the Chikou did.
Rule of thumb: use full alignment when you want to be strict about entries, but do not expect it to shrink your worst stretch. Only the calm filter did that.
Does the edge hold up out of sample?
Any setup can look good if you fit it to the past. The real question is whether it survives on data it never saw, so we split the eight years in half and checked the newer half on its own.
- TK cross: profit factor 1.33 on the older half, then 2.49 on the newer half it had never touched. Stronger, not weaker, out of sample.
- Kumo breakout: 1.52 then 2.45. Held.
- Full alignment: 1.26 then 2.27. Held.
An edge that keeps working on unseen data is one you can trust. All three did, which is the opposite of a curve-fit.
One honest caveat on that clean result. The newer half also happened to trend harder, especially gold, so part of the jump is the market being kind, not the method getting smarter.
The point is only that the edge did not fall apart out of sample, not that it magically improved.
On drawdown, the raw setups took a 10% to 19% dip at their worst, and the calm-market filter pulled the TK cross down near 4.5%. Those are the real hills you have to be willing to sit through.
The honest gap is that this is a split-half check, not a full walk-forward across many rolling windows. It is strong evidence, not proof.
And the cross-market read from earlier does the rest of the stress-testing, since the same setups paid on gold, Bitcoin and, thinly, the euro, three very different markets.
One caveat on that. On gold and the euro, the volume a broker shows is tick volume, a count of price updates rather than real traded contracts, so it means less there than on a stock.
We leaned on price and ADX instead of volume for exactly that reason, so none of these setups depend on it.
How Ichimoku differs from a moving average
Plenty of traders try to rebuild Ichimoku with two exponential moving averages. Two lines, a crossover, same idea on the surface.
The cloud is the difference. Two moving averages give you a cross with no sense of the ground around it.
The cloud tells you whether that cross is happening in a trending market or a dead range, before you act.
When the cloud is flat and thin, Ichimoku is telling you the trend is weak even as the Tenkan and Kijun kiss. That is the exact condition where a plain moving-average cross fires a string of losers.
The cloud is the context that keeps you out.
The cloud edges also tend to line up with real support and resistance, and often with Fibonacci retracement levels, since the 26 and 52 settings sit near common Fib relationships. When a horizontal level and a cloud edge stack in the same spot, that zone is unusually sticky.
Which timeframe to trade
The defaults, 9, 26 and 52, were built by Goichi Hosoda for daily charts and published in 1969. They still fit the daily best.
| Timeframe | How to use it |
|---|---|
| Weekly | Direction only, too slow for entries |
| Daily | The primary chart, defaults work |
| 4-hour | More signals, needs more screen time |
| 1-hour | Usable but noisy, be selective |
| Under 15m | Skip it, signals form and vanish too fast |
The workflow that fits Ichimoku: read direction off the weekly cloud, take entries on the daily, and only trade in the direction the higher timeframe already supports. Below the 4-hour the signal count rises but the quality drops, and more signals is not more edge.
Common mistakes
- Trading signals inside the cloud. The cloud is a no-trend zone. A TK cross in there is a coin flip. Wait for price to clear the cloud first.
- Fighting the regime. Longs work in uptrends, shorts in downtrends. Our gold shorts lost badly for one reason: gold was climbing. Do not short a bull.
- Chasing an extended trend. The loss earlier fired at ADX 43, deep into a vertical run. The calm entries paid better. Buy the pause, not the spike.
- Waiting for all five lines every time. Full alignment is rare. Demanding it keeps you out of valid trades. The plain TK cross above the cloud is enough.
- Changing the 9/26/52 settings on a hunch. The defaults held up across three markets and both halves of the data. Do not optimise them to fit last month.
What this costs you, and the discipline it takes
None of these setups win most of the time in the way a beginner hopes. The TK cross wins 59%, the kumo breakout under half.
A run of five or six losses in a row is normal, not a sign the tool broke.
So a few habits, tied to these exact numbers.
- Risk the same 2% every trade. At a 48% to 59% win rate, streaks happen. Sizing up to win back a loss is how a normal drawdown becomes a blown account.
- Use a circuit-breaker. If you take five or six losses in a row, the market may have stopped trending. Pause for a week and check whether price is still above or below the cloud with room to move.
- Run a calm live-versus-data check. If your live results drift far below these figures over a meaningful number of trades, do not quit on one bad week, that is variance. But a sustained, wide gap is real. Step back and look at whether the market still trends.
No mechanical setup lasts forever. Ichimoku is a tool for trending markets, and when a market stops trending, the tool goes quiet with it.
Your job is to notice, and to risk only money you can afford to lose.
How to trade it, step by step
Here is the whole thing as a sequence, with a worked money example and the exact tools to load.
- Set direction. Open the weekly, note whether price is above (long only) or below (short only) the cloud.
- Find the signal on the daily. Wait for a TK cross above the cloud, or a clean close through the top of the cloud.
- Check the market is calm. Glance at ADX. Above 22 confirms a trend; in the forties, be wary of a late entry. Calmest is cleanest.
- Place the order. Buy at the market on the close of the signal candle. In the stop-loss field, enter the price just below the Kijun. In the take-profit field, enter a price twice your risk distance away.
- Manage it. Trail your stop up to the Kijun as the trend runs, and let the trade breathe until price closes back below it.
Those five steps are the same gold trade charted earlier: buy the close of the TK cross above the cloud, set the stop just below the Kijun near $4,257, and set the target twice that risk away at $4,996, a 1:2.
The money example, worked from the account down. Say you have $1,000 and risk 2%, so $20 per trade. Take the recent gold cross above: entry near $4,503, stop at $4,257.
Your risk per ounce is 4,503 minus 4,257, which is $246. Your position is your risk budget divided by that: $20 ÷ $246 = 0.08 of an ounce.
A lot is just the trade-size unit your broker uses. One micro lot of gold, the smallest most brokers allow, is a full ounce, and buying it here risks the whole $246, not the $20 you wanted.
So here is the honest part. At today’s gold prices, a proper 2% risk on the daily setup needs roughly a $3,000 account.
On a $1,000 account you have two clean options: use a broker that offers cent-sized gold, a lot far below one ounce, or run the identical setup on Bitcoin, where you can buy a small fraction of a coin and size the 2% exactly.
The same math on Bitcoin, the version a small account can place. Bitcoin trades in fractions of a coin, so no lot minimum gets in your way. Say Bitcoin is near $95,000, you get a TK cross above the cloud, and your stop under the Kijun sits at $91,000.
Your risk per coin is 95,000 minus 91,000, or $4,000. On the same $1,000 account risking 2%, that is $20 to spend, so your position is $20 ÷ $4,000 = 0.005 of a coin, which any crypto broker will fill.
Your target sits twice the risk away, near $103,000, for the same 1:2. That is one real trade a $1,000 account can actually open.
For the leverage question, the sizing above is what matters, not the broker’s headline number. Holding a fraction of an ounce on a small account is a tiny effective position.
A broker’s 1:100 leverage is just headroom on the deposit the broker sets aside, which lets you open the position. The 2% stop already caps your real risk, so the leverage figure changes nothing about how much you can lose on the trade.
Three ready configurations to lift straight off this page:
- Steady: gold, daily, TK cross above the cloud, ADX under 22, stop under the Kijun, target 1:2. The calm filter, the smoothest ride.
- Early: gold, daily, kumo breakout, Tenkan above Kijun, stop under the cloud, target 1:2. Catches new trends, shallow drawdown.
- Two-sided: Bitcoin, daily, TK cross with the cloud direction, long above and short below. The market that paid on both sides.
The exact tools to load. On TradingView, type the ticker, open the Indicators panel, and add Ichimoku Cloud, leaving the defaults at 9, 26, 52, 26. Add Average Directional Index (ADX) with length 14 for the calm read, and mind that it sits in its own panel under price.
On MT4 or MT5, go to Insert, then Indicators, then Trend, and choose Ichimoku Kinko Hyo; ADX lives under Insert, Indicators, Trend as well. You can chart and practice all of it free before risking a cent, and the risk-reward ratio guide covers the 1:2 target math if it is new.
Where to go from here
The Ichimoku Cloud is a trend engine, and it behaves like one. It paid on gold and Bitcoin because they trended, stalled on the ranging euro, and its shorts only worked where the market actually fell.
Match it to a trending market, trade with the cloud, favour the calm entries, and you have a setup with real numbers behind it.
If you want to sharpen the pieces it leans on, the ADX indicator guide covers the calm-market filter that did the most work here, and the average true range explainer is the other way to tell a quiet market from a violent one before you enter.
FAQ
What is the Ichimoku Cloud, in plain terms?
Does the Ichimoku Cloud actually work?
What is the best Ichimoku setup?
What is a TK cross in Ichimoku?
What do the Ichimoku Cloud colors mean?
What are the best Ichimoku Cloud settings?
Which markets does the Ichimoku Cloud work best on?
What timeframe is best for the Ichimoku Cloud?
Why does the TK cross work better in a calm market?
Can you short with the Ichimoku Cloud?
How much money do I need to trade the Ichimoku Cloud?
What are the key terms in this guide?
🌍 Our recommended brokers


Reader Reviews
Be the first to review this — tell other traders what actually helped, or where it fell short.
Leave a Review

Quant Researcher & Systems Builder
Quantitative researcher who builds the automated systems behind Arxum strategy testing. Works in Python and Pine Script, using AI alongside classic backtesting to validate strategies on years of real data.