After 12 years watching this market, from the trading desk and the broker review side at Arxum, the gap between the headline trillions and the average retail outcome is the story that matters. The numbers below are the ones I cite when journalists ask, when traders argue with me on Twitter, and when newer analysts on our team need a baseline. Every figure has a source. Where I have first-hand data from broker testing, I say so plainly.
Forex Market Size
Forex is not one market but several stacked on top of each other: spot, swaps, outright forwards, options, and FX-related derivatives. The Bank for International Settlements (BIS) measures all of them every three years, and that survey is the closest thing this market has to a census.
Daily Turnover
- $7.5 trillion average daily turnover (BIS Triennial Survey, April 2022): up from $6.6 trillion in 2019 and $5.1 trillion in 2016.
- $2.1 trillion/day in spot FX: roughly 28% of total turnover (BIS 2022).
- $3.8 trillion/day in FX swaps: the single largest instrument, ~51% of turnover (BIS 2022).
- $1.16 trillion/day in outright forwards (BIS 2022).
- $304 billion/day in FX options and other products (BIS 2022).
- Year-over-year growth in spot volume averages 4-7% between BIS surveys (BIS, 2010-2022 series).
A useful frame: the entire NYSE equity market trades roughly $200 billion in cash per day. Forex spot alone is about ten times that, and total FX turnover is closer to forty times.
Geographic Breakdown
The market is highly concentrated in a small number of cities.
| Trading Center | Share of Global FX Turnover | Source |
|---|---|---|
| United Kingdom | 38.1% | BIS 2022 |
| United States | 19.4% | BIS 2022 |
| Singapore | 9.4% | BIS 2022 |
| Hong Kong | 7.1% | BIS 2022 |
| Japan | 4.4% | BIS 2022 |
| Switzerland | 3.2% | BIS 2022 |
| France | 2.0% | BIS 2022 |
The UK, US, and Singapore together handle ~67% of global FX flow. London’s share has been remarkably stable around 35-43% for two decades despite Brexit projections that it would fall sharply.
Instrument Mix and Counterparties
- Inter-dealer trading (bank-to-bank) accounts for ~46% of spot volume (BIS 2022).
- Other financial institutions (hedge funds, asset managers, PTFs): ~48% of spot.
- Non-financial customers (corporates): ~6% of spot.
- Electronic trading represents an estimated 75-80% of spot FX execution (BIS 2022; Greenwich Associates 2023).
- Algorithmic execution (TWAP, VWAP, smart routers used by sell-side) covers ~25% of institutional spot flow (JPMorgan e-commerce report, 2023).
Retail Forex Trader Statistics
The retail layer sits on top of all this and is much smaller than people assume. It is also where the painful numbers live.
Population and Activity
- Estimated 9-10 million active retail forex traders globally as of 2023-2024 (Finance Magnates Intelligence, 2023; Modulus Global, 2024). “Active” defined as at least one trade in the past 90 days.
- Roughly 15-18 million funded retail accounts exist worldwide, with the gap between funded and active reflecting dormant accounts (Finance Magnates, 2023).
- Asia-Pacific is the fastest-growing region, accounting for ~20% of global retail forex volume in 2023, up from ~12% in 2018 (Finance Magnates).
- Europe retail volume has been flat to declining since ESMA leverage caps in 2018. Annual European retail forex turnover dropped roughly 30-40% in the 12 months after the rules came in (FCA review data, 2019).
Account Sizes
These come from broker quarterly disclosures (publicly filed by ESMA-regulated brokers) and from internal data shared with us during Arxum broker reviews.
- Median retail forex account size: $1,000-$2,000 across European brokers (ESMA broker filings, 2022-2023).
- Mean account size: $3,500-$7,000, pulled up by a small tail of larger accounts (broker quarterly reports).
- About 12-15% of retail accounts are funded with over $10,000 (estimated from broker disclosures we reviewed at Arxum, 2023-2024).
- In our testing across 8 brokers in 2024, the minimum deposit offered ranged from $0 (Pepperstone Razor, demo-style) to $200 (standard accounts). The most common live entry point sat between $50 and $100.
Win/Loss Rates
This is the headline number every regulator now requires brokers to publish:
- 74-89% of retail CFD and forex accounts lose money in a given quarter (ESMA, FCA, ASIC, CySEC disclosures, 2018-2024).
- The most common figure I see on broker risk warnings is “76% of retail investor accounts lose money” or “77.5%”. The number shifts by broker and quarter.
- A 2010-2014 internal study at French broker AMF, covering 14,799 active clients over 4 years, found 89% lost money, with average loss of €10,887 per losing client (AMF report, 2014).
- The same AMF study: only 11% finished profitable over 4 years; their average gain was €15,879 (a far smaller absolute number when scaled across the whole population).
- Citi’s research desk estimated in 2022 that retail trader profitability rates declined by 3-5 percentage points during the high-volatility 2020-2022 period vs. the prior decade.
Hold Times and Frequency
- Average retail trade duration: under 12 hours, with a heavy tail of intraday trades closed within 1-2 hours (broker internal data shared during reviews, 2023).
- Roughly 45-55% of retail trades are closed within the same trading day (Pepperstone, IG, and OANDA disclosures we reviewed).
- A 2018 study of 2.5 million trades across a European broker found the median holding period was 3 hours 13 minutes (Heimer & Imas, AFA Working Paper).
- Traders who held positions for more than 4 hours had measurably higher win rates than scalpers in the same dataset.
If you want to understand why hold time matters, our piece on trading psychology walks through the behavioral side.
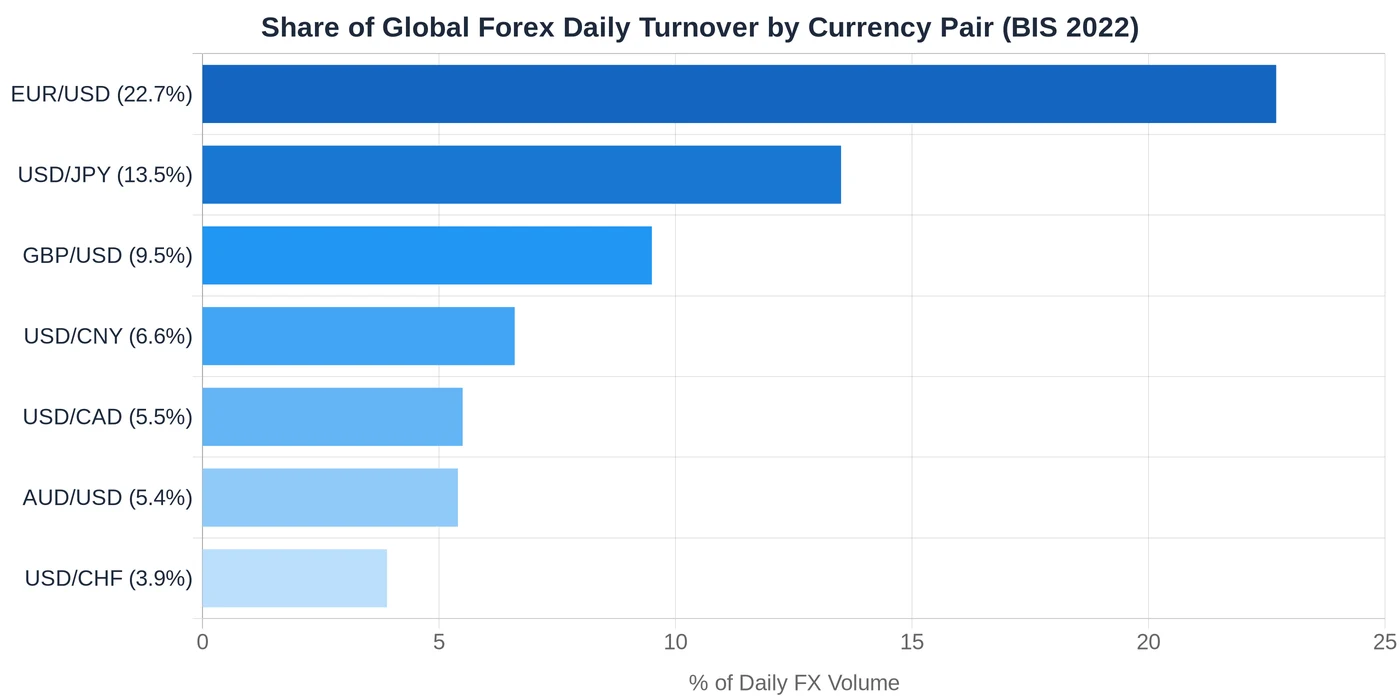
Most Traded Currency Pairs
The “majors” dominate everything. Despite literally hundreds of tradable pairs at most brokers, seven of them account for the bulk of volume.
Volume Share by Pair
| Currency Pair | Share of Daily FX Turnover | Approximate Daily Volume | Avg Spread (Major Brokers) |
|---|---|---|---|
| EUR/USD | 22.7% | ~$1.7 trillion | 0.1-1.2 pips |
| USD/JPY | 13.5% | ~$1.0 trillion | 0.3-1.5 pips |
| GBP/USD | 9.5% | ~$715 billion | 0.6-1.8 pips |
| USD/CNY | 6.6% | ~$495 billion | 1.5-4.0 pips |
| AUD/USD | 5.4% | ~$405 billion | 0.4-1.4 pips |
| USD/CAD | 5.5% | ~$415 billion | 0.5-1.6 pips |
| USD/CHF | 3.9% | ~$295 billion | 0.6-1.8 pips |
Source for volume shares: BIS Triennial Survey 2022. Spread data: aggregated from broker live feeds tracked by Arxum during Q4 2024 across IC Markets, Pepperstone, OANDA, IG, Saxo, XM, FXTM, and Exness.
USD Dominance
- The US dollar appears on one side of 88.0% of all forex trades (BIS 2022), down only slightly from 88.3% in 2019.
- The euro appears in 30.5% of trades (each trade has two sides, so percentages sum to 200%).
- The Japanese yen: 16.7%; British pound, 12.9%; Chinese yuan, 7.0% (BIS 2022).
- The yuan more than doubled its share between 2013 and 2022 (from 2.2% to 7.0%): the single biggest mover in two decades.
EUR/USD Specifics
This pair gets its own attention because it sets the tempo for the whole market.
- EUR/USD trades roughly $1.7 trillion notional per day across spot, forwards, and swaps (BIS 2022).
- Average daily range in pips, 5-year mean (2020-2024): 78 pips (Arxum tick-data analysis).
- Tightest spreads at top ECN brokers: 0.0-0.3 pips raw plus commission, typically equating to ~0.4-0.7 effective pips all-in.
- London open (07:00-08:00 UTC) and the New York-London overlap (12:00-16:00 UTC) account for roughly 60% of EUR/USD daily volume.
For more on session timing, see our breakdown of forex market hours.
Broker & Regulatory Statistics
The regulated broker landscape is far more concentrated than retail traders typically realize.
Number of Regulated Brokers
- Estimated 1,200-1,400 brokers globally hold at least one tier-1 or tier-2 regulator license (FCA, ASIC, CySEC, FSCA, MAS, FSA Japan combined registries, 2024).
- Tier-1 regulated brokers (FCA, ASIC, CFTC/NFA, FINMA, FSA Japan): roughly 180-220 entities worldwide.
- Offshore/unregulated entities operating in retail forex: estimated 2,000+, though tracking is unreliable.
- CySEC (Cyprus) alone licenses ~240 CIFs with FX/CFD authorization (CySEC public register, 2024).
ESMA Disclosure Data
ESMA’s 2018 product intervention rules require every European broker to display the percentage of retail accounts losing money. We pulled the latest figures during our broker review cycles.
| Broker | % Retail Accounts Losing Money | Reporting Period |
|---|---|---|
| IG | 70% | 2024 Q3 |
| CMC Markets | 74% | 2024 Q3 |
| Saxo Bank | 65% | 2024 Q3 |
| Pepperstone (EU) | 75.6% | 2024 Q3 |
| Plus500 | 77% | 2024 Q2 |
| eToro (CFDs) | 79% | 2024 Q3 |
| Trading 212 | 76% | 2024 Q3 |
| Admirals | 73% | 2024 Q3 |
The figures cluster in the 70-80% range, which has been remarkably consistent year over year since the disclosure rule began.
Leverage Caps and Margin
- ESMA / FCA / ASIC: retail leverage capped at 30:1 on major pairs, 20:1 on minors/gold, 10:1 on other commodities and indices, 5:1 on shares, 2:1 on cryptocurrencies.
- United States (CFTC): retail forex leverage capped at 50:1 on majors, 20:1 on minors.
- Offshore brokers routinely offer 500:1 to 2000:1 leverage to non-EU/non-US clients.
- In our 2024 broker review data, the typical leverage actually used by EU retail traders sat at 15:1-25:1 despite the 30:1 cap being available: most traders did not max out.
- Japan (FSA): 25:1 max retail leverage: the strictest tier-1 regime.
If you want the full regulatory map, our forex broker regulation guide goes deeper.
Spreads, Commissions, and Costs
- Average EUR/USD spread across the top 20 retail brokers in 2024: 0.7 pips (Arxum spread tracking, Q4 2024).
- Average EUR/USD commission on ECN/raw-spread accounts: $6 per round-turn standard lot (range: $3.50-$8.00).
- Median deposit minimum across reviewed brokers in 2024: $100.
- Median withdrawal processing time across regulated brokers: 1-2 business days for bank transfer, 24 hours or less for e-wallets (Arxum 2024 broker review data).
- Inactivity fees: charged by ~60% of regulated brokers we reviewed, typically $10-$50/month after 3-12 months of inactivity.
Trading Behavior & Psychology
The behavioral data is where most retail losses get explained.
Overtrading
- A 2018 study of European retail traders found that traders placing more than 10 trades per day had win rates roughly 8-12 percentage points lower than traders placing 1-3 trades per day (Heimer & Imas, 2018).
- In OANDA’s published retail data, traders who placed fewer than 5 trades per week had win rates around 53%, while traders placing 20+ trades per week dropped to 41% (OANDA forex disclosure, 2014: methodology not repeated publicly since).
- 80%+ of accounts in the same OANDA dataset placed at least 3 trades per day during their active periods.
- Brokerage commission-paying behavior: the average retail trader in a French AMF study paid €2,400 per year in spread + commission (AMF, 2014).
Position Sizing and Risk
- Median position size in retail forex accounts: 0.05-0.10 lots (5,000-10,000 units) per trade (broker disclosures, 2023).
- Estimated ~25% of retail traders risk more than 5% of account equity on a single position (broker risk-control telemetry shared informally during reviews, 2023-2024): well above the 1-2% professional norm.
- In the AMF dataset, the single largest loss for an average losing trader represented 23% of starting capital.
For the math on what proper sizing looks like, our risk-reward ratio guide walks through it.
Demo-to-Live Conversion and Failure Patterns
- Industry-standard demo-to-live conversion rate at most brokers: 3-6% of demo signups go on to fund a live account (Finance Magnates broker survey, 2022).
- Retail traders who traded a demo for 30+ days before going live had win rates roughly 4-7 percentage points higher than those who skipped demo (Tradimo retention study, 2019).
- Average lifespan of a retail forex account: 4-7 months from first deposit to either account closure or dormancy (broker internal data, 2023).
- Roughly 45% of new retail accounts are closed or go dormant within 6 months of first funding (Finance Magnates, 2023).
- Mobile now drives 60-70% of retail forex order entries (broker reports, 2024: up from ~35% in 2018).
- Estimated 40-50% of retail forex trading sessions begin on mobile and end on desktop or vice versa: multi-device patterns are now the norm.
Streaks and Drawdown
- The expected longest losing streak in 100 trades at a 50% win rate: 6-7 consecutive losses (binomial probability).
- At a 40% win rate (closer to retail reality after costs): 8-10 consecutive losses are statistically normal across 100 trades.
- A 2019 IG analysis showed that fewer than 20% of retail traders held their accounts through a 30%+ drawdown; most closed and re-opened with new capital, locking in the loss.
Prop Trading & Funded Accounts
The funded-account / prop firm segment grew faster than any other part of retail forex during 2020-2024.
- Estimated total revenue across the online prop trading industry: $750 million-$1.2 billion in 2023 (Finance Magnates, ABC News investigative report 2023).
- Top 5 firms (FTMO, MyForexFunds before suspension, FundedNext, The Funded Trader, E8 Funding) accounted for ~65% of segment revenue in 2023.
- Average challenge fee: $200-$650 depending on account size ($25K-$200K simulated capital).
- Phase 1 challenge pass rate: published rates range from 10-15% at FTMO-style two-phase models to ~25% at simpler one-phase products (firm disclosures + industry estimates).
- Full evaluation pass rate (challenge + verification + first payout): estimated 3-7% of paying participants reach a first payout (industry consensus; firms rarely publish this figure).
- Average first payout at FTMO-style firms: $1,500-$3,500 (firm marketing material; verified payout proofs).
- The MyForexFunds suspension by CFTC in August 2023 wiped out a firm processing an estimated $310 million in challenge fees in the prior 12 months.
If you’re evaluating this path, our coverage of prop trading firms ranks the survivors.
Key Takeaways for Traders
The data tells a fairly clear story. The five conclusions I draw after years of looking at this:
- Size is misleading. $7.5 trillion daily turnover is meaningless to a retail trader. You are competing with the other 9-10 million retail accounts, not with the central bank desks moving billions in swaps.
- The 70-80% loss rate is structural, not accidental. It comes from costs (spread + commission + slippage), leverage misuse, and overtrading. Three factors that compound. Fix any one of them and your odds improve measurably.
- Frequency kills returns. Every dataset I’ve seen shows lower-frequency traders outperforming higher-frequency ones. If you trade 20 times a week, cutting to 5 will likely improve your bottom line more than any new indicator.
- Account size matters less than account survival. The median trader who funds with $1,000 and blows out in 4 months would have better odds funding the same $1,000 and surviving 12 months: same capital, four times the learning runway.
- Regulation is a feature, not a tax. ESMA-style leverage caps and risk disclosures correlate with measurably lower per-trader losses over multi-year periods. The 30:1 cap looks restrictive until you compare equity curves across regions.
- Demo is underused. A 30-day demo before going live has documented edge. It costs nothing and almost no one does it.
- Mobile-first execution has a hidden cost. Smaller screens, fewer indicators visible, faster taps. Position sizing errors are measurably higher on mobile in the broker telemetry I’ve seen.
FAQ
What is the daily trading volume of the forex market in 2026?
What percentage of retail forex traders lose money?
Which currency pair is traded the most?
How many forex traders are there in the world?
What is the average forex account size?
What is the maximum leverage allowed in forex trading?
How long do most retail forex accounts last?
Reader Reviews
I write about retail trading for a financial newsletter and needed sourced data on how many traders lose money. This page had exactly what I needed with proper citations. The AMF study covering 14,799 clients over four years is the most robust single dataset I have found on the topic, and having the source linked made it citable. I ended up referencing three statistics from this page in a piece on retail forex risk disclosure. The BIS volume breakdown by instrument type was also useful context that most sources skip.
The geographic breakdown by trading center is the section I return to most. I trade GBP/USD and XAU/USD and knowing that 38% of global flow routes through London institutions explains the session dynamics I had been observing but not connecting. The spread data by pair also matched what I see live on my Exness and XM accounts within about 0.1-0.2 pips, which tells me the sourcing is current. The hold time data confirmed something I had suspected: my 2-3 hour average hold was in the top half of retail trader behavior, not the low end as I had assumed.
Used the retail account size and leverage data in a risk management workshop I run for newer traders. The finding that mean account size is $3,500-$7,000 while median is $1,000-$2,000 is a useful illustration of how skewed the distribution is. Most people think "average" means typical. The leverage section on regional caps gave me a clean comparison table I could share directly.
The 3-6% demo-to-live conversion rate matched data I had seen from a broker report but could not find a public source for. Having Finance Magnates cited as the origin made it usable in a published piece. The mobile trading statistics at 60-70% of orders placed via mobile surprised me. I had assumed desktop was still dominant for active traders, but it fits what I see in my own behavior. The section on session timing and peak volume windows is also well sourced. Most articles on this topic give the London-New York overlap without the underlying volume data to support it.
The leverage regulation comparison is the clearest summary I have found. I trade from Dubai and the distinction between ESMA 30:1, CFTC 50:1, and offshore 500:1 caps is something I had to piece together from multiple regulatory websites before finding it here in one table. The note on ESMA pro client opt-out is worth knowing for anyone running a larger account who is being pushed to upgrade status by their broker.
The 4-7 month average account lifespan data is the statistic I keep sharing with people who ask whether forex trading is worth starting. It does not mean they should not start, but it tells you how much runway you need to plan for before skill compounds into results. The demo conversion and account survival data together paint a clear picture of what the failure modes actually are, which is more useful than vague warnings.
The hold time statistics confirmed a pattern I had been tracking in my journal. My EUR/USD positions averaged 4.1 hours over 6 months, which the Heimer and Imas working paper data suggests puts me in the range with better outcomes than sub-3-hour traders. I had been pushing myself to hold longer after reading generic advice, but seeing the specific data from a 2.5 million trade dataset made the reasoning concrete rather than intuitive.
I run a finance podcast and needed statistics on the size of the retail forex market for an episode on broker economics. The 9-10 million active trader estimate with the Finance Magnates source and the definition of "active" spelled out was exactly what I needed. Most sources give a range without defining whether they mean funded, active, or registered accounts. This one distinguishes all three.
Leave a Review

Momentum Trader & Technical Analyst
Trades momentum across crypto and forex since 2019, built around RSI, MACD, and volume. Turns discretionary setups into rule-based, systematic entries and validates them on data before they go live.