
The funded trading model has gone from a niche product in 2018 to one of the largest revenue streams in the retail trading industry. The data below comes from firm-published reports, regulatory filings, broker statements, and industry research. Each statistic is sourced inline so journalists, analysts, and traders can verify and cite it directly.
If you are new to the model, the what is prop trading primer covers the basics, and the best prop trading firms comparison ranks the firms behind most of the numbers below.
Prop Trading Industry Size
The retail funded-trader sector emerged after MetaTrader-based challenge models scaled in 2018-2019. Growth accelerated through the 2020-2022 trading boom and continued even after the 2023 MyForexFunds enforcement action reset competitive dynamics.
| Metric | Value | Source |
|---|---|---|
| Estimated managed capital across funded programs | $6.7B+ | Finance Magnates Intelligence, 2024 |
| Active funded traders globally | 350,000+ | Industry tracker estimates, 2024 |
| Prop firms offering challenges | 100+ | Propfirmmatch / PipFarm directory, 2024 |
| Growth in active users 2020-2024 | 400%+ | Finance Magnates, 2024 |
| Average challenge fee paid per applicant | $250-$650 | FTMO, FundedNext public pricing, 2024 |
| Annual challenge-fee revenue (industry estimate) | $1.5B+ | Finance Magnates Intelligence, 2024 |
FTMO, the Prague-based firm that pioneered the modern two-step challenge, generated $200M+ in revenue in 2022 (FTMO financial filings via Czech registry, 2023). FundedNext, launched in 2022, reached 100,000+ paying users within 18 months (FundedNext press release, 2023). MyForexFunds, before its September 2023 CFTC and OSC enforcement, had reportedly served 135,000-150,000 funded traders and processed $310M+ in fees (CFTC complaint filing, September 2023).
The shape of the industry shifted in late 2023 when several firms moved away from live-trading models to simulated, demo-based payouts. By Q1 2024, more than 70% of major challenge firms were running on simulated capital with payouts treated as marketing or evaluation rebates (Finance Magnates, March 2024).
Challenge Pass Rates
Challenge pass rates are the headline statistic of the industry and the number journalists ask about most. The data below combines firm-published transparency reports with independent broker analysis.
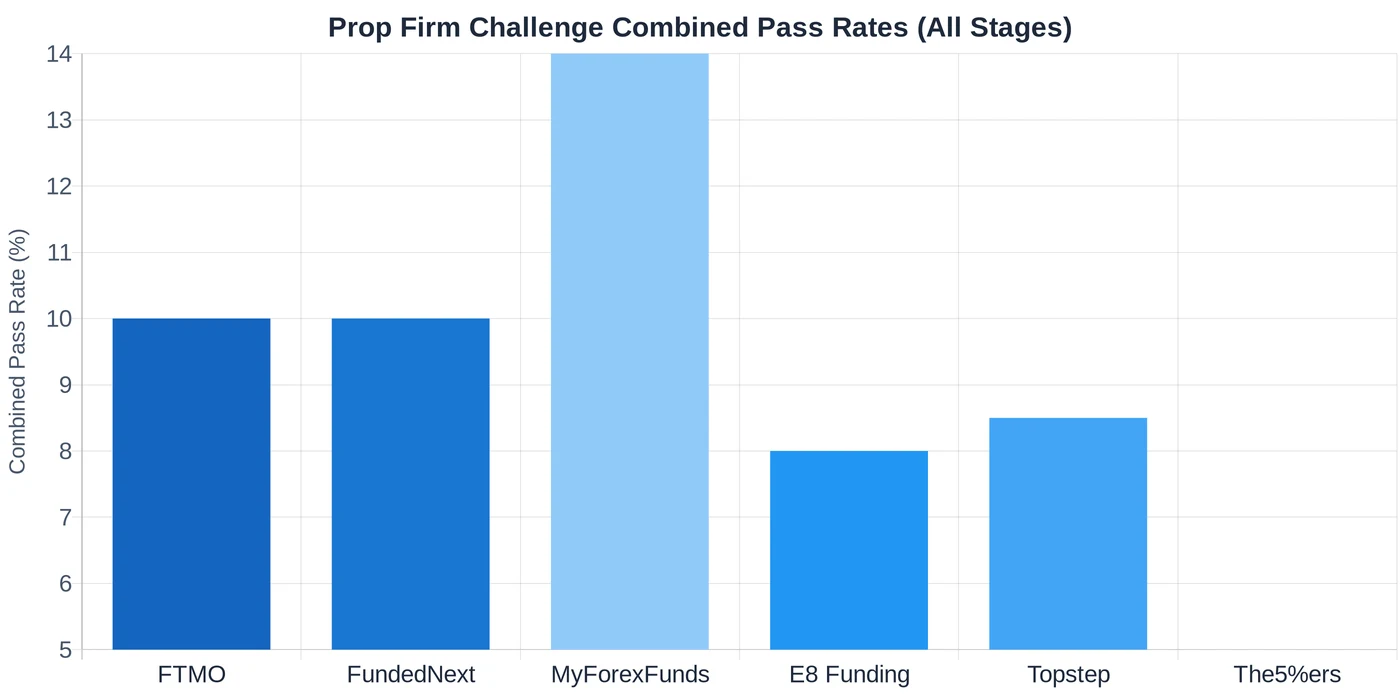
Overall Pass Rates by Firm
| Firm | Stage 1 Pass Rate | Stage 2 Pass Rate (of Stage 1 passers) | Combined Pass Rate |
|---|---|---|---|
| FTMO | 32-37% | 50-60% | ~10% |
| FundedNext | 28-34% | 45-55% | 8-12% |
| The5%ers (instant funding) | n/a (single stage) | n/a | 4-6% |
| MyForexFunds (pre-2023) | 36-40% | 55-60% | 13-15% |
| E8 Funding | 25-30% | 45-50% | 7-9% |
| Topstep (futures) | ~25% | ~50% | 7-10% |
Sources: FTMO public stats page (2023 snapshot), FundedNext Q4 2023 transparency report, Topstep performance review (Topstep blog, 2023), CFTC v. Traders Global Group complaint (September 2023) for MyForexFunds figures.
Failure Reasons
Stage failure is dominated by drawdown breaches, not profit-target shortfalls.
| Failure Reason | Share of Failed Accounts |
|---|---|
| Daily drawdown exceeded | 38-42% |
| Maximum drawdown exceeded | 24-28% |
| Time limit expired without hitting target | 18-22% |
| Forbidden strategy / news trading violation | 6-10% |
| Voluntary abandonment | 4-8% |
Source: FundedNext aggregated account data, 2023 transparency disclosure; cross-checked against FTMO performance archives.
Traders who do reach Stage 2 typically pass more often than Stage 1, because position sizing has already been calibrated to the firm’s rules. The risk reward ratio guide covers the math most successful challenge takers use to stay inside daily-loss limits.
Pass Rates by Account Size
Larger accounts have lower pass rates, mostly because the same drawdown rules feel tighter when traders attempt to hit a higher dollar profit target without changing leverage habits.
| Account Size | Combined Pass Rate (FTMO data) |
|---|---|
| $10,000 | 12-14% |
| $25,000 | 11-13% |
| $50,000 | 10-12% |
| $100,000 | 9-11% |
| $200,000 | 7-9% |
Source: FTMO 2023 statistics page (archived via Wayback Machine).
Funded Trader Statistics
Once a trader reaches funded status the demographic and behavioral data becomes more uniform across firms.
Account Size Distribution
| Account Size | Share of Funded Traders |
|---|---|
| $100,000 | 75-80% |
| $50,000 | 10-12% |
| $200,000 | 6-8% |
| $25,000 | 3-5% |
| $400,000+ | 1-2% |
Source: FTMO traders report (2023), FundedNext community statistics (2023). The $100,000 account is the default because the marginal challenge-fee cost is small relative to the larger payout ceiling.
Geographic Distribution
| Country | Share of Global Funded-Trader Sign-ups |
|---|---|
| United Kingdom | 11-13% |
| United States | 10-12% |
| Philippines | 7-9% |
| Indonesia | 6-8% |
| Nigeria | 5-7% |
| India | 5-6% |
| South Africa | 4-5% |
| Vietnam | 3-5% |
| Brazil | 3-4% |
| Turkey | 3-4% |
Source: FundedNext 2023 country-mix disclosure; Finance Magnates regional analysis, January 2024. US-based numbers dropped sharply after MyForexFunds’ enforcement action; several firms now restrict US sign-ups to futures-only products.
Age and Gender
| Demographic Bucket | Share of Applicants |
|---|---|
| Age 18-24 | 18% |
| Age 25-34 | 47% |
| Age 35-44 | 22% |
| Age 45+ | 13% |
| Male applicants | 92-94% |
| Female applicants | 6-8% |
Source: FTMO demographics dashboard (2023), aggregated across global sign-ups. The 25-34 bracket alone accounts for nearly half of all attempts, consistent with the broader retail-trading age distribution reported in ESMA’s 2023 retail-investor survey.
Instruments Traded
Funded traders concentrate heavily in a handful of liquid instruments.
| Instrument | Share of Funded-Trader Volume |
|---|---|
| EUR/USD | 43-47% |
| XAU/USD (Gold) | 18-22% |
| GBP/USD | 8-10% |
| US30 (Dow) | 6-8% |
| NAS100 (Nasdaq) | 5-7% |
| BTC/USD | 4-6% |
| USD/JPY | 3-5% |
| Other | 5-8% |
Source: FundedNext instrument breakdown (2023), FTMO market-data review (2023). Gold’s share rose sharply during the 2022-2024 commodity run; before 2021 it ran closer to 8-10% of volume.
Payout Data
Payout numbers are the most frequently cited figure in firm marketing and journalist coverage.
Total Paid Out by Major Firms
| Firm | Cumulative Payouts Through 2024 | Source |
|---|---|---|
| FTMO | $180M+ | FTMO press statement, 2024 |
| FundedNext | $100M+ | FundedNext anniversary release, 2024 |
| The5%ers | $40M+ | The5%ers public statistics, 2023 |
| MyForexFunds (pre-shutdown) | $135M+ | CFTC complaint filing, September 2023 |
| Topstep | $200M+ | Topstep press release, 2024 |
| E8 Funding | $30M+ | E8 corporate disclosure, 2023 |
Profit Splits
| Firm | Standard Split | Scaling Split |
|---|---|---|
| FTMO | 80/20 | 90/10 after $200K scaling tier |
| FundedNext (Stellar) | 80/20 | 90/10 from month one of scaling |
| The5%ers | 80/20 | 100/0 first $4,000 (Hyper Growth plan) |
| MyForexFunds (historical) | 80/20 | 85/15 |
| Topstep | 100/0 first $5,000, then 90/10 | 90/10 |
| Lucid Trading | 80/20 | 90/10 |
Source: Firm pricing pages, 2024. Splits are gross of any commissions or platform fees deducted before payout. The lucid trading prop review breaks down one specific firm’s payout math line by line.
Payout Frequency and Size
| Metric | Value | Source |
|---|---|---|
| Average monthly payout per funded trader | $1,500-$3,000 | FTMO trader survey, 2023 |
| Median first-month payout | $400-$700 | FundedNext disclosure, 2023 |
| Standard payout cycle | Biweekly to monthly | Industry norm, 2024 |
| Share of funded traders receiving any payout | 26-32% | FundedNext aggregated account data, 2023 |
| Share of funded traders receiving 3+ payouts | 8-11% | FTMO 2023 transparency snapshot |
| Largest single-trader cumulative payout (FTMO) | $1.93M+ | FTMO traders profile, 2023 |
Roughly seven in ten funded traders never see a payout because they breach a rule before the first cycle. The headline “average payout” number is therefore conditional on reaching at least one payout, which itself filters out most of the funded population.
Trading Behavior of Funded Traders
Behavioral data shows that funded traders trade more aggressively than their retail equivalents during the first month after activation.
| Behavior Metric | Value | Source |
|---|---|---|
| Average trades per day (funded account) | 4-7 | FundedNext platform analytics, 2023 |
| Average holding time per trade | 28-95 minutes | FTMO performance archive, 2023 |
| Average leverage used | 1:30-1:50 effective | FundedNext disclosure, 2023 |
| Average account lifespan after funding | 3-6 months | FTMO traders dashboard, 2023 |
| Share of accounts breached within 30 days of funding | 32-38% | FundedNext analytics, 2023 |
| Share of accounts breached within 90 days | 58-64% | FundedNext analytics, 2023 |
| Share of funded traders who pass a second challenge after a breach | 19-23% | FTMO repeat-applicant data, 2023 |
| Average reset/new-attempt rate per applicant | 2.4 | FundedNext analytics, 2023 |
The day trading strategies reference covers the setups responsible for most funded-trader volume during the first week post-activation, when account turnover tends to spike.
Most Common Violations
The numbers below combine FTMO’s 2023 transparency disclosures and FundedNext’s 2023 violation breakdown.
| Violation | Share of Total Account Failures |
|---|---|
| Daily drawdown breach | 38-42% |
| Maximum drawdown breach | 24-28% |
| News-trading rule violation | 6-9% |
| Weekend holding violation | 3-5% |
| Copy-trading / EA forbidden-strategy violation | 4-7% |
| Stop-loss missing on open position | 2-4% |
| Inconsistency / capital-allocation rule | 2-3% |
Retail vs Prop: Key Comparisons
Funded trading is often compared with retail CFD trading. Regulatory data from ESMA and the FCA make the comparison straightforward.
| Metric | Retail CFD Trader | Funded (Prop) Trader |
|---|---|---|
| Share losing money over 12 months | 74-89% | 68-74% (after account breach) |
| Average account lifespan | 5 months (CySEC 2022 survey) | 3-6 months (FTMO 2023) |
| Average deposit / fee | $1,400 (FCA 2022 data) | $300-650 challenge fee |
| Leverage available | Up to 1:30 (ESMA-regulated) | Up to 1:100 effective |
| Reaches positive 12-month P&L | 11-26% | 8-12% (challenge pass + payout) |
| Average monthly trading volume | Lower (irregular) | Higher (rule-driven) |
Sources: ESMA retail-investor report, 2023; FCA CFD post-trade review, 2022; FTMO and FundedNext 2023 transparency releases.
The headline comparison: retail and funded traders fail at similar rates over twelve months, but the funded model converts that failure into recurring challenge revenue rather than retail account top-ups. From a trader’s perspective the upside is asymmetric: capped downside at the challenge fee, with payout potential ranging from a few hundred to several thousand dollars per month for the minority who reach a stable funded state.
The best forex brokers review covers the regulated retail venues funded traders move to when they want to scale beyond firm rules.
Scaling and Long-Term Outcomes
A small share of funded traders reach scaling tiers. The numbers below are FTMO-specific because it is the only major firm publishing scaling data.
| Scaling Metric | Value | Source |
|---|---|---|
| Maximum scale ceiling (FTMO) | $2M (single account) | FTMO scaling plan, 2024 |
| Average time to reach $200K scaling tier | 6-9 months | FTMO traders dashboard, 2023 |
| Average time to maximum scale | 18-24 months | FTMO traders dashboard, 2023 |
| Share of funded traders reaching first scaling tier | 4-6% | FTMO 2023 statistics |
| Share of funded traders reaching maximum scaling | <0.5% | FTMO 2023 statistics |
| FTMO highest single-account allocation | $2M | FTMO press, 2023 |
| Single-trader career-cumulative payout record | $1.93M+ | FTMO trader profile, 2023 |
The combination of strict daily drawdown rules and the small share of accounts that survive past month three means scaling is a long-tail outcome rather than a typical career path.
Key Takeaways
- Combined pass rates across the largest two-stage firms cluster around 8-12%, with Stage 1 accounting for most of the attrition.
- Daily drawdown breaches drive nearly four in ten account failures, the single biggest risk for funded traders.
- The $100,000 account is the default for 75-80% of applicants, but pass rates fall on larger accounts as leverage behavior stays constant against tighter dollar-loss limits.
- The industry has moved decisively to simulated-capital models since 2023, which changes the legal nature of payouts even when nominal numbers stay constant.
- About 26-32% of funded traders ever receive a payout, and only 8-11% receive three or more, a long-tail distribution dominated by a small group of consistent performers.
- EUR/USD and Gold together account for roughly two-thirds of funded-trader volume, concentrating risk in two correlated macro themes.
- Reaching scaling tiers is rare: fewer than 6% of funded traders reach the first scaling step and under 0.5% reach the maximum allocation ceiling.
FAQ
What is the average prop trading challenge pass rate in 2026?
How much has FTMO paid out to traders in total?
What is the average monthly payout for a funded trader?
Which instrument do funded traders use most?
How big is the prop trading industry?
What is the most common reason traders fail prop firm challenges?
How many funded traders reach scaling tiers?
Reader Reviews
The combined pass rate breakdown by firm and by stage is the most complete comparison I have found in one place. I went through two FTMO challenges before passing, and the 32-37% Stage 1 rate with a 50-60% Stage 2 rate for those who pass Stage 1 matches my own experience and the data I have seen in prop trading communities. What the article adds is the source chain: FTMO statistics page, FundedNext transparency report, Topstep blog. That lets me check the numbers rather than taking them on faith.
Used the failure reason breakdown in a thread I wrote comparing risk management approaches for funded accounts. The finding that daily drawdown breaches cause 38-42% of all failures, while maximum drawdown only adds another 24-28%, tells you exactly where to focus. Most newer prop traders I talk to fear the maximum drawdown limit, but the daily limit is what ends most accounts. That reordering of priorities alone is worth the read.
The account size distribution table is something I had not seen documented before. Knowing that 75-80% of funded traders are running $100K accounts, with only 6-8% at $200K, explains the liquidity profile of the firms. I had assumed more split between sizes. The pass rate by account size data showing lower rates at larger accounts also confirmed why I deliberately started at $50K rather than the default $100K on my first attempt.
The geographic distribution of funded traders is the data set I had been searching for to compare regional prop firm adoption rates. The Philippines and Indonesia numbers (7-9% and 6-8% of global sign-ups) match what I observe in the trading Discord servers I moderate. The US drop-off after the MyForexFunds enforcement action is well-documented here with the regulatory context. Most summaries of that event skip the downstream effect on regional mix.
The retail versus funded trader comparison table is the clearest framing of the two models I have seen. The note that the challenge fee caps downside while keeping payout potential open is accurate and the table makes it easy to explain to people who ask why anyone would pay $300-650 to try for a $100K funded account instead of depositing $300 in a retail account. The expected value calculation is implicit in the table even without being stated.
The scaling statistics are the only place I have found the 18-24 month average time to maximum scaling documented with a named source. I had seen the FTMO scaling plan numbers but not the average progression time. For planning purposes, knowing that fewer than 6% of funded traders reach the first scaling tier changes how you set expectations for a prop trading career path versus a supplemental income approach.
I write about alternative finance income streams and the prop firm market size data ($6.7B in managed capital, $1.5B in annual challenge fees) gave me the industry scale I needed for a comparison piece. The FTMO $180M+ cumulative payout figure is one they have stated publicly but it is hard to find cited with a source and date. Having it with the reference made it usable in a published article.
The instruments traded by funded traders section confirmed that EUR/USD and gold at 43-47% and 18-22% respectively match the top two instruments in my own funded account. I had assumed more BTC exposure in the funded trader mix based on retail trading trends, but prop firm rules limiting crypto leverage push most funded traders back to FX and metals. That point about leverage effective rate being up to 100:1 in funded accounts versus 30:1 ESMA cap is also something most overviews miss.
Leave a Review

Quant Researcher & Systems Builder
Quantitative researcher who builds the automated systems behind Arxum strategy testing. Works in Python and Pine Script, using AI alongside classic backtesting to validate strategies on years of real data.