
Day Trading for Beginners: What It Actually Is
Here is a whole day trade, start to finish, on one session of spot gold, ticker XAU/USD, the live cash price of the metal.
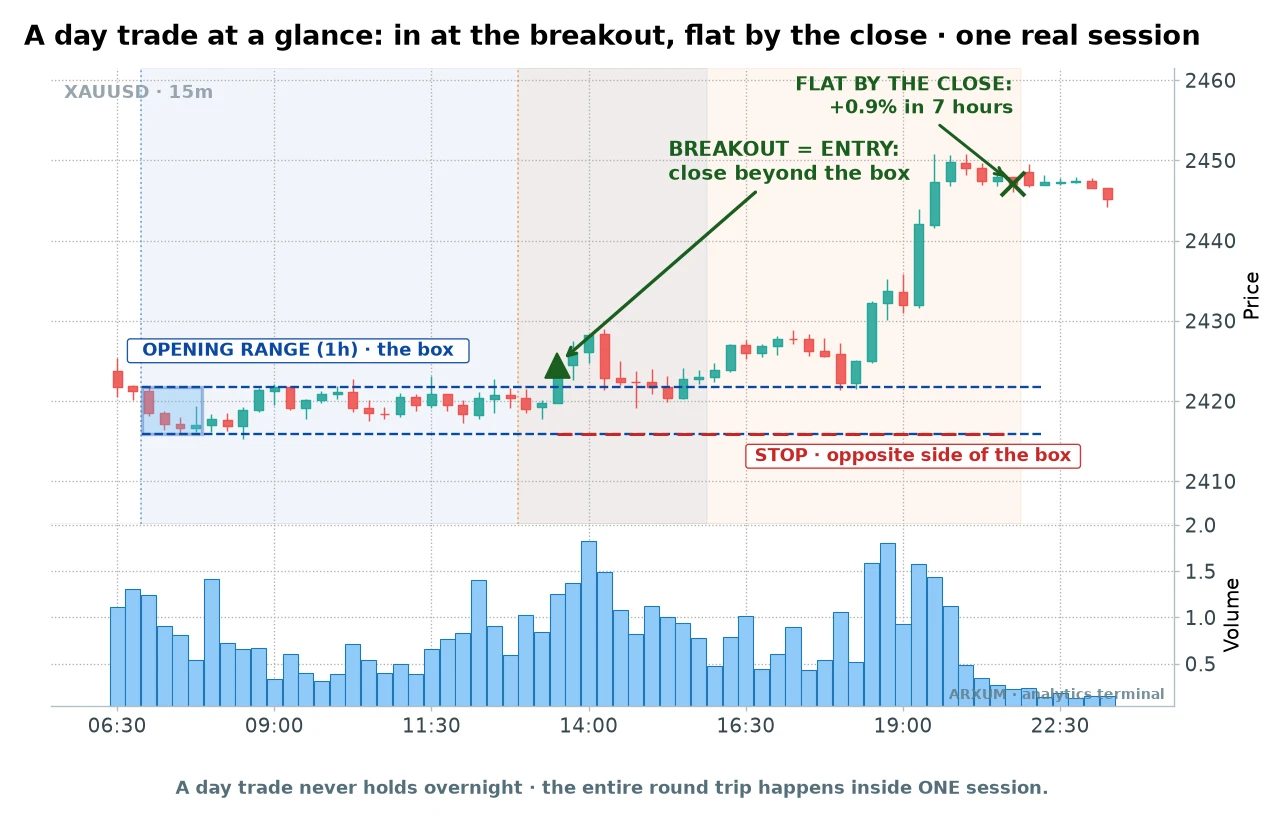
The market opens. Price spends the first stretch of the session carving out a high and a low.
That early box is the opening range, one of the most-watched levels on an intraday chart. Then price breaks out and runs.
You enter on the break, ride the move, and close before the session ends. Flat by the close, nothing carried overnight.
That is the whole shape of it. No gap risk while you sleep, no waking up to a position that moved against you for eight hours.
The trade-off is that everything happens fast and it wants your attention. Day trading is a different job from swing trading, which holds for days and only needs a check-in.
Neither is better. They ask for different things from you.
Every setup below is intraday. Each is forced flat by the session close, and each holds for hours, not days.
The First Thing Most Beginner Guides Skip
Open ten day trading guides and nine hand you an entry rule, then stop. On the desk I learned the entry is the easy part, and on its own it is usually not enough.
We ran four setups on each market raw, with no filter, then added confirmations one at a time. The result was blunt.
Around eight in ten raw setups lost money once fees came out. The same setups, with the right confirmation, paid.
So the useful question is not “which setup.” It is “which confirmation.”
Two terms first, because the numbers lean on them.
Profit factor is the whole strategy’s dollars won divided by dollars lost. Above 1.0 you made money.
A profit factor of 1.5 means about $1.50 came back for every dollar the losers cost. It is the right number for comparing setups.
Win rate is simpler: the share of trades that end in profit. Read it next to profit factor, never alone, because a low win rate can still make good money when the winners are big.
You will see exactly that below.
A volume filter means we only took a signal when the entry bar traded heavily, at least one and a half times the recent average volume. Heavy volume says real money showed up, not a thin drift.
One caveat for forex. The volume you see on EUR/USD is tick volume, a count of price updates rather than exchange-traded contracts, because forex has no central exchange to report real volume.
It tracks genuine activity closely enough to filter on, but treat it as a proxy, not a true traded total.
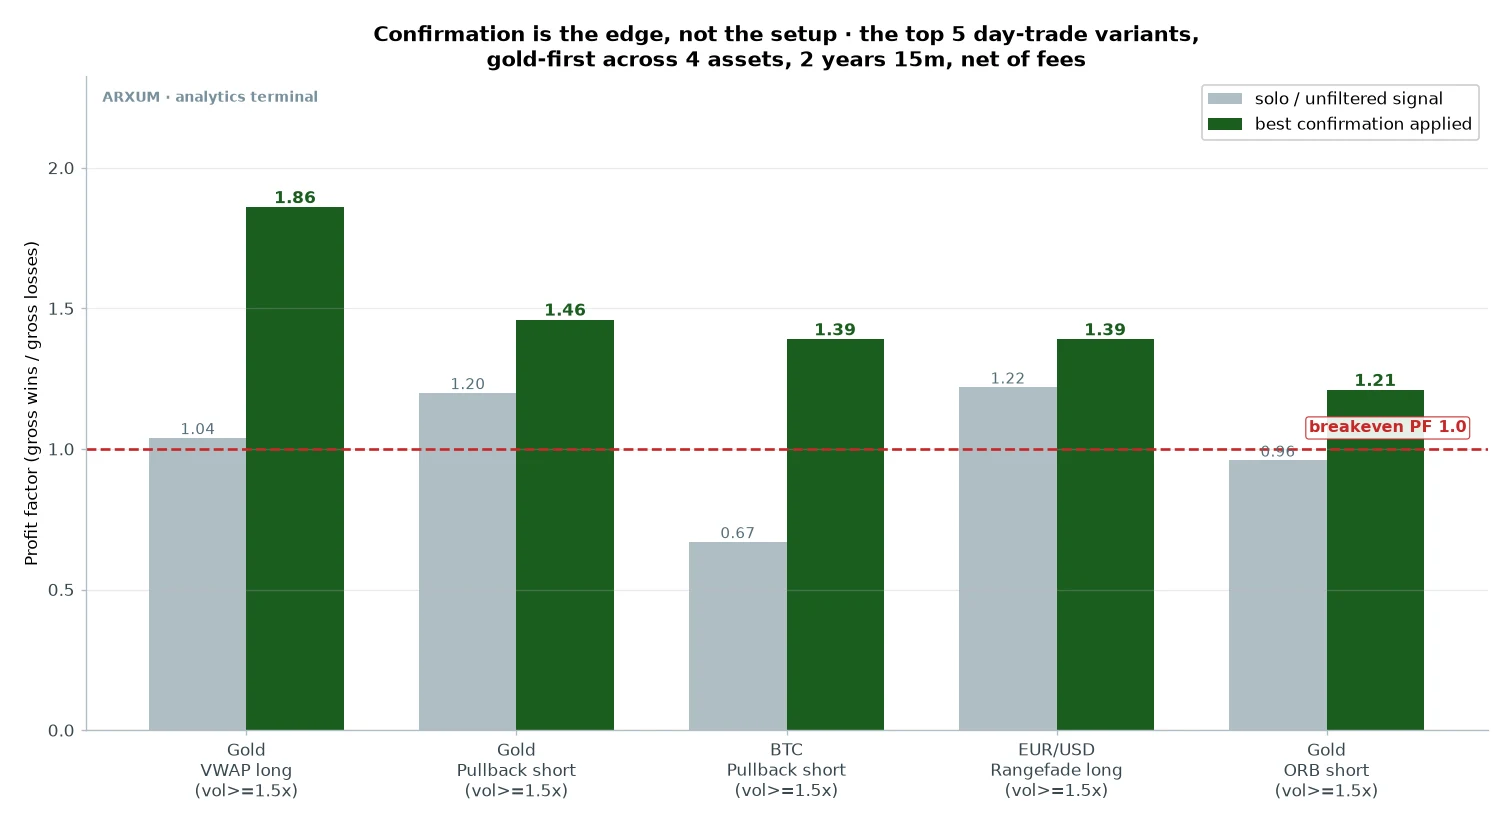
Out of twenty-four combinations of setup, side and market, these four are the ones a beginner can lean on. Tap any name to jump to its rules and trades.
Two labels show up in the names below, VWAP and EMA. Both are explained in full where they first come up, so treat them as names for now.
The side column reads long or short. Long is a bet the price rises, so you buy.
Short is a bet the price falls, so you sell first and aim to buy back lower.
| # | Setup | Market · side | Profit factor | Win rate |
|---|---|---|---|---|
| 1 | Gold VWAP reclaim | gold · long | 1.86 | 33% |
| 2 | Gold EMA pullback | gold · short | 1.46 | 24% |
| 3 | EUR/USD range fade | euro · long | 1.39 | 54% |
| 4 | Gold opening-range breakout | gold · short | 1.21 | 30% |
Read the chart, not a wall of numbers. Every setup starts near or below 1.0 on the left, the line between losing and making money.
The confirmation pushes all of them to the right, over that line. The gold opening-range short is the clearest case: a loser on its own, dragged into profit by the filter alone.
How do you read this live, without a test running behind you? Turn on the volume bars under the price.
When one bar stands roughly half again taller than its neighbours, that is the one-and-a-half-times read, by eye, no math needed. That single habit is what separates the version of these setups that works from the version that does not.
One honest scope note before the setups. This study swept a volume filter, not the wider indicator menu (ADX, RSI, ATR and the rest) that some of our other work runs.
The volume finding is one confirmation proven across several setups, not four different filters. Widening that menu is the next iteration, and I am not going to pretend it is already done.
One more honest line, and it covers the gold setups too, not just the euro fade. Every number below is in-sample, measured across the full two years with no separate slice of history held back to test the rules blind.
Read them as what these setups did over that window, not as a promise about the next one.
The Four Setups That Actually Paid
Two things jump out. Gold takes three of the four, because gold has been trending hard, and intraday tools love a trending market.
One heads-up before the charts. Gold ran from around $2,400 to past $5,000 across the two-year window, so you will see the same metal at very different price levels from one example to the next.
Same market, different points in a long climb. Nothing is wrong with the data when a stop is $8 wide in one chart and $60 wide in another.
And most of these win rates are low on purpose. A 24% win rate looks broken until you see the other half of the trade.
These setups lose small and win big. They run a low win rate against a high reward-to-risk, which I define properly at the first trade below.
The euro fade is the exception, a high win rate on tiny wins. Pick one to start with, learn its rhythm, and do not judge any of them by win rate alone.
One number will look odd for “day trading”: the trade counts are low, in the dozens over two years. That is the volume filter doing its job, cutting most signals as too thin.
It is also one setup, one side, one instrument. A real trader running several of these across a few markets sees far more action.
1. Gold VWAP Reclaim
The top setup, and the friendliest place for a beginner to start.
VWAP is the volume-weighted average price, the average price paid so far in the session. Price levels where more traded pull it harder, and it resets every morning.
Traders treat it as the session’s fair-value line. Our VWAP indicator guide covers adding it in one click.
The reclaim is simple. Price spends part of the session below VWAP, then pushes back up through it on heavy volume.
You buy that reclaim. The bet is that the session’s balance has flipped bullish.
The rules:
- Trigger: price closes back above session VWAP.
- Confirmation: the reclaim bar trades at least 1.5 times the recent average volume.
- Trend gate: the fast 20-EMA sits above the slower 50-EMA, so the short-term trend is up.
- Stop: below the swing low that formed under VWAP. Exit: the session close forces you flat.
Here is one of those reclaims, entry to exit.
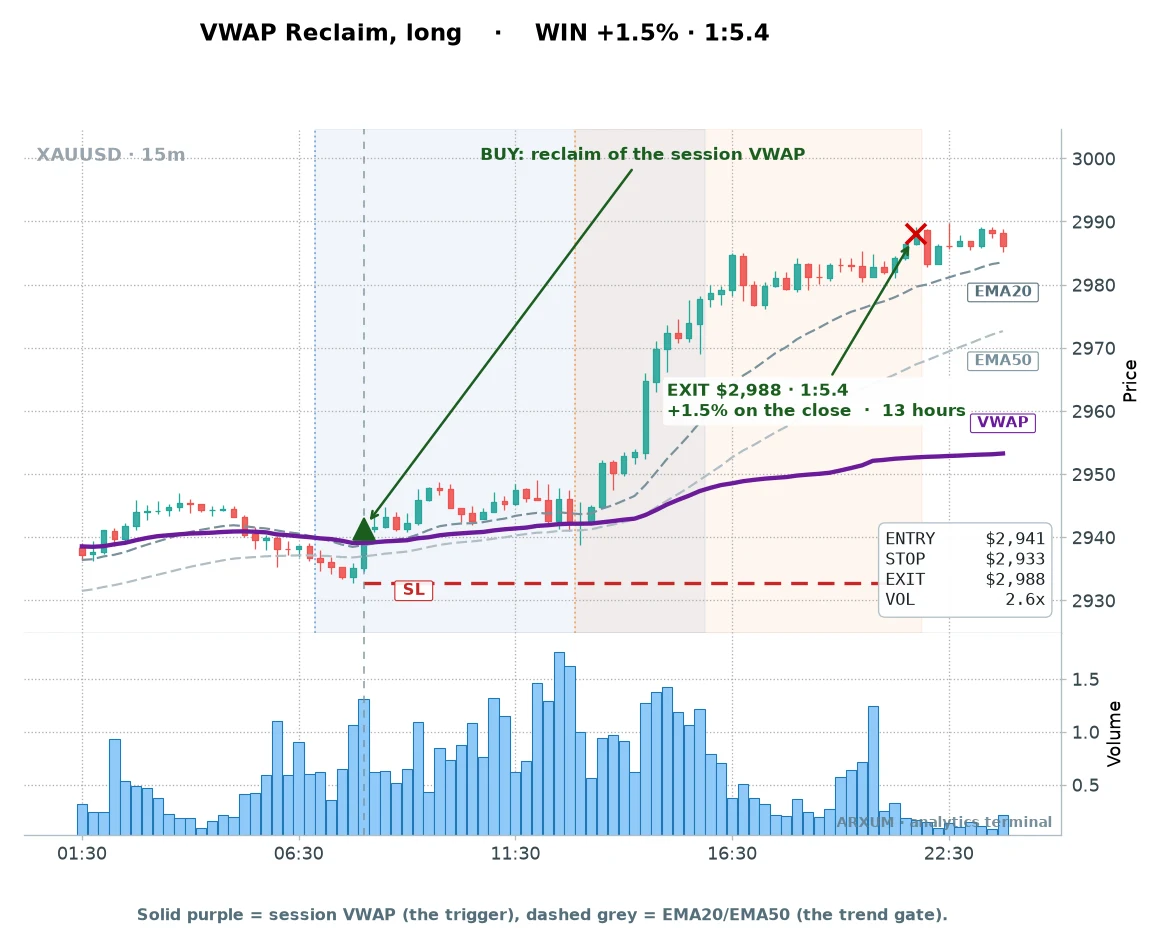
That phrase risk/reward 1:5.4 is worth a slow read. The 1 is your risk, the distance from entry to stop.
The number after it is the reward, how many times that risk the trade made back. So 1:5.4 means this winner returned about five and a half times what it would have lost if stopped.
You will see it called reward-to-risk too, same idea, same number. Our risk-reward ratio explainer walks it through in full.
Price had traded under VWAP, then reclaimed it on a volume bar well above its neighbours. That was the entry, the green marker.
The VOL box on the chart reads 2.6x. That bar traded 2.6 times the session’s average volume, comfortably past the 1.5 times we require.
Every VOL number on these charts is read the same way, as a multiple of average.
The stop sat under the swing low. The trade rode through the day and the close took it out for +1.5%.
Now the same setup losing, because honesty beats a clean story.
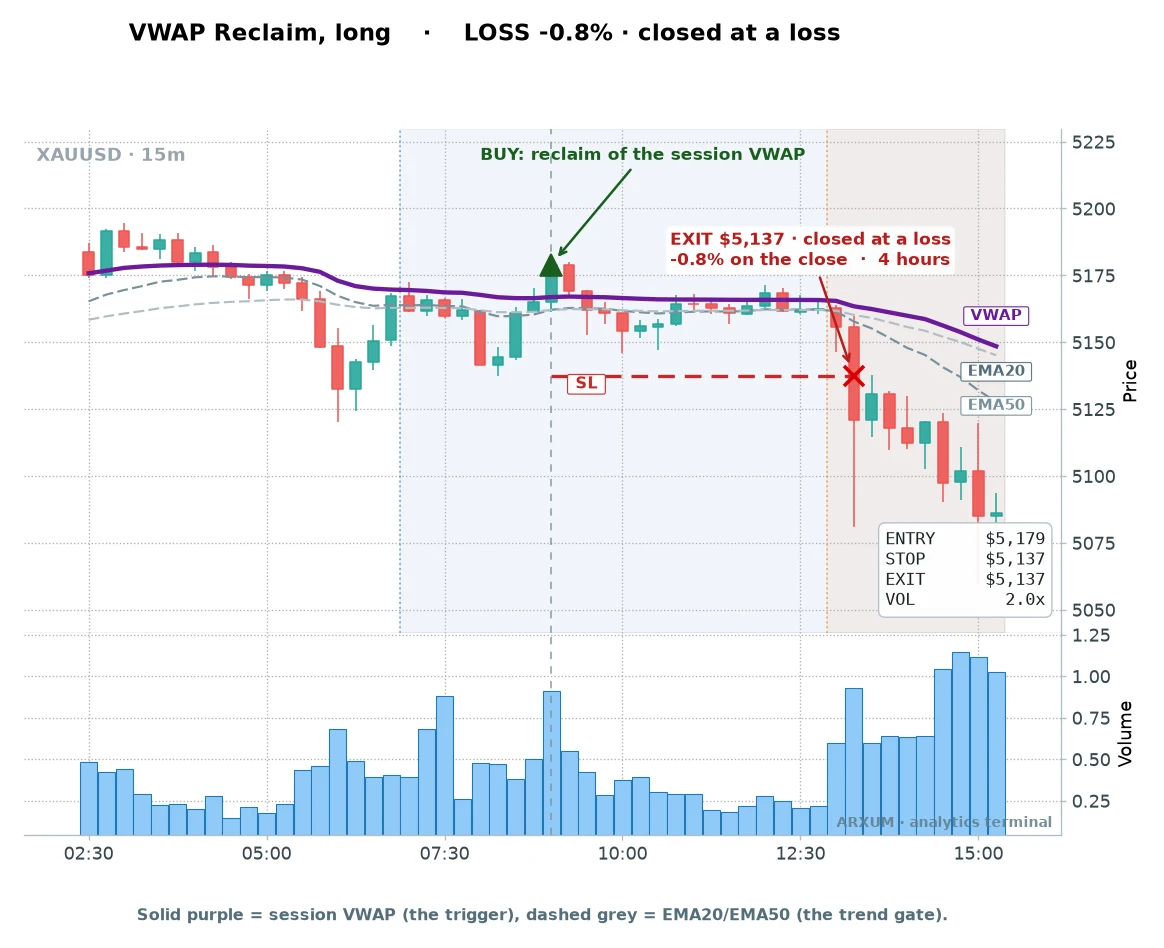
Everything looked right. Price reclaimed VWAP on volume, the entry fired, then it rolled straight back over into the stop.
A small, clean loss. This is the shape of the losers here, and there are more of them than winners.
The full trade history on gold, using the volume filter:
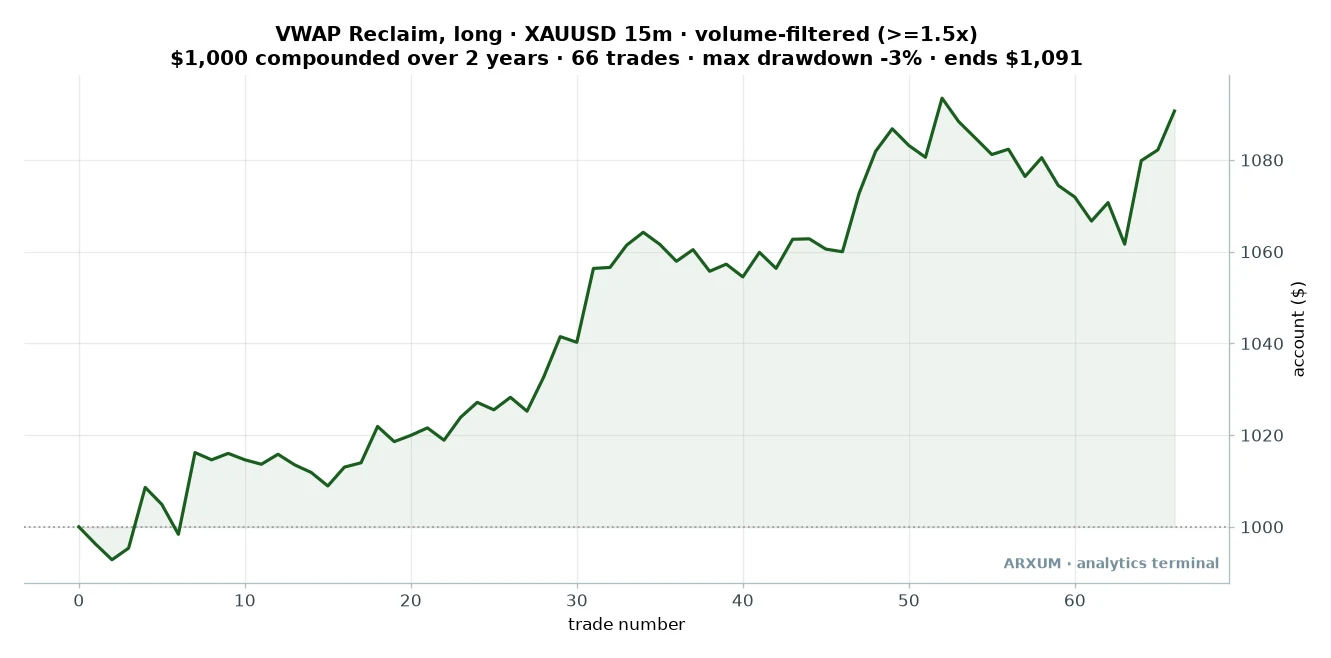
| Trades | 66 |
| Win rate | 33% |
| Profit factor | 1.86 |
| Avg gain per trade | +0.13% |
| Max drawdown | 3% |
| Net return on $1,000 | +9.1% |
Avg gain per trade is the expectancy, the average result of one trade with wins and losses blended together. At +0.13% it is small, which is normal.
The edge is thin per trade and only shows up over many of them. A drawdown is the deepest drop from a peak your account sits through, and 3% here is shallow because the reclaim kept the account climbing without a scary dip.
2. Gold EMA Pullback (Short)
The highest reward-to-risk of the four, and a pure momentum setup on the short side.
An EMA is an exponential moving average, a line that tracks recent price and reacts faster to new moves than a plain average. We use two, a fast 20-bar and a slower 50-bar, and our exponential moving average guide shows how to load them.
When the 20 sits below the 50, the short-term trend is down. That is your permission to look for shorts, not longs.
The pullback short catches a bounce inside a down move. Price is falling, bounces briefly toward the EMA, and you sell as it turns back down on heavy volume.
The rules:
- Trend: the 20-EMA is below the 50-EMA, short-term trend down.
- Trigger: a pullback stalls at the EMA and price turns back down.
- Confirmation: the turn arrives on volume at least 1.5 times average.
- Stop: above the bounce high. Exit: the session close.
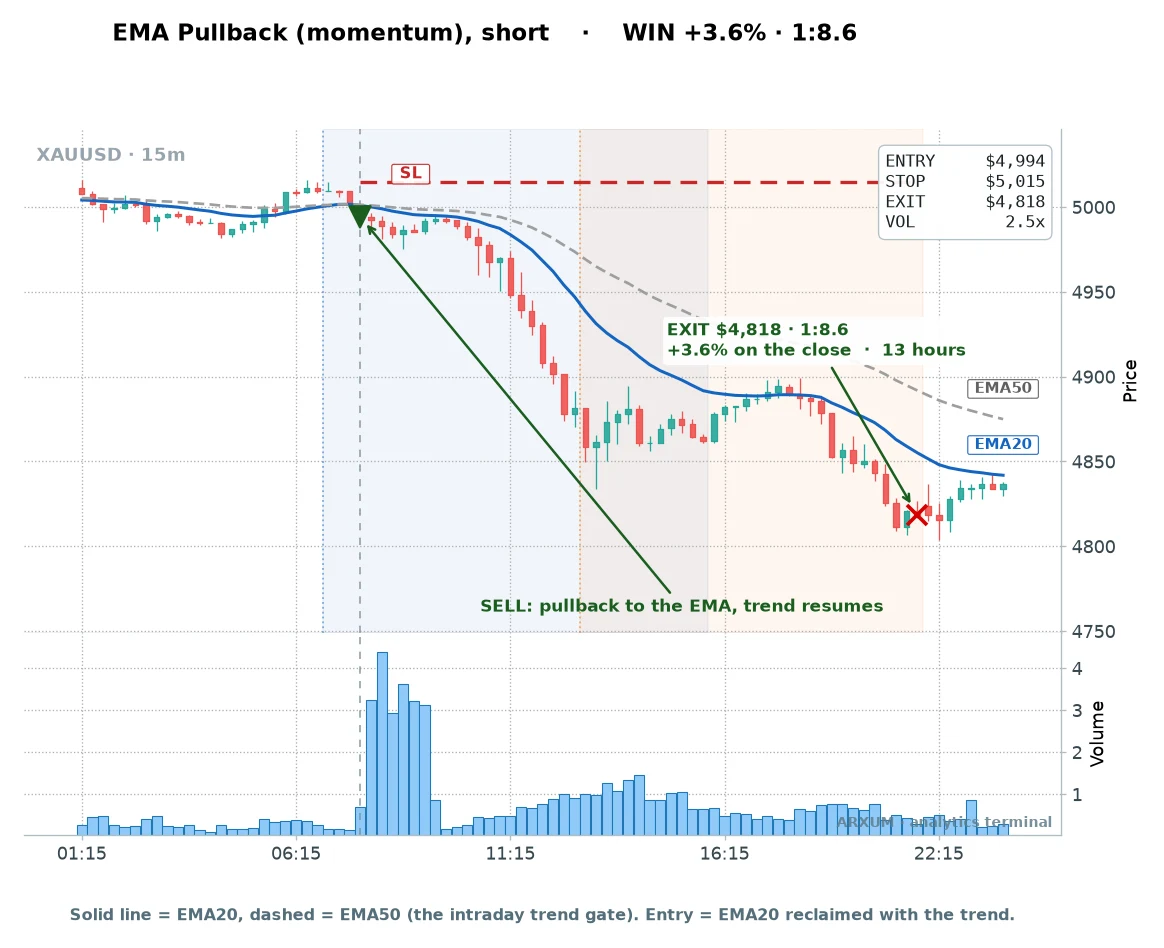
The bounce ran into the EMA, the entry fired on a heavy down-bar, and the drop extended for the rest of the session. A 1:8.6 winner.
Those big winners are what carry a 24% win rate into profit. You take a lot of small stops to be there for the runners.
And the loss:
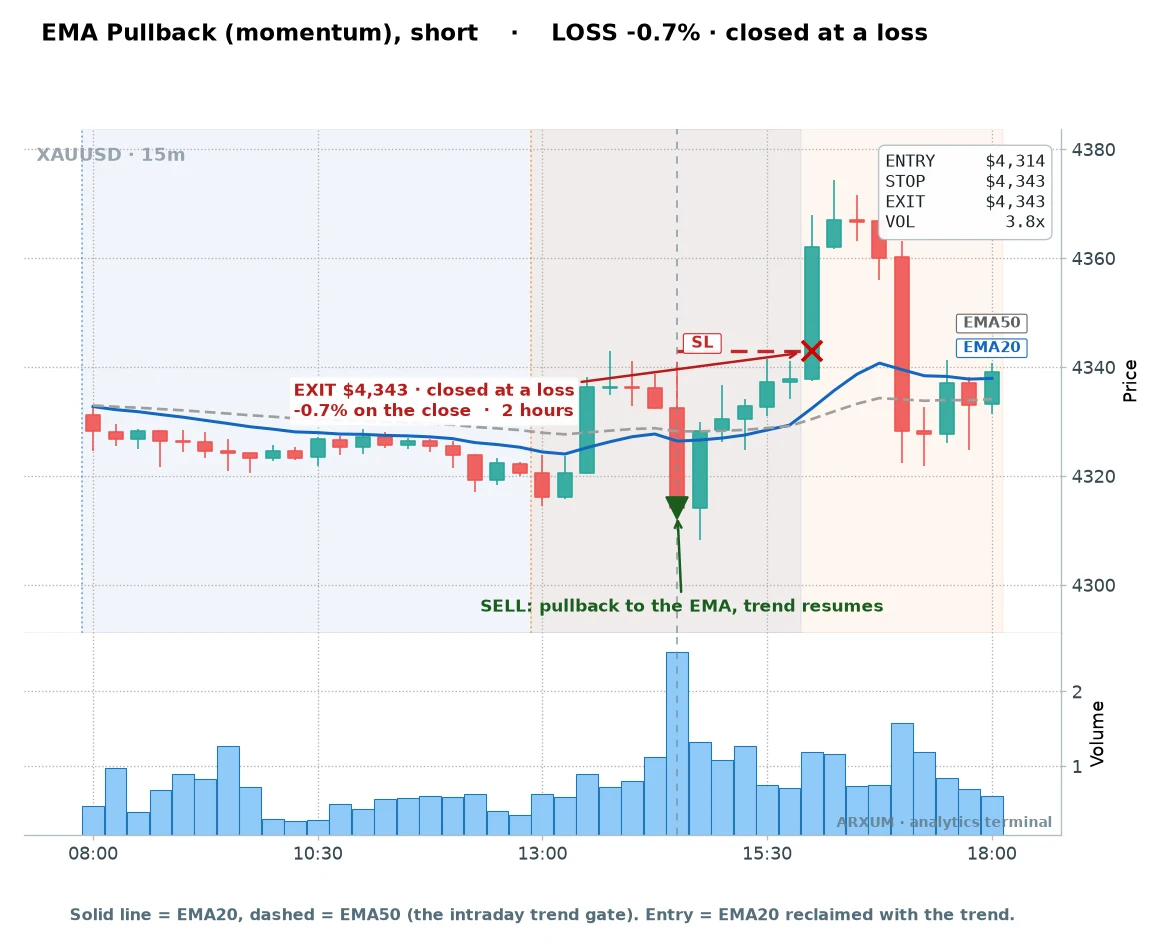
The setup was textbook and it still lost. Price ticked back up through the bounce high and took the stop.
Again, small. That is the deal with this one: three losses out of four, but the winners are large enough that the math works.
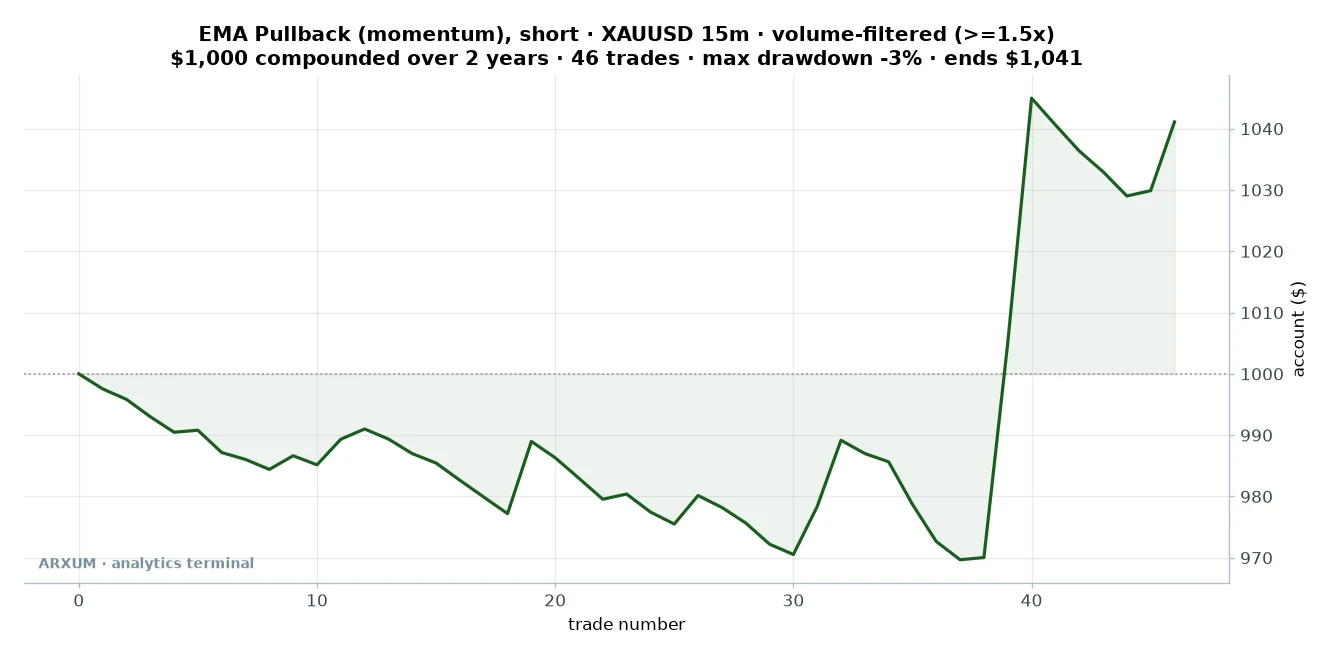
| Trades | 46 |
| Win rate | 24% |
| Profit factor | 1.46 |
| Avg gain per trade | +0.09% |
| Max drawdown | 3% |
| Net return on $1,000 | +4.1% |
Look at that curve before you trade this. It drifts underwater for most of two years, then one runner near the end pulls it green.
If you cannot sit through 30 trades that go nowhere, this is not your setup. That is not a flaw in the numbers, it is the honest personality of a low-win-rate momentum trade.
3. The EUR/USD Range Fade
The euro is the honest stress test. It spent most of the window chopping sideways while gold trended, and a sideways market wants a different tool.
Range fading means selling the top of a range and buying the bottom, on the view that price stays boxed in. This one buys the fade off the prior day’s low during the quiet pre-London hours, when the euro tends to drift rather than trend.
The rules:
- When: the quiet hours before the London session, roughly before 07:00 UTC.
- Trigger: price pokes below the prior day’s low, then a heavy bar pushes it back up.
- Confirmation: volume at least 1.5 times average on that snap-back.
- Stop: beyond the prior-day low. Exit: back into the range, or the session close.
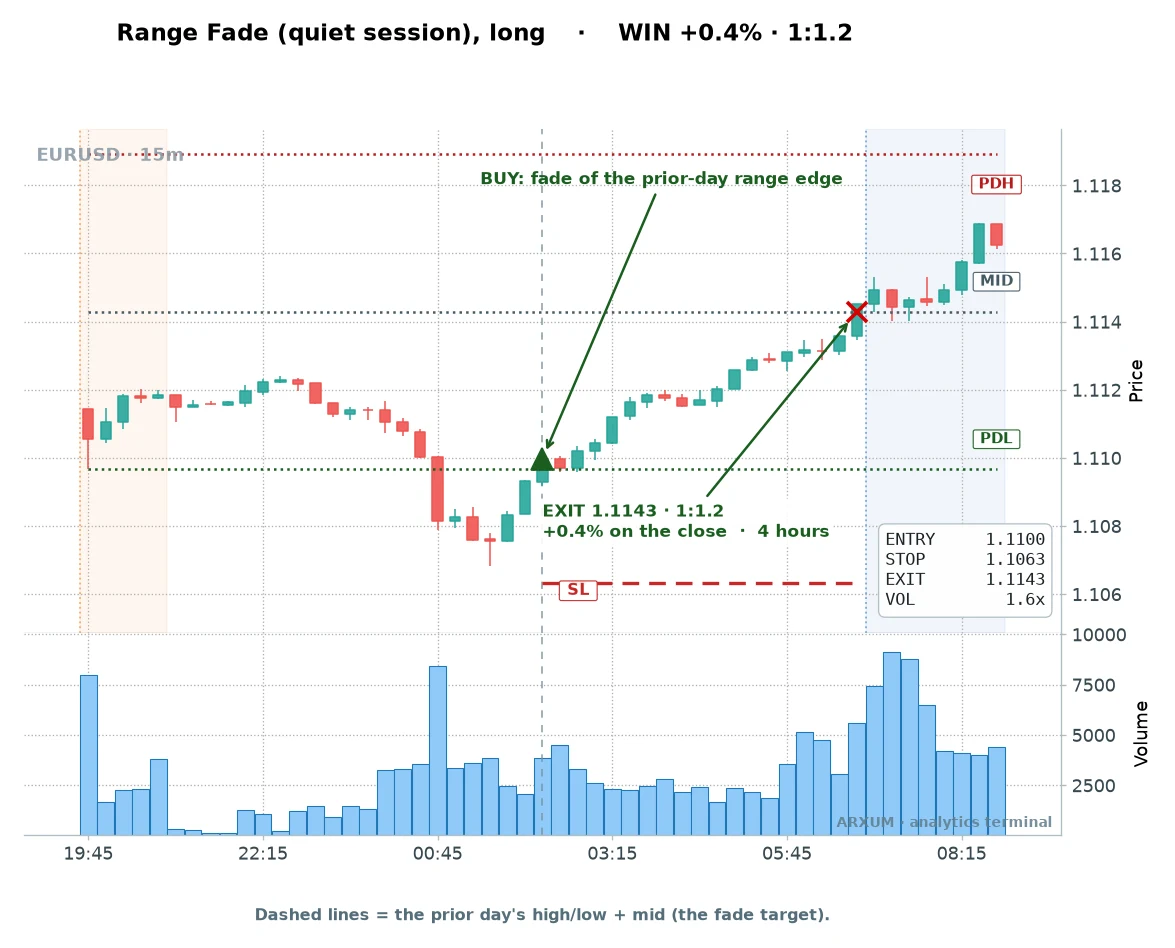
Price dipped below the prior low, a heavy bar snapped it back, and the fade drifted up into the range for a small win. The reward-to-risk is lower here, 1:1.2, which fits a range setup.
You are not catching a trend. You are catching a bounce back to the middle.
Reading the snap-back is easier if you know your candles. A long lower wick rejecting the level is the tell, which our candlestick patterns guide covers.
The loss is what happens when the range breaks for real:
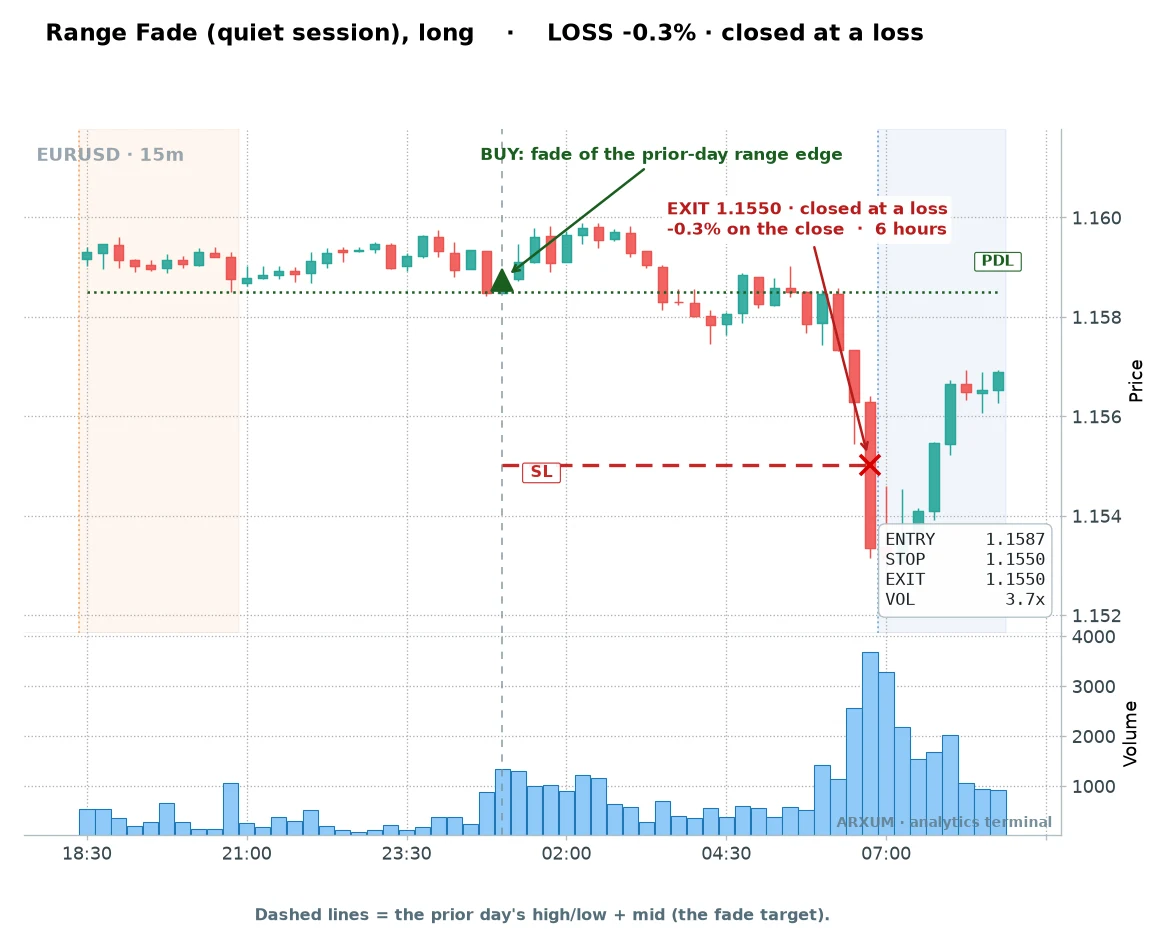
The fade assumes the level holds. When it does not, and the euro actually trends out of the range, the stop does its job.
That is the risk in every mean-reversion trade, and it is why this one is a specialist.
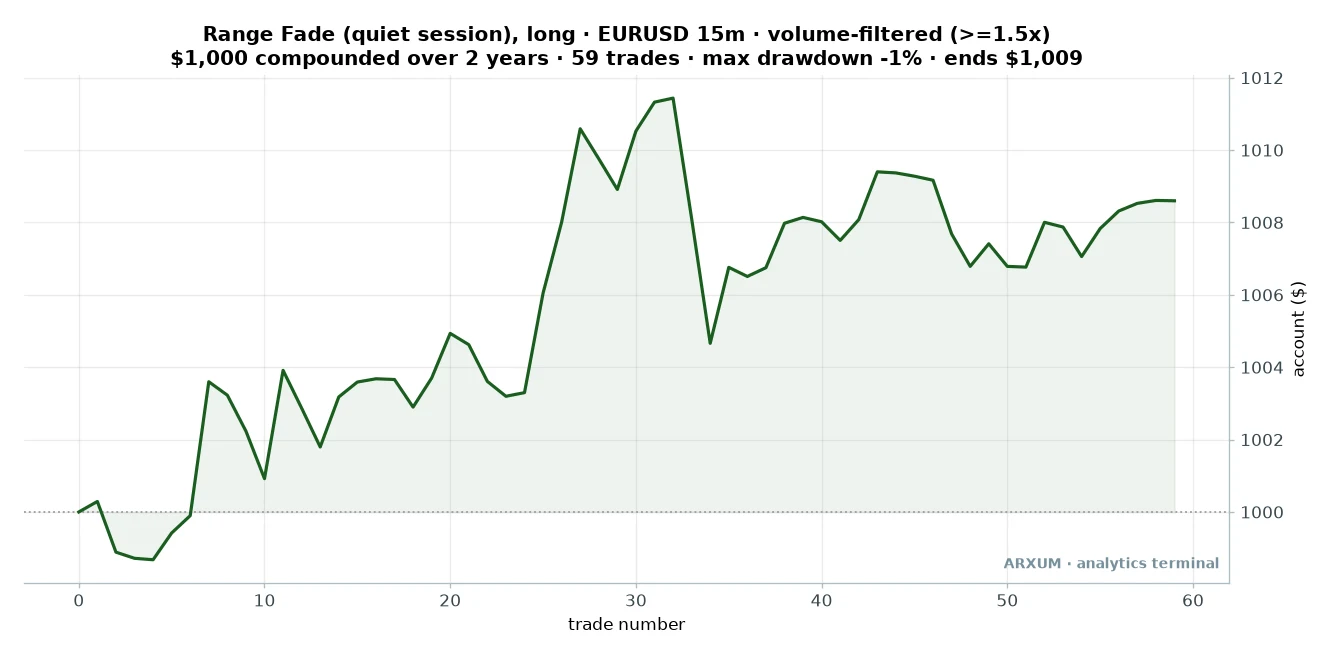
| Trades | 59 |
| Win rate | 54% |
| Profit factor | 1.39 |
| Avg gain per trade | +0.02% |
| Max drawdown | 1% |
| Net return on $1,000 | +0.9% |
This is the one setup here that wins more often than it loses, 54% of the time. But look at the tiny +0.02% average.
The wins are small, the losses are small, and the edge is thin. It also lives or dies on the euro genuinely ranging.
We did not run a formal split-the-history test on this one, so treat it as a quiet-hours tool, not an all-weather edge. When the euro starts trending out of its range, this fade is the first of the four to stop working, so check that the market is actually boxed in before you use it.
4. Gold Opening-Range Breakout (Short)
This is the setup from the very top of the article, the classic breakout every beginner reads about first. Now on the short side, and with a warning attached.
The opening-range breakout is the famous intraday play. Mark the high and low of the session’s first stretch, the opening range, and trade the break of either edge.
Short the break below the low.
On its own, the gold ORB short lost money, a 0.96 profit factor, an outright loser. The volume filter is the only reason it appears in this ranking at all.
The rules:
- Range: mark the opening range high and low, the first hour of the session.
- Trigger: price closes below the range low.
- Confirmation: the breakdown bar trades on heavy volume, at least 1.5 times average.
- Stop: back inside the range. Exit: the session close.
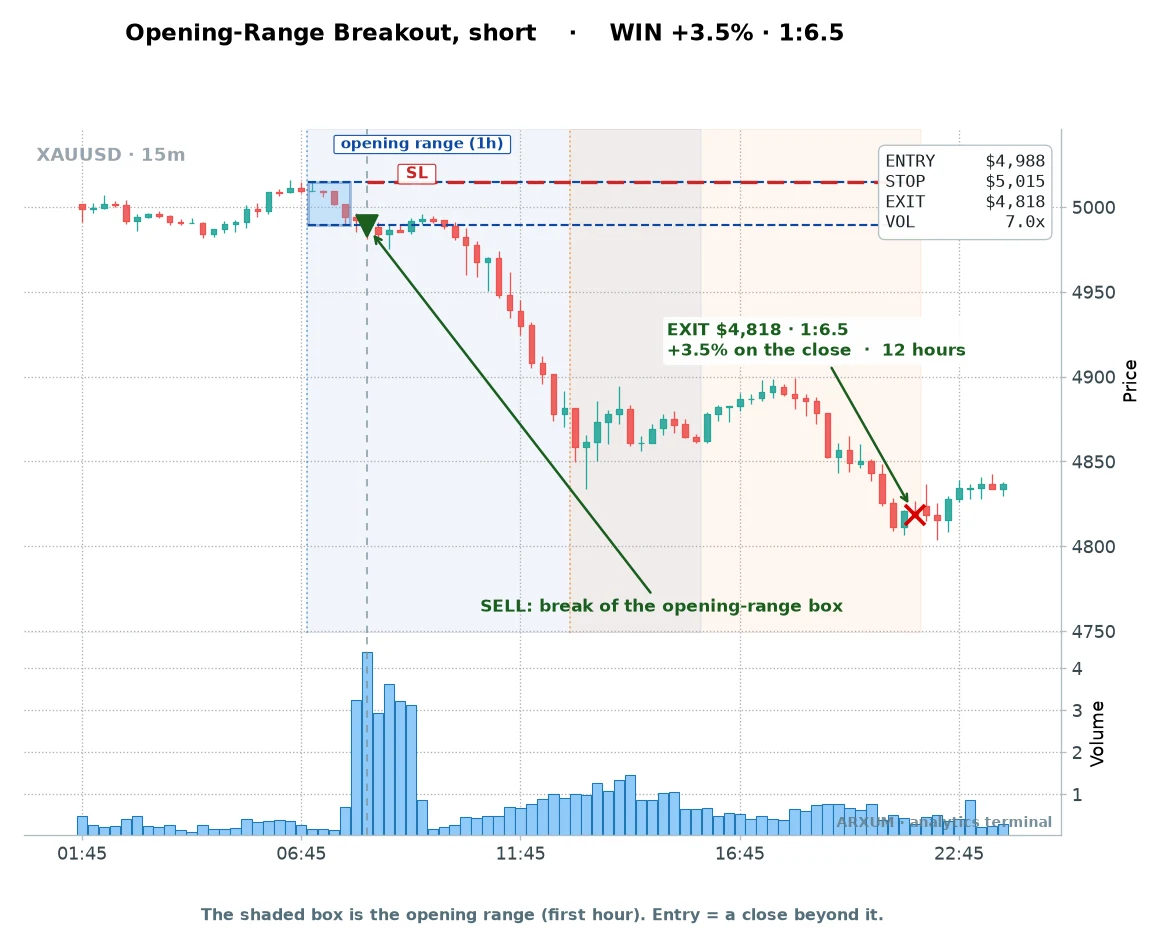
Price broke the range low on a heavy bar and kept going. The trade held into the afternoon session for +3.5%.
The loss shows the setup’s real weakness, the false break:
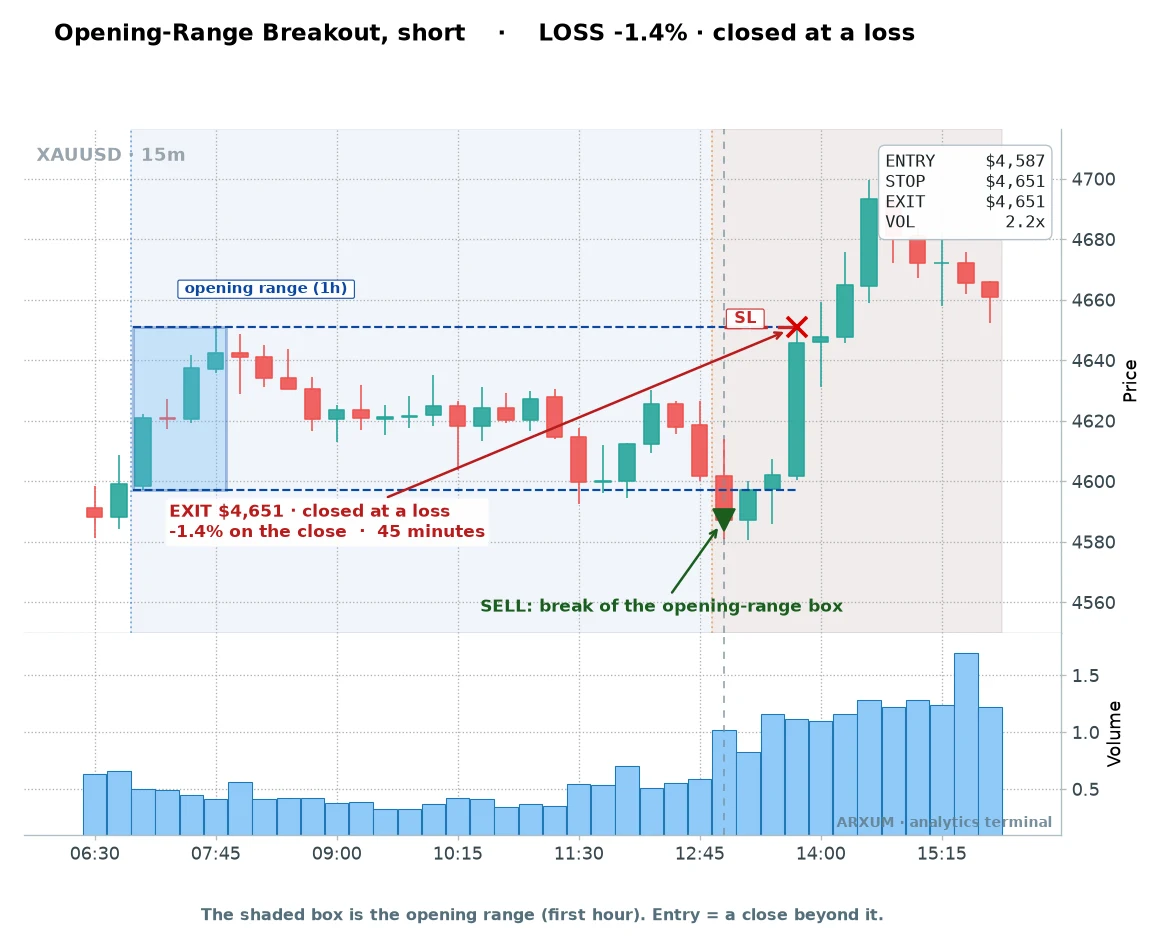
Price broke the low, triggered the short, then reversed straight back into the range and ran to the stop. False breaks are the tax you pay on breakout trading, and they are why the raw setup lost before the filter went on.
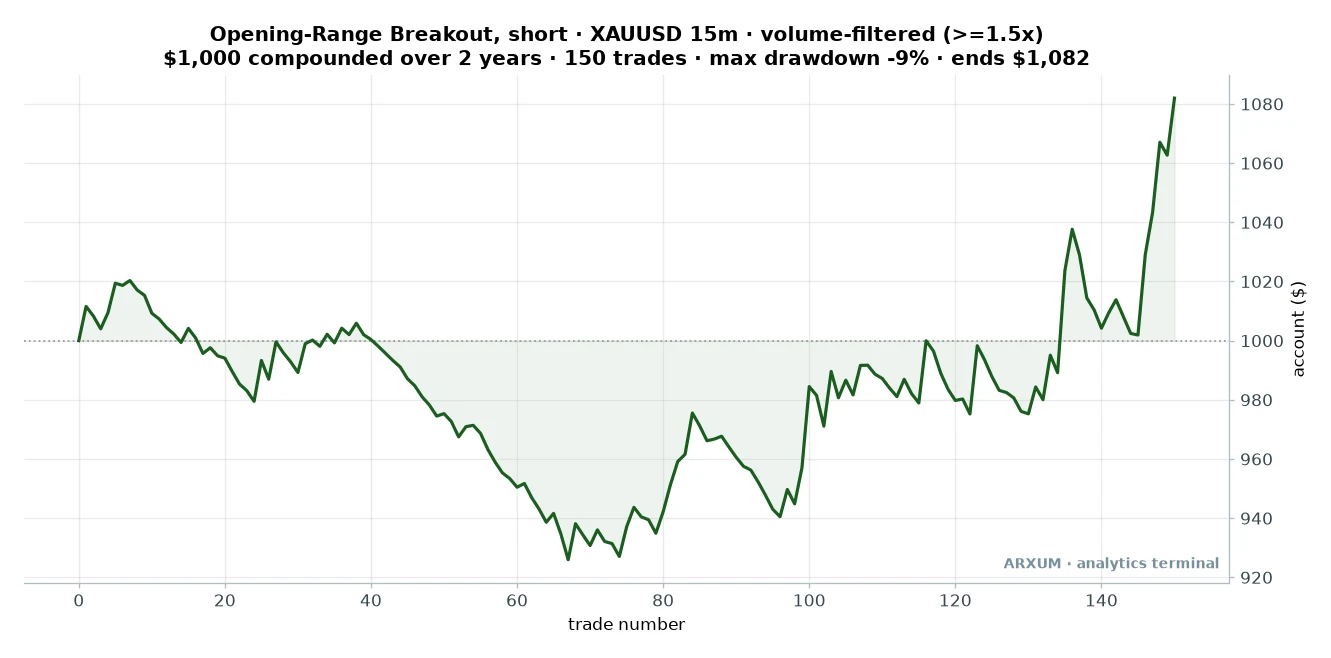
| Trades | 150 |
| Win rate | 30% |
| Profit factor | 1.21 |
| Avg gain per trade | +0.06% |
| Max drawdown | 9% |
| Net return on $1,000 | +8.2% |
Here is the honest caveat. This setup sat through a 9% drawdown in the middle, the deepest of the four, before it recovered.
The confirmation rescued a losing setup, but it is the least steady of the group. If you start with the famous breakout, start knowing it is choppier than the VWAP reclaim.
Sessions: When These Setups Fire
Forex and gold run around the clock on weekdays, but they are not equally active all day. The shaded bands on the gold and euro charts above mark the two windows that matter.
- London open (around 07:00 to 08:00 UTC): volume arrives, ranges expand, breakouts get real fuel.
- London to New York overlap (around 13:00 to 17:00 UTC): the busiest window, the cleanest moves on gold and the euro.
- The quiet pre-London hours (before 07:00 UTC): thin and drifty, which is exactly when the euro range fade fires.
Match the setup to the session. Breakout and momentum setups want the London open and the overlap, when volume can carry a move.
The range fade wants the quiet hours, when price tends to stay boxed. Running a breakout at 03:00 UTC on the euro is fighting the clock.
Our forex market hours guide maps the full session calendar. Bitcoin has no session at all, which is one reason it is harder to trade intraday and why this beginner guide sticks to gold and the euro.
Position Sizing: The Part That Keeps You In the Game
Your entry matters less than your size. This is where the small-account math gets real, and it decides which market you should even trade.
The rule to keep is 2% risk per trade. You never let one trade lose more than 2% of the account.
That way a losing streak dents you but never wipes you out.
On a $1,000 account that is $20 at risk on any single position, no more.
Try to size the gold pullback short from earlier on that account. Entry was near $4,994, and the stop sat about $21 per ounce away. The position is one division:
- Risk budget: $20
- Risk per ounce: $21
- Position size: $20 ÷ $21 = 0.95 ounces
Here is the problem that division exposes. A lot is just a standard trade size, and what one lot buys depends on the instrument.
For gold, the smallest position most brokers offer is one micro lot, which is one ounce. Your math says 0.95 ounces.
On a $1,000 account at honest 2% risk, you cannot take this gold trade, because the correct size is smaller than the minimum you can place.
That is not a flaw in the setup. It is the reality of trading a $5,000 instrument on a small account.
What you must never do is widen the stop or oversize to make it fit. That is how a 2% plan quietly becomes a 10% plan and blows up.
So here is the same math on a market a small account can actually trade, the EUR/USD range fade. Forex is sized in lots and measured in pips, the fourth decimal place of the price and the smallest standard step it moves in.
The smallest standard size is a micro lot, 1,000 units of the base currency, and on it each pip is worth about $0.10.
Take the euro fade from earlier. The stop was about 37 pips away. Same $1,000 account, same 2% rule, so $20 of risk:
- Risk budget: $20
- Risk per micro lot on a 37-pip stop: 37 × $0.10 = $3.70
- Position size: $20 ÷ $3.70 = about 5 micro lots (0.05 lots)
That works. Five micro lots on the euro is a normal, affordable position, and it risks close to the same 2%.
The lesson is not “avoid gold forever.” A broker offering fractional or cent-lot gold places that 0.95-ounce size without a problem, so the Gold VWAP reclaim, the steadiest setup here, is within reach on a small account through the right account type.
On a plain micro-lot account, though, a small balance belongs on a cheaper instrument like the euro, where the dollar stop is small enough to size honestly.
How to Start Day Trading, Step by Step
Here is how to day trade one of these setups end to end. Once your size is set, placing the order is three fields on the ticket:
- Entry: a market order on the bar that confirms the signal, or a sell-stop at the range low for the opening-range breakout.
- Stop-loss: in the stop field, at the level from the setup’s rules, the swing low, the bounce high, or the far side of the range.
- Exit: these are day trades, so the session close is your hard backstop. Close before the session ends even if neither stop nor target has hit.
You can chart and practice all of this free on TradingView before risking a cent. Add VWAP or the moving averages from the Indicators menu by name, or on MT4 and MT5 through Insert, then Indicators.
Then do the boring, important part: trade it on a demo account first, for at least 60 sessions, not 60 days. Some sessions will hand you no setup at all, and that is data too.
Keep a one-line journal for each session: the setup, the entry and stop, the result, and one thing to fix. After 60 sessions you will know your real win rate, not a hoped-for one.
Three tested configurations you can lift straight from the study:
- Gold, VWAP reclaim, long. 15-minute chart, London session onward. Buy the close back above session VWAP when the reclaim bar trades 1.5 times average volume, with the 20-EMA above the 50-EMA. Stop under the swing low, flat by the close.
- Gold, EMA pullback, short. 15-minute, 20-EMA below the 50-EMA. Sell as a bounce turns back down on heavy volume. Stop above the bounce high, and expect to sit through a long string of small losses.
- EUR/USD, range fade, long. 15-minute, quiet pre-London hours only. Buy the heavy-volume snap-back after price pokes below the prior day’s low. Stop beyond that low, small target back into the range, and only when the euro is genuinely boxed in.
The Discipline This Style Demands
The risk talk here is not filler, because these setups have a shape you have to make peace with.
You will lose most of your trades. Win rates of 24% to 33% on the gold setups mean two or three losses for every win.
If you cannot sit through five or six small stops without abandoning the plan, this style breaks you. Not because it stopped working, but because you stopped following it.
A few concrete habits keep you in the game:
- Risk the same 2% every time. Do not size up after a loss to win it back, and do not size up after a win out of euphoria. The math only holds if every trade is the same fraction of the account.
- Cap the day. If you lose 6% of the account in one day, which at 2% a trade is three straight losers, close the platform and stop. This kills the revenge-trading spiral before it kills the account.
- Use the circuit-breaker. If you take three to six losses in a row, the market’s character may have changed. Gold may have stopped trending, the euro may have started. Pause for a week and check conditions before the next trade.
- Run a calm live-versus-test check. If your real results drift far below the study over a real number of trades, do not panic-quit on one bad week, that is just variance. But a sustained, wide gap is a real signal, so step back and look at whether the market still suits the tool.
No mechanical setup is permanent. These are tools for specific market moods, trend for the gold setups and quiet ranges for the euro fade.
When the market changes character, the tool changes with it, and noticing that is the actual job. Only risk money you can afford to lose.
What Does Not Work
The ranking is the good news. The honest counterweight is everything that lost.
Most raw setups. Around two-thirds of the combinations we swept lost money unfiltered. Day trading is not quietly profitable by default, and without the right confirmation the average setup just bleeds fees.
The opening-range breakout without the filter. The setup most beginner guides lead with is a loser raw, a 0.96 profit factor on gold. It only earns its place with the volume confirmation bolted on.
Bitcoin as a starting market. Every raw Bitcoin setup lost across a rough two-year window, and crypto has no session structure to lean on. One filtered pullback survived, but it is the hardest of the lot, so it is not where a beginner should begin.
Trading the news. Retail platforms show delayed prices during a major release like Non-Farm Payrolls, which can move EUR/USD 50 to 100 pips in seconds, so by the time the spike is on your screen the professional side already took the other side of it. Close positions before red-news events rather than trade them.
Common Beginner Mistakes
- No stop before entry. Every position gets its stop set before you click. “I will exit manually” turns a small loss into a held disaster.
- Trading against the higher timeframe. A 15-minute buy inside a 4-hour downtrend is the lowest-quality entry there is. Check direction first, take the setup second.
- Skipping the confirmation. The whole study says the entry alone loses. Taking the setup without the volume read is trading the version that does not work.
- Moving the stop wider. A trade goes against you and you slide the stop out to “give it room.” That breaks the 2% rule and is how accounts end. Set it, leave it.
- Judging a setup by win rate. A 24% win rate is fine when the winners run 1:8. Cutting winners early to feel like you win more quietly destroys the edge.
Where to Go From Here
If you are still deciding whether this style fits your schedule at all, the honest comparison is in swing trading vs day trading, which weighs screen time against overnight risk.
The bottom line is the one the data kept repeating. The entry gets you in the door.
The confirmation, a heavy volume bar behind the move, is what turns an intraday setup from a coin flip into something worth trading. Pick one setup, trade the market that suits it, size for the account you actually have, and let the winners run to the close.
FAQ
What is day trading for beginners, in plain terms?
Is day trading profitable for beginners?
How much money do you need to start day trading?
What is the best day trading strategy for beginners?
What is the best time of day for a beginner to day trade?
How long does it take to learn day trading?
Should a beginner use leverage?
What is the Pattern Day Trader rule?
Which markets are best for day trading as a beginner?
What are the key terms in this guide?
Real-time trade setups with entry, stop loss and take profit. Daily market analysis. No subscription, no complicated theory.
🌍 Our recommended brokers


Reader Reviews
Be the first to review this — tell other traders what actually helped, or where it fell short.
Leave a Review

Forex Analyst & Senior Trader
Former FX desk trader with 8 years in institutional forex. Works in multi-timeframe analysis and order flow, turning desk experience into systematic, testable rules across forex and metals.
