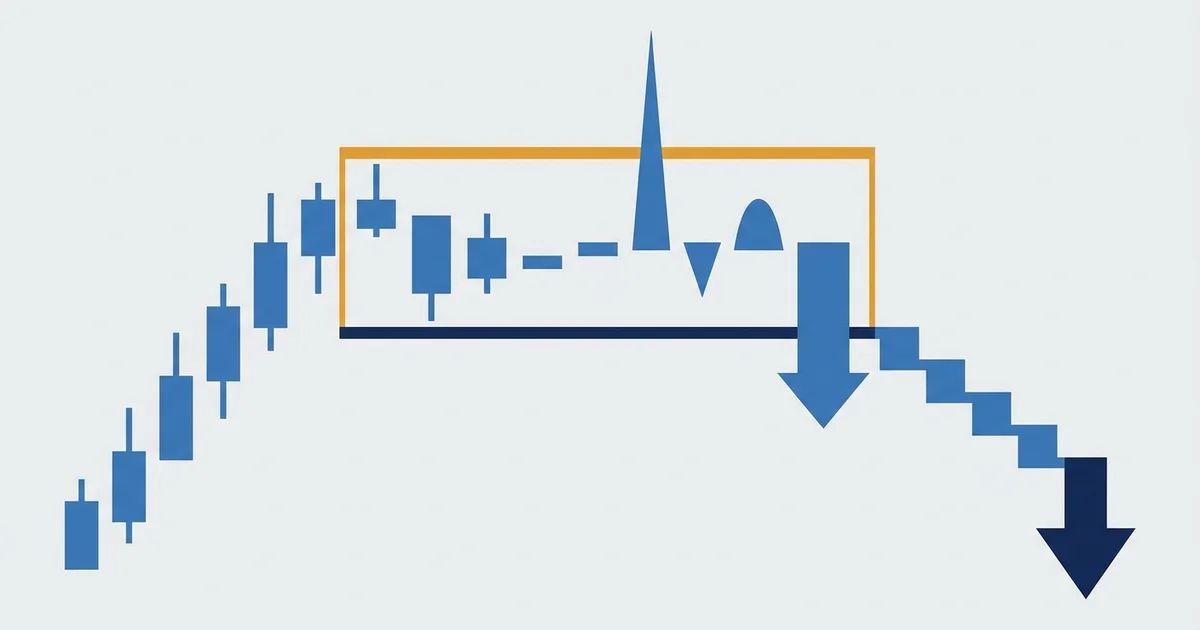

The Wyckoff distribution schematic
This is the textbook Wyckoff distribution schematic, the picture every course draws. Read it left to right: a strong rally, a flat range at the top, then a fall.
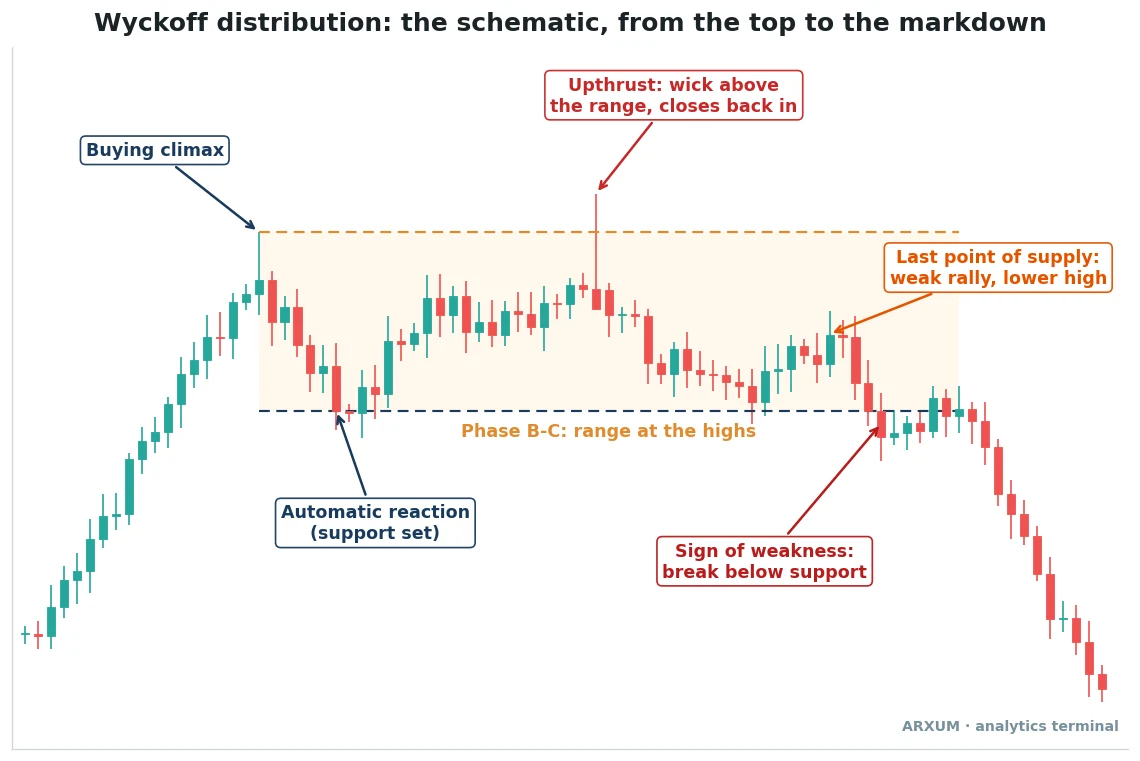
Every label on that chart is one of Wyckoff’s named events. Here is what each one means, in the order they print.
- Buying climax (BC): the last burst of the rally, usually the widest bars and the heaviest volume. Late buyers pile in, and large sellers fill them.
- Automatic reaction (AR): the sharp drop that follows, because the buying fuel is spent. Its low becomes the range floor.
- The range at the highs (Phase B-C): weeks or months of sideways chop between the floor and the climax high. This is where most of the selling quietly happens.
- Upthrust (UT): a wick above the range top that closes back inside. Breakout buyers get trapped, and the sellers get one more round of buy orders to sell into (traders call this liquidity).
- Last point of supply (LPSY): a rally that stalls well below the range top. A lower high on weak volume means demand is gone.
- Sign of weakness (SOW): a decisive close below the range floor. The markdown begins here.
Two classic events are not drawn on the schematic. Preliminary supply (PSY) is the first heavy selling that appears before the climax, and the secondary test (ST) is a retest of the climax high in Phase B.
The five Wyckoff distribution phases
Wyckoff split every range into lettered phases. The table gives each phase its job, the event that marks it, and what you are watching for.
| Phase | Key event | What it means |
|---|---|---|
| A | Buying climax, automatic reaction | The uptrend stops |
| B | Secondary tests of the high | The range builds, selling happens |
| C | Upthrust (UTAD) | The final trap above the top |
| D | Lower highs, last point of supply | Sellers take control |
| E | Break below support | Markdown, the new downtrend |
UTAD stands for upthrust after distribution. It is the Phase C version of the upthrust, the mirror of the spring in an accumulation range.
A few things about the phases that courses tend to skip:
- Phase B is the longest by far. On a daily chart it can run for months, and it looks like nothing is happening.
- Not every range prints a UTAD. Plenty of tops go straight from Phase B into lower highs, which is why you never wait for a perfect checklist.
- The textbook puts a first sign of weakness inside Phase D, a dip down to the floor, then the last point of supply. The schematic marks the final, decisive break as the sign of weakness.
- Phase E often retests the broken floor from below. That retest is another last point of supply, and it is the cleanest short in the whole structure.
The one-line version: A stops the trend, B builds the range, C traps the buyers, D shows the weakness, E delivers the fall.
Distribution vs accumulation
Distribution is accumulation flipped upside down. Same logic, opposite crowd.
| Feature | Distribution | Accumulation |
|---|---|---|
| Where it forms | After a rally, at the highs | After a fall, at the lows |
| Climax | Buying climax | Selling climax |
| Phase C trap | Upthrust above the top | Spring below the floor |
| Weak swing | Last point of supply | Last point of support |
| Exit move | Markdown | Markup |
| Who gets trapped | Late buyers | Late sellers |
The Wyckoff method guide covers the framework behind both ranges. It lays out the laws of supply and demand, cause and effect, and effort versus result.
Method 1: reading the range as a regime gauge
The first way to use Wyckoff distribution is not a trade at all. It is a read on what kind of market you are in, so you stop using trend tools in a range that is rolling over.
- How it looks: the rally that used to make easy higher highs now stalls at one ceiling. Pullbacks get deeper, rallies get shorter.
- What changes: buy-the-dip setups that worked all trend start failing at the old high.
- What it does not mean: a range at the highs can also be a pause before the next leg up, called re-accumulation. The upthrust and the sign of weakness decide which one it is.
| Role | How you use it | Best read |
|---|---|---|
| Regime read | Stop chasing longs at the old high | D1 (daily chart) on any market |
| Exit cue | Trim longs after the buying climax | D1 and H4 (4-hour chart) |
| Bias filter | Favor shorts once Phase D starts | H4 inside a D1 range |
| Context | Mark floor and ceiling before any trade | Every timeframe |
The tell inside the range is effort versus result:
- Heavy volume on a rally that barely moves price means someone large is selling into it.
- Volume spread analysis calls that bar a supply bar.
- On spot Forex you only get tick volume, a count of price changes, so read the shape, not the exact height.
Telling distribution from re-accumulation
This is the hardest call in Wyckoff trading. Both look like a flat range after a rally until late in the structure.
| Clue | Points to distribution | Points to re-accumulation |
|---|---|---|
| Break above the top | Fails, closes back in | Holds, retests from above |
| Rallies inside range | Lower highs | Higher lows |
| Volume on drops | Rises on the way down | Dries up on the way down |
| Floor tests | Floor gets hit harder each time | Floor holds with less effort |
The rule of thumb: until the floor breaks, treat it as a range and trade neither side hard. The structure tells you its name late, not early.
Method 2: fading the upthrust at the top of the range
The upthrust is the trap event of the structure, and the most aggressive way to trade it. EUR/USD on the 4-hour shows the top of a range where buyers repeatedly failed.
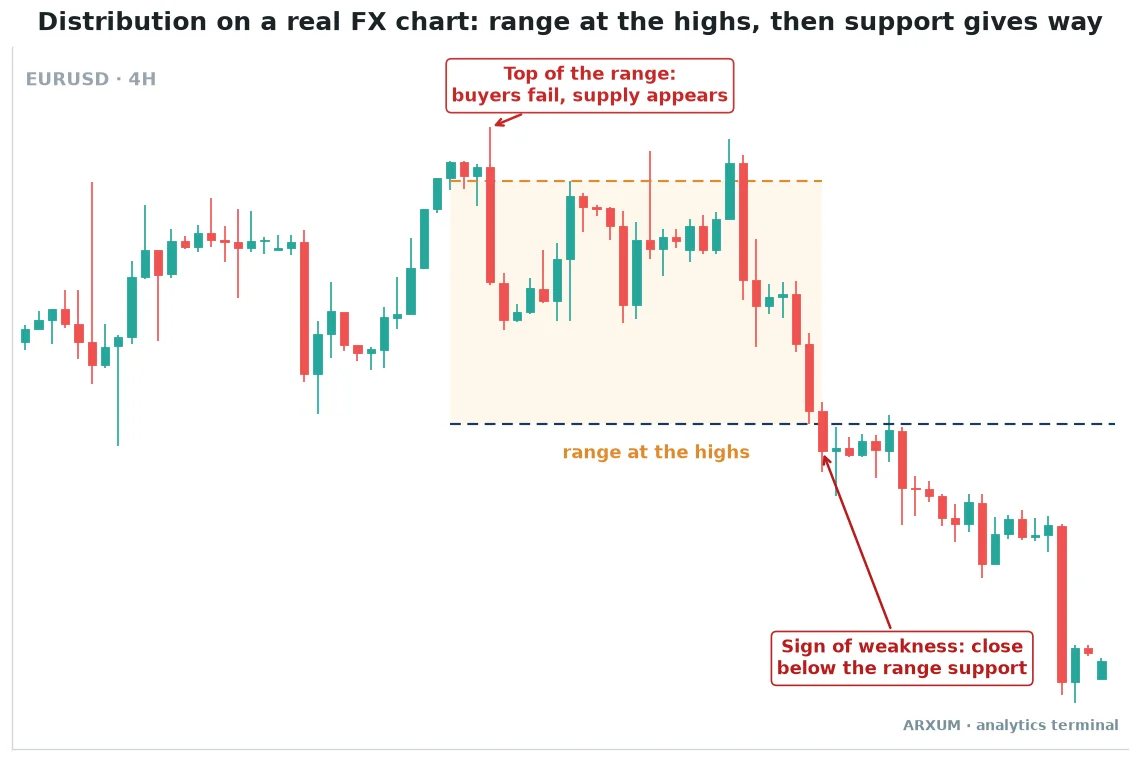
Here is how to read the EUR/USD chart, left to right:
- The red “Top of the range” tag marks the first high of the box. That is the buying-climax area, where the rally stalls. It is not the upthrust.
- The upthrust is the unlabelled pair of bars near the right edge of the box. A tall green bar closes just above the orange top line.
- The very next bar is a big red one that closes back inside the box and wipes out the whole green bar. The poke above the top failed on the next candle, and that failure is what makes it an upthrust.
- Compare that with a real breakout: if the next bar had held above the orange line, the rule in the mistakes section below would apply, and you would not fade it.
On your own chart, put the floor at the automatic reaction low: the bottom of the first sharp drop after the top.
How the upthrust looks:
- A wick or a single bar above the range top, usually on news or into a busy session.
- The close comes back inside the range, ideally in the lower half of the bar.
- The next bar or two fails to reclaim the top.
- Volume is high on the poke, then light on any follow-up rally.
| Role | How you use it | Best read |
|---|---|---|
| Entry trigger | Sell after the close back inside | H4 on EUR/USD, GBP/USD |
| Confirmation | Next bar fails to retake the top | H1 (1-hour chart) inside an H4 range |
| Stop logic | Above the upthrust wick high | Any timeframe |
| Exit cue for longs | Close longs on a failed breakout | D1 swing positions |
| Filter | Skip if the close holds above the top | Every market |
Why fade it at all? Because the breakout buyers are now trapped above a ceiling, and their stops sit just under the range top.
- The upside: the tightest stop in the structure, just above the wick.
- The downside: it is early. Some upthrusts are real breakouts that only look like failures for one bar.
- The fix: wait for the bar after the upthrust to close back inside. You give up a little price for a lot of clarity.
This is the same idea as a failed breakout, framed inside a range that has already shown signs of supply.
Method 3: the sign of weakness break and the LPSY retest
The conservative way to trade the top waits for the floor to break, then sells the retest. Bitcoin on the daily chart shows the full sequence.
| Step | What you see | What you do |
|---|---|---|
| 1 | Range at the highs, floor marked | Wait, no trade yet |
| 2 | Daily close below the floor | Note it, still no trade |
| 3 | Weak bounce back toward the floor | Prepare a sell order |
| 4 | Bounce stalls near the old floor | Sell, stop above the bounce |
| 5 | Price leaves the retest zone | Manage toward the target |
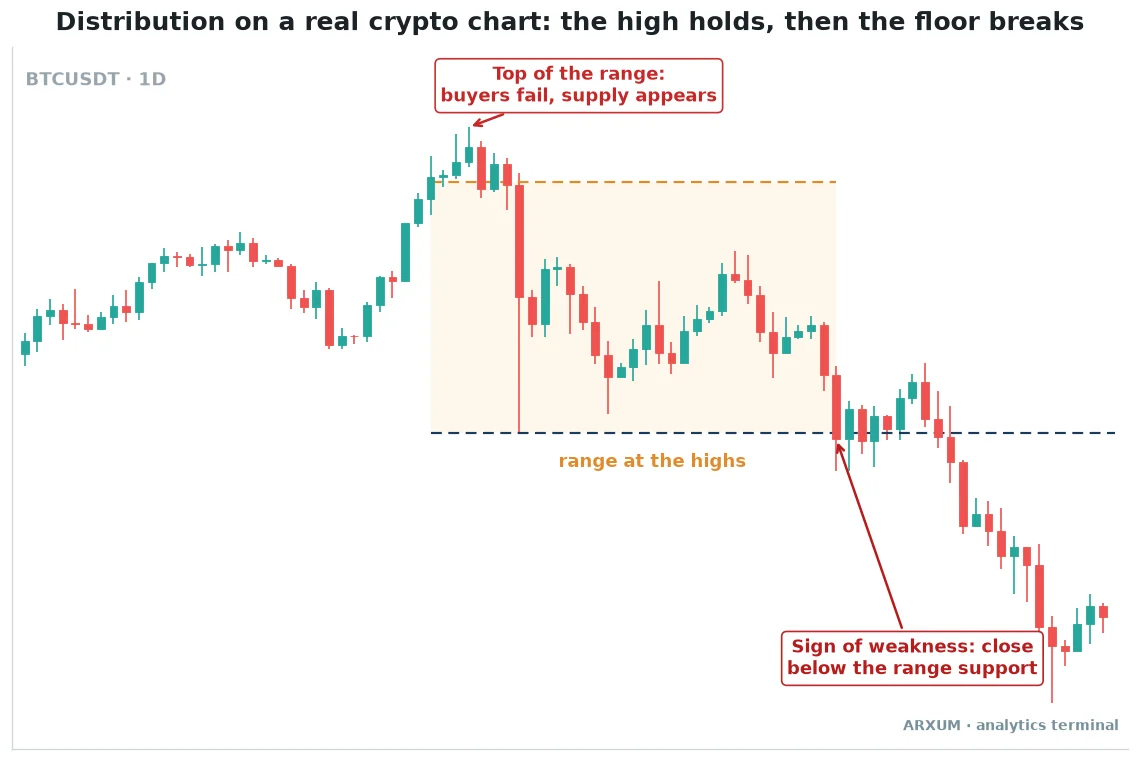
On the Bitcoin chart, none of the rallies inside the box get back to the top before the floor goes. After the break, price climbs back to the old support, which now acts as resistance.
Here the retest overshoots. For a few days the daily candles close back above the old floor, inside the box.
Then they stall well below the middle of the range, and the markdown resumes. That overshoot is still part of the retest, not a reclaim.
Count it as a reclaim only when:
- price closes back above the middle of the range, or
- price takes out the bounce high where your stop sits.
Closes just above the old floor that roll over below the middle of the range are still a failed retest.
How the breakdown looks:
- A wide bar that closes clearly below the range floor, not just a wick under it.
- A bounce afterwards that is smaller and slower than the drop.
- The bounce stalls near the old floor. It may overshoot for a few days, but it fails below the middle of the range. Old support is now resistance.
- The next leg down starts from that retest.
| Role | How you use it | Best read |
|---|---|---|
| Trend read | Close below floor = markdown begins | D1 on BTC and gold |
| Entry trigger | Sell the stalled retest | H4 inside a D1 break |
| Confirmation | Retest fails under old support | H4 and H1 |
| Target guide | Range height projected down | Any timeframe |
| Exit cue | Close shorts if price reclaims floor | Every market |
The retest is a classic support and resistance flip, which Wyckoff calls a last point of supply.
The trade-off in one line: the upthrust fade gets the best price, the retest gets the best odds. Most traders start with the retest.
The target: cause and effect
Wyckoff’s law of cause and effect says the size of the range hints at the size of the move. A long, wide distribution can fuel a long markdown.
- Simple target: measure the range height, top to floor, and project it down from the break.
- Example arithmetic: a range 120 pips tall (a pip is the smallest standard price step, 0.0001 on EUR/USD), broken at the floor, gives a first target 120 pips below it.
- Second target: the start of the rally that built the top, if the range was long.
- It is a guide, not a promise. Markdowns often overshoot in crypto and undershoot in slow FX pairs.
Wyckoff distribution across markets and timeframes
The structure is the same on every chart. What changes is how clean it looks and how much you can trust volume.
| Market | How it shows up | Watch for |
|---|---|---|
| Bitcoin | Clean, fast markdowns | Deep upthrusts, wild wicks |
| EUR/USD, GBP/USD | Slow, wide ranges | Tick volume, news spikes |
| Gold (XAU/USD) | Tops are rarer in bull runs | Many ranges are re-accumulation |
| Silver (XAG/USD) | Sharp climaxes, violent breaks | Wide stops needed |
| Oil (WTI) | Cyclical, ranges do turn | Inventory and OPEC headlines |
A few honest notes by market:
- Bitcoin gives the textbook look most often, and its volume is real exchange volume. That makes it the best market to train your eye on.
- On spot gold (XAU/USD), a strong bull trend means most flat ranges at the highs turn out to be pauses. Demand the sign of weakness before calling a top on the metal.
- EUR/USD ranges are wide and slow, so Phase B can feel endless. The 4-hour chart compresses them into something readable.
- Silver and oil move further than you expect once the floor goes. Size down for the wider stop.
Which timeframe to read it on
| Timeframe | Reliability | Best use |
|---|---|---|
| D1 | Highest, ranges mean something | Spotting the top, the regime read |
| H4 | Good, the swing sweet spot | Upthrust fades, retest entries |
| H1 | Noisy, many fake ranges | Timing inside an H4 or D1 range |
| M15 and below | Mostly noise | Skip for structure reads |
- The rule: find the range on the daily or 4-hour, then drop one timeframe to time the entry.
- A one-hour “distribution” with no daily context is usually just a pause.
Distribution vs other topping patterns
Distribution is not the only way traders read a top. It overlaps with several chart patterns, and knowing the overlap saves a lot of confusion.
In the last row, ICT stands for Inner Circle Trader, a popular online trading course with its own session-based model.
| Pattern | What it reads | Wyckoff angle |
|---|---|---|
| Double top | Two equal highs, neckline | A short Phase B with a secondary test |
| Head and shoulders | Higher head, lower shoulders | Head = upthrust, right shoulder = LPSY |
| Rising wedge | Shrinking up-moves | Effort with less result each push |
| ICT AMD | Session-based manipulation | Same idea, much shorter time |
- A double top is often a compressed distribution. The second peak is the secondary test, and the neckline is the range floor.
- In a head and shoulders, the head often plays the upthrust and the right shoulder is a textbook last point of supply.
- The ICT model of accumulation, manipulation, distribution borrows Wyckoff’s words but runs inside a single session. Different clock, same trap logic.
Why it matters: Wyckoff explains why these patterns work. Large sellers need buyers, and the shapes are the footprints of that selling.
Which method to use when
| Situation | Use | Why |
|---|---|---|
| Holding longs at a stalled high | Range read | Protect profit early |
| Clear failed breakout | Upthrust fade | Tightest stop |
| Floor broken on a close | Breakdown retest | Best confirmation |
| Unsure if it is distribution | Range read | Wait for the structure |
| Strong bull trend, like gold | Breakdown retest | Never fade a strong trend early |
How to place a Wyckoff distribution trade, step by step
Here is the breakdown-retest short worked on a small account. The numbers below are example arithmetic to show the sizing, not a result from any test.
- Mark the range. Draw a line at the floor (the automatic reaction low) and at the ceiling (the buying climax high) on the daily or 4-hour chart.
- Wait for the break. You need a full candle close below the floor, not a wick.
- Wait for the retest. Let price bounce back toward the old floor and stall there.
- Set the stop. Place it just above the retest high, so the stop sits back inside the broken range.
- Size the position. Risk 2% of the account, worked out below.
- Place the order. Use a sell-limit at the old floor (an order that sells only if price rises to that level), or a sell-stop under the retest candle’s low (an order that sells only once price drops through it) if you want confirmation.
- Set the take-profit. Use the range height projected down from the break.
Worked example on EUR/USD, $1,000 account
| Step | Calculation | Result |
|---|---|---|
| Risk budget | $1,000 × 2% | $20 |
| Stop distance | Retest high to entry | 40 pips |
| Risk per micro lot | 40 pips × $0.10 | $4 |
| Position size | $20 ÷ $4 | 5 micro lots (0.05) |
| Target | Range height, 120 pips | Risk/reward 1:3 |
- A micro lot is 1,000 units. On EUR/USD each pip is worth about $0.10 per micro lot.
- Risk/reward 1:3 means the target is three times the stop distance. The risk-reward ratio guide explains the 1:X format.
- Five micro lots control about 5,000 euros, roughly five to six times a $1,000 account.
- Broker leverage of 1:100 or more only gives margin room for that size. It adds no risk, because the 2% rule already caps the loss.
The same idea on gold and Bitcoin
| Market | Calculation | Verdict |
|---|---|---|
| Gold, $25 stop | 1 micro lot (1 oz) × $25 = $25 | Over the $20 budget |
| Gold, $18 stop | 1 micro lot × $18 = $18 | Fits, 0.01 lot |
| Bitcoin, $1,500 stop | 0.01 BTC × $1,500 = $15 | Fits, 0.01 BTC |
- On gold, the smallest lot most brokers allow is 0.01, which is 1 ounce.
- A wide daily stop can push that past 2% of a small account. Find a tighter retest on the 4-hour, or trade EUR/USD instead.
| Platform | Range and floor | Volume |
|---|---|---|
| TradingView | "Rectangle", "Horizontal Line" | Built-in "Volume" |
| MT4 / MT5 | Insert, then Objects | Insert, Indicators, Volumes |
Risk and discipline at the top of a market
Shorting a top is harder than buying a dip. The crowd is still bullish, and you feel early.
- Expect some breakdowns to fail. A close below the floor followed by a reclaim back inside means the read was wrong, so take the stop and move on.
- Three to six losses in a row is a signal, not bad luck. The market may have changed regime, maybe the range was re-accumulation all along, so pause and reread the daily chart.
- Don’t add to a losing short because “it has to break.” Wyckoff ranges can run far longer than your account can sit through.
- After a clean markdown win, don’t hunt for distribution on every flat chart. Euphoria makes every pause look like a top.
- Only trade money you can afford to lose. A good read loses sometimes, and the edge only shows over many trades.
For the mechanics of where stops belong on a structure trade, the stop-loss strategy guide goes deeper.
Common mistakes with Wyckoff distribution
- Calling the top on the buying climax. The climax ends the rally, but the range can run for months. Shorting it is shorting a trend that has only paused.
- Labeling every range a distribution. Many ranges after a rally are re-accumulation, especially on gold. Wait for the floor to break.
- Fading an upthrust that actually held. If the bar closes above the top and the next one holds, that is a breakout.
- Trusting spot Forex volume like exchange volume. Tick volume shows the shape, not the precise size.
- Reading distribution on a 15-minute chart. Without a daily or 4-hour range around it, the structure means little.
- Forcing the labels. Real charts rarely print every event in order. The logic matters more than ticking off PSY, BC, AR, ST and UTAD.
What works: three things to remember
- The floor decides. A range at the highs is only distribution once price closes below the floor. Until then, it is just a range.
- The retest is the trade. Selling the weak bounce near the old floor gives a defined stop and the best confirmation in the structure.
- Context beats labels. Read the range on the daily or 4-hour, respect strong trends like gold’s, and let failed upthrusts and lower highs do the convincing.
Glossary
- Wyckoff distribution: a topping range where large holders sell to late buyers before a downtrend.
- Buying climax (BC): the final, heaviest burst of the rally that marks the top of the range.
- Automatic reaction (AR): the sharp drop after the buying climax; its low sets the range floor.
- Secondary test (ST): a later retest of the buying climax high inside the range.
- Upthrust / UTAD: a move above the range top that closes back inside, trapping breakout buyers.
- Last point of supply (LPSY): a weak rally that makes a lower high, or a failed retest of the broken floor.
- Sign of weakness (SOW): a decisive close below the range floor.
- Markdown: the downtrend that follows a completed distribution.
- Re-accumulation: a range at the highs that resolves upward instead of down.
FAQ
What is Wyckoff distribution, in plain terms?
Wyckoff distribution is the sideways range that forms at the top of a market while large holders quietly sell to late buyers. A buying climax stops the rally and a long range forms at the highs. It often includes a false breakout called an upthrust, and it ends when price closes below the range floor. After that, the downtrend, called the markdown, begins. It is the mirror image of Wyckoff accumulation at a bottom.
Is a distribution range bullish or bearish?
Bearish. A completed distribution ends with price breaking below the range floor and starting a downtrend. Until that break happens, though, the same range could still turn out to be re-accumulation and resolve upward.
What are the phases of Wyckoff distribution?
There are five. Phase A stops the uptrend with the buying climax and automatic reaction. Phase B builds the range at the highs, where most of the selling happens. Phase C is the final trap, the upthrust after distribution above the range top. Phase D shows lower highs and the last point of supply. Phase E is the break below support and the markdown that follows.
What is a UTAD?
UTAD stands for upthrust after distribution. It is a move above the range top in Phase C that fails and closes back inside the range. Breakout buyers get trapped above the ceiling, and large sellers use their orders to finish selling. It is the mirror of the spring in an accumulation range, and not every distribution prints one.
How do you trade a Wyckoff top?
There are two common entries. The aggressive one sells a failed upthrust once price closes back inside the range, with a stop above the wick high. The conservative one waits for a close below the range floor. It then sells the weak bounce that stalls under the old floor, with a stop above that bounce. Size the position so the stop costs about 2% of the account, and use the range height projected down from the break as a first target. Most beginners do better starting with the retest, because the broken floor confirms the read before money is at risk.
How do I tell distribution from re-accumulation?
Watch what happens at the edges of the range. In distribution, breaks above the top fail, rallies inside the range make lower highs, and the floor gets hit harder each time. In re-accumulation, breaks above the top hold, dips make higher lows, and selling volume dries up. Neither is confirmed until price leaves the range, so treat it as a range until then.
What is the best timeframe to read it on?
The daily and 4-hour charts. Ranges on those timeframes reflect real positioning, so the phases mean something. Find the structure there, then drop to the 1-hour only to time an entry.
Does it work on Forex and gold?
Yes, with caveats. On EUR/USD and other majors the structure forms the same way, but ranges are slow. Spot Forex shows only tick volume, so read the volume shape rather than its exact size. On gold, a strong bull trend means many flat ranges at the highs turn out to be pauses, not tops. Wait for a close below the floor before treating a gold range as distribution.
What do BC, AR, ST, UTAD, SOW and LPSY stand for?
BC is the buying climax, the final burst of the rally. AR is the automatic reaction, the drop that sets the range floor. ST is the secondary test of the high. UTAD is the upthrust after distribution, the failed break above the top. SOW is the sign of weakness, the close below the floor. LPSY is the last point of supply, a weak rally with a lower high or a failed retest of the broken floor.
Real-time trade setups with entry, stop loss and take profit. Daily market analysis. No subscription, no complicated theory.
🌍 Our recommended brokers


Reader Reviews
Be the first to review this — tell other traders what actually helped, or where it fell short.
Leave a Review

Momentum Trader & Technical Analyst
Trades momentum across crypto and forex since 2019, built around RSI, MACD, and volume. Turns discretionary setups into rule-based, systematic entries and validates them on data before they go live.