
What the Three White Soldiers Pattern Looks Like
Here is the textbook version everyone is taught. A downtrend runs out of sellers, then three strong bullish candles march higher one after another.
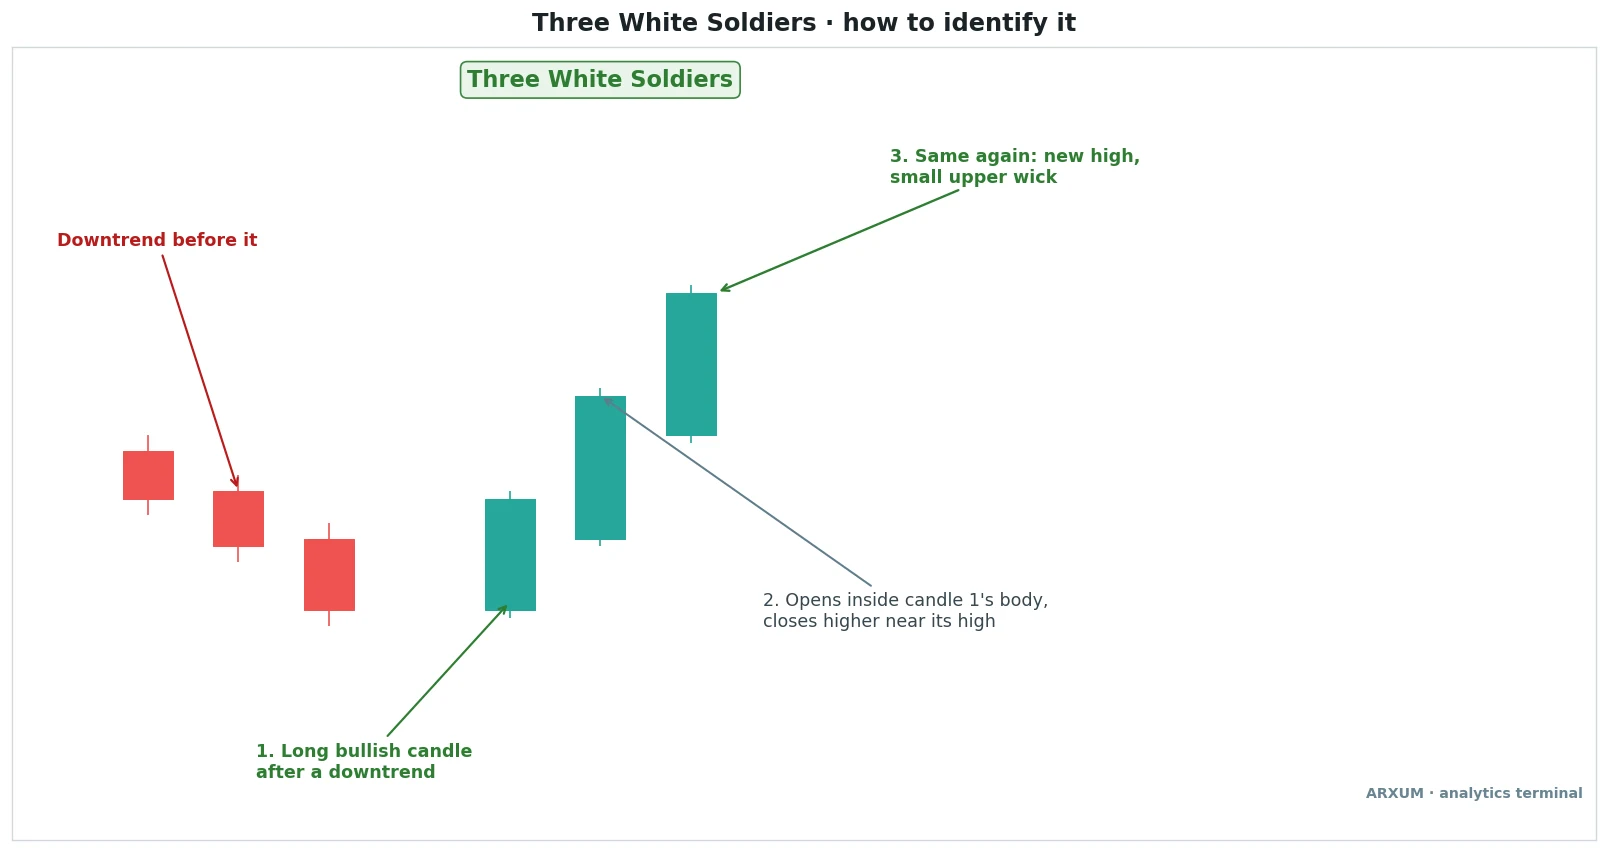
Read the picture left to right. The red candles set the scene, the three green ones do the work.
- The context: a decline or a long sideways stretch comes first. Without it, three green candles are just a normal up day.
- Soldier 1: a long bullish body that closes well above its open. It is the first sign buyers have stepped in with size.
- Soldier 2: opens somewhere inside the first body, not far above it, then closes above the first candle’s close.
- Soldier 3: repeats the move. Another higher close, another short upper wick.
- The wicks: short upper wicks matter most. They show price closed near the top, so sellers could not push it back.
The rules in one table
| Rule | What to check | Why it matters |
|---|---|---|
| Prior move | Downtrend or flat base | Gives the shift meaning |
| Three bullish candles | All close above open | Buyers win each session |
| Long bodies | Bigger than recent candles | Shows real conviction |
| Higher closes | Each close above the last | Steady progress |
| Opens in prior body | Or at the prior close | No exhausting gap |
| Short upper wicks | Close near the high | Sellers failed to fade it |
One practical note on the “opens inside the prior body” rule. On Forex and Bitcoin, the next candle usually opens right at the previous close, because the market trades almost around the clock.
- Treat an open at, or a hair below, the prior close as valid.
- Stock charts gap overnight, which is where the strict textbook wording comes from.
- What you want to avoid is a big gap UP before soldier 2 or 3. That looks like excitement, not steady buying.
What the Pattern Actually Tells You
Each candle is a short story about who controlled that session. Three in a row tells you the balance has shifted, not that it will hold.
| Candle | What happened | What it suggests |
|---|---|---|
| Soldier 1 | Buyers overpower sellers | A possible bottom |
| Soldier 2 | Dip buyers defend the open | Demand is not one-off |
| Soldier 3 | Another close near the high | Control has changed hands |
| The next candles | Pause, dip or continue | Tells you if it holds |
- It is a strength signal more than a timing signal. It confirms buyers are in charge after the fact.
- It is a three-candle pattern, so it is slower than single-candle tells like the hammer or a bullish engulfing candle.
- It often appears AFTER one of those faster signals has already flagged the low. Think of it as the follow-through.
The rule of thumb: soldiers confirm a turn, they rarely catch the exact bottom.
Three White Soldiers vs Its Warning Variants
Not every run of three green candles is a clean set of soldiers. Two look-alikes warn that buyers are tiring, and they matter more than the textbook name.
| Variant | How it looks | The read |
|---|---|---|
| Clean soldiers | Equal or growing bodies | Healthy buying |
| Advance block | Shrinking bodies, longer upper wicks | Buyers fading |
| Stalled pattern | Third candle small or a spinning top | Push has paused |
| Overextended run | Three huge bodies far from any average | Pullback likely first |
- Advance block: the bodies get smaller and the upper wicks get longer. Each push higher meets more selling near the top.
- Stalled pattern (also called deliberation): the first two candles are strong, then the third is tiny, often a spinning top (a small body with wicks on both sides). The market is thinking about it.
- Overextended run: three very large candles straight up, often after news. The pattern is valid, but price is far from its recent average and tends to snap back before going on.
None of these mean “go short”. They mean “do not buy here, wait for a better spot”.
Method 1: The Reversal Read After a Downtrend
This is the textbook use, and the one most search results stop at. The soldiers print after a clear decline, ideally at a level that has held before.
How it looks:
- A run of lower highs and lower lows, then selling slows down.
- Often a small reversal candle first, such as a doji (open and close almost equal, a sign of indecision) or a hammer, right at the low.
- Then the three soldiers lift price back above the last few red candles.
The table below mentions the RSI, a momentum gauge explained in the notes under it.
| Role | How you use it | Best read |
|---|---|---|
| Trend read | Downtrend losing grip | D1 on gold, EUR/USD |
| Entry trigger | Buy the first pullback after | H4 on Forex majors |
| Confirmation | Pattern at real support | D1 / H4, any market |
| Second gauge | RSI climbs out of oversold | H4 / D1 |
| Filter | Skip if higher timeframe still falls hard | Check D1 before H4 |
| Exit cue | Next resistance or a bearish reversal | Same timeframe as entry |
A few notes on making this one work:
- Location beats shape. Soldiers off a well-tested support level carry far more weight than soldiers in the middle of nowhere.
- The RSI read: the RSI is a 0-100 momentum gauge, free on TradingView. A move from below 30 back above it during the soldiers adds weight to the turn.
- Higher timeframe first: if the daily chart is in a steep decline, a three-candle bounce on the 1-hour is usually just a breather.
Where it fits best: spot gold (XAU/USD) and EUR/USD on the daily and 4-hour charts, where swings are clean and levels are respected.
Method 2: The Breakout From a Flat Base
The second popular use has nothing to do with a downtrend. Price drifts sideways in a tight range, then three soldiers push it out the top.
Here is a recent example on Bitcoin, on the 4-hour chart.
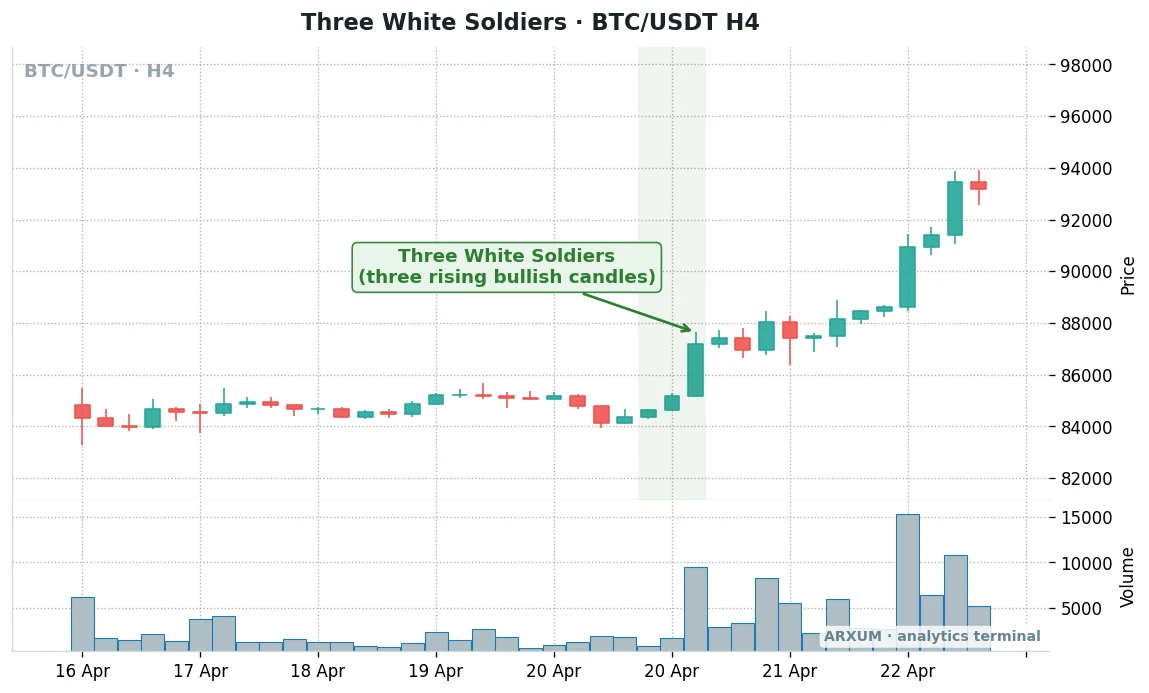
What to notice on that chart:
- The base: several days of small candles in a narrow band. Nobody was in control.
- Growing bodies: the first soldier is small, the third is the biggest. That makes it a valid but less textbook set, and the opposite of an advance block.
- Volume: the volume bar on the third candle stands well above the base’s quiet bars. Real participation, not a thin drift.
- The pause after: a few small mixed candles followed, then the trend continued. That pause is where calmer entries live.
| Role | How you use it | Best read |
|---|---|---|
| Entry trigger | Close above the range high | H4 on BTC, gold |
| Confirmation | Volume above the base average | BTC, exchange volume |
| Trend read | Base breaks in trend direction | D1 trend, H4 trigger |
| Filter | Range must be tight and clear | H1 / H4 |
| Exit cue | Close back inside the range | Same timeframe |
- Volume on Forex is tick volume. It counts price changes, not money traded, so treat it as a rough guide on EUR/USD and gold. On Bitcoin, exchange volume is the real thing. Our on-balance volume guide covers how to read it.
- Best markets: Bitcoin and gold, which tend to coil and then move hard. GBP/USD also breaks ranges sharply around the London open.
- The trap: a base that breaks on three soldiers with no volume often slides straight back in.
Method 3: The Trend-Continuation Pullback
The third use is the one experienced traders lean on most. The soldiers tell you a trend has started, then you wait for the first dip to join it.
Here is that sequence on EUR/USD, also on the 4-hour chart.
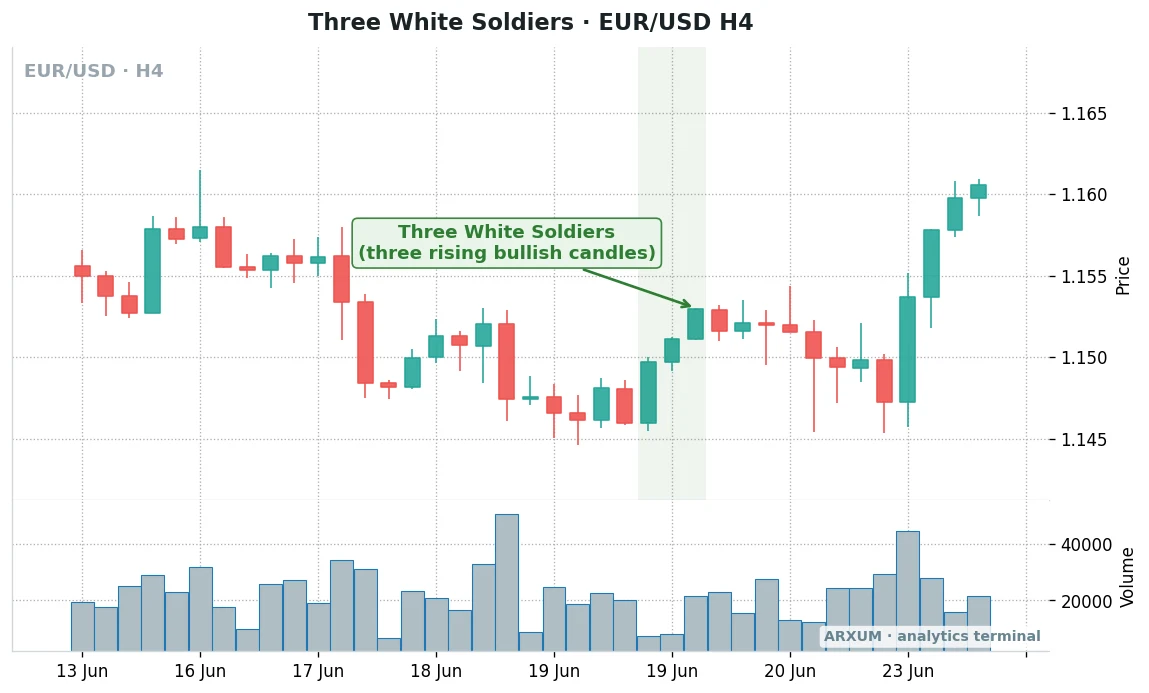
This chart is a good lesson in why the third candle is a poor entry.
- Uneven bodies: the first soldier is by far the longest, and the second and third are much smaller. Buying was real but lost pace after candle 1.
- Quiet volume: the volume bars under the pattern sit low compared with the selloff before it.
- The pullback: price gave back most of the move over the next couple of days. Anyone who bought the third close sat through the whole dip.
- The payoff: the trend still resumed from there, though the dip came within a whisker of soldier 1’s low. It is also why the stop belongs below soldier 1’s low, not just under soldier 3.
The 20 EMA in the table below is a moving average, explained in the notes under it.
| Role | How you use it | Best read |
|---|---|---|
| Trend read | Soldiers mark a fresh up-leg | H4 / D1 |
| Entry trigger | Bullish candle on the pullback | H1 inside an H4 setup |
| Pullback zone | Middle of soldiers 1 to 2 | H4 on EUR/USD, gold |
| Second gauge | Price holds above the 20 EMA | H4 |
| Filter | Pullback stays above soldier 1's low | Same timeframe |
| Exit cue | Three black crows or a lower low | Same timeframe |
- The 20 EMA: an exponential moving average smooths price over the last 20 candles. On TradingView, search “Moving Average Exponential” and set the length to 20.
- Where to wait: many traders look for the dip to reach the midpoint of the soldiers, roughly where soldier 2 opened.
- Invalidation: if price falls back below the low of soldier 1, the whole pattern has failed. Stand aside.
Where Each Market and Timeframe Fits
The pattern ports to any liquid market, but it behaves differently on each. Use this as a starting map, then adjust to what your own charts show.
| Market | H1 | H4 | D1 |
|---|---|---|---|
| Gold (XAU/USD) | Noisy | Good | Best |
| EUR/USD | Session-driven | Best | Good |
| GBP/USD | London breaks | Good | Good |
| Bitcoin (BTC) | Very noisy | Best | Good |
Why the timeframe changes the read:
- H1: three green hours can simply be one news release or one session’s flow. Use H1 mainly to time entries inside a higher-timeframe setup.
- H4: the sweet spot for most traders. Three 4-hour soldiers cover half a day of steady buying, which carries meaning.
- D1: the strongest version. Three daily soldiers are three full sessions of buyers winning, and they show up less often.
And why the market matters:
- Spot gold trends in long legs, so daily soldiers off support are a classic swing setup.
- EUR/USD moves in calmer steps. The 4-hour pullback method suits its rhythm.
- GBP/USD is jumpier. Watch for overextended soldiers around the London and New York opens.
- Bitcoin trades every hour of every day, so the 1-hour fills with false soldiers. Stick to 4-hour and daily.
Three Black Crows: The Bearish Mirror
Flip the pattern upside down and you get three black crows. Three long red candles, each opening inside the prior body and closing near its low.
| Feature | Three white soldiers | Three black crows |
|---|---|---|
| Candle colour | Green (bullish) | Red (bearish) |
| Prior move | Downtrend or base | Uptrend or base |
| Closes | Near each high | Near each low |
| Short wick | Upper wick | Lower wick |
| Signals | Buyers take control | Sellers take control |
| Weak variant | Advance block | Shrinking red bodies |
- On Forex and CFDs (contracts for difference, which track a price without you owning the asset), trading the crows is just a sell order. There is nothing exotic about going short.
- For a long trade, the crows are your most useful exit cue. Three black crows inside an uptrend say the buyers have left.
- Our bearish candlestick patterns guide walks the crows alongside the evening star and the shooting star.
Confirmations That Add Weight
The pattern on its own is a decent read. Stacked with one or two context checks, it becomes something you can plan a trade around.
| Confirmation | What you want | Where to find it |
|---|---|---|
| Location | At support or a range edge | Your own drawn levels |
| Volume | Rising into soldier 3 | Volume panel |
| RSI | Leaving oversold, not above 70 | RSI, length 14 |
| Higher timeframe | Not in a steep decline | Check D1 first |
| Moving average | Price reclaims the 20 or 50 EMA | EMA indicator |
| Prior signal | Hammer, doji or morning star | The candles before |
- You do not need all six. Two strong ones beat a checklist of weak ones.
- RSI above 70 (overbought) right at soldier 3 is a warning, not a confirmation. The move is already hot.
- A morning star followed by soldiers is a strong one-two. The star marks the turn, the soldiers prove it.
Which Method to Use When
Same pattern, three jobs. The context on your chart picks the method for you.
| Your chart shows | Method | Entry style |
|---|---|---|
| Clear downtrend into support | Reversal read | First pullback |
| Tight sideways range | Base breakout | Close above range |
| Fresh up-leg already running | Continuation pullback | Dip to soldier midpoint |
| Shrinking bodies, long wicks | None yet | Wait |
| Three huge news candles | None yet | Wait for a pullback |
| Steep downtrend on D1 | None on H1 | Stand aside |
How to Trade It: Entry, Stop and Size
Below is a calm, repeatable way to turn the pattern into one trade. It uses the pullback entry, because that is the one that keeps the stop tight.
- Spot the soldiers on the 4-hour or daily chart, and check the prior move and the wicks.
- Check one or two confirmations from the table above, such as location and volume.
- Wait for the pullback toward the middle of the soldiers. Do not buy the third close.
- Enter on a bullish candle in that zone, or with a buy limit order (an order that fills only if price dips to your level) at the level you marked.
- Place the stop below the low of soldier 1. If that is too far, below the low of the pullback.
- Set a target at the next resistance level, or at least twice your stop distance.
That last point uses the risk-reward ratio, written 1:X. The 1 is what you risk, the X is what you aim to make, so 1:2 means aiming for twice the risk.
A worked sizing example on EUR/USD
Say you trade a $1,000 account and risk 2% per trade. The stop sits 30 pips below your entry.
A pip is the standard small price step on a currency pair. On EUR/USD, one pip = 0.0001.
| Step | Working | Result |
|---|---|---|
| Risk budget | $1,000 × 2% | $20 |
| Stop distance | Entry minus stop | 30 pips |
| Pip value, 1 micro lot | 0.01 lot on EUR/USD | $0.10 |
| Risk per micro lot | 30 × $0.10 | $3 |
| Position size | $20 ÷ $3 = 6.7 | 6 micro lots (0.06) |
| Target at 1:2 | 60 pips × $0.60 | about $36 |
- Round DOWN, never up. Six micro lots risk $18, inside the budget.
- In the order ticket, that means volume 0.06, stop-loss 30 pips below entry, take-profit 60 pips above.
- Six micro lots on $1,000 is roughly 1:7 effective leverage. Broker leverage of 1:100 or more is just margin room that lets you open the size, not extra risk.
A few lines on discipline, specific to this pattern:
- Soldiers fail more often in choppy markets, so expect strings of small losses when ranges dominate. If 3 to 6 losses arrive in a row, the market regime may have changed. Pause and reassess.
- The pullback entry means some trades never fill. That is fine, and chasing the missed move is how most soldier traders give back their gains.
- Risk only money you can afford to lose, and keep the same 2% whether the last trade won or lost.
Common Mistakes With Three White Soldiers
Most losses on this pattern come from the same handful of habits.
- Buying the third close. The move is already extended, the stop is far away, and a pullback is common.
- Ignoring context. Three green candles in the middle of an existing uptrend are not a reversal, just more trend.
- Missing the advance block. Shrinking bodies and growing upper wicks are a warning dressed up as a signal.
- Trusting the 1-hour on Bitcoin. Round-the-clock trading prints false soldiers constantly on fast charts.
- No invalidation level. If price falls back under soldier 1’s low, the pattern is broken. Exit, do not hope.
- Fighting the higher timeframe. A 4-hour bounce inside a steep daily downtrend usually rolls over.
What Works: The Short Version
If you remember three things from this guide, make it these.
- Read the variant, not just the name. Clean, equal or growing bodies with short upper wicks are the real thing. Shrinking bodies are a warning.
- Let the context pick the method. Downtrend into support = reversal read. Tight range = breakout. Fresh up-leg = continuation pullback.
- Enter on the pullback, not the third candle. The stop goes under soldier 1, and the target goes at the next resistance.
To chart it, TradingView is free and shows every market used here. MT4 and MT5 show the same candles, and both let you add the RSI and the EMA from the indicator menu.
For the bigger picture, our candlestick patterns guide ranks the soldiers against every other major formation.
Key Terms
- Body: the thick part of a candle, between its open and close.
- Wick: the thin line above or below the body, showing the session’s high or low.
- Advance block: three rising candles with shrinking bodies and longer upper wicks. A weakening version of the soldiers.
- Stalled pattern: two strong soldiers and a small third candle. The push has paused.
- Three black crows: the bearish mirror, three long red candles closing near their lows.
- Pip: the standard small price step on a currency pair, 0.0001 on EUR/USD.
- Tick volume: on Forex, a count of price changes per candle, used as a stand-in for traded volume.
- H1 / H4 / D1: chart timeframes, where each candle is one hour, four hours or one day.
FAQ
What is the three white soldiers pattern, in plain terms?
It is three long green candles in a row, each opening inside the previous body and closing near its own high. It shows buyers winning three sessions straight, usually after a downtrend or a flat base, and it is read as a sign that control has shifted to the buyers.
Is three white soldiers bullish or bearish?
Bullish. Its bearish counterpart is the three black crows.
Is the three white soldiers pattern reliable?
It is a solid strength signal when the context is right: after a decline, at support, with rising volume and short upper wicks. It is much weaker in the middle of a range or when the bodies shrink. Its main flaw is timing, since the move is already stretched by the third candle, so most traders wait for a pullback rather than buying the close.
What is the best timeframe for three white soldiers?
The 4-hour and daily charts. Three daily soldiers mean three full sessions of buying, which carries real weight. On the 1-hour, three green candles can be a single news spike or one session's flow, so use H1 mainly for timing an entry inside a higher-timeframe setup. On Bitcoin especially, avoid the fast charts.
Where should I put my stop-loss?
Below the low of the first soldier, because a break under it means the pattern has failed. If that leaves the stop too wide for your account, enter on a pullback and place the stop under the pullback low instead.
What is the difference between three white soldiers and three black crows?
They are mirror images. Three white soldiers are three long bullish candles closing near their highs after a decline. Three black crows are three long bearish candles closing near their lows after a rally. Soldiers suggest buyers have taken over, crows suggest sellers have. A trader holding a long position often treats crows as an exit signal.
What is an advance block?
It is a weak version of the soldiers. The three candles still close higher, but each body is smaller and the upper wicks get longer. That shows sellers meeting each push near the top. It is a reason to wait, not to buy.
Does the pattern work on Forex and crypto?
Yes, with one adjustment. Forex and Bitcoin rarely gap, so the next candle usually opens at the previous close rather than inside the body. Treat that as valid. Forex volume is tick volume, a rough guide only, while Bitcoin exchange volume is a more direct read. Gold and EUR/USD suit the 4-hour and daily charts well.
How much money do I need to trade it?
A few hundred dollars is enough on Forex using micro lots. On a $1,000 account risking 2% with a 30-pip stop on EUR/USD, the right size is about 6 micro lots. The pattern is the same on any account size; what changes is the lot you click.
What do the key terms mean?
Body: the thick part of a candle between open and close. Wick: the thin line showing the high or low. Advance block: rising candles with shrinking bodies, a warning. Stalled pattern: two strong soldiers then a small third candle. Three black crows: the bearish mirror. Tick volume: Forex's count of price changes per candle. H1, H4, D1: one-hour, four-hour and daily charts.
Real-time trade setups with entry, stop loss and take profit. Daily market analysis. No subscription, no complicated theory.
🌍 Our recommended brokers


Reader Reviews
Be the first to review this — tell other traders what actually helped, or where it fell short.
Leave a Review

Momentum Trader & Technical Analyst
Trades momentum across crypto and forex since 2019, built around RSI, MACD, and volume. Turns discretionary setups into rule-based, systematic entries and validates them on data before they go live.