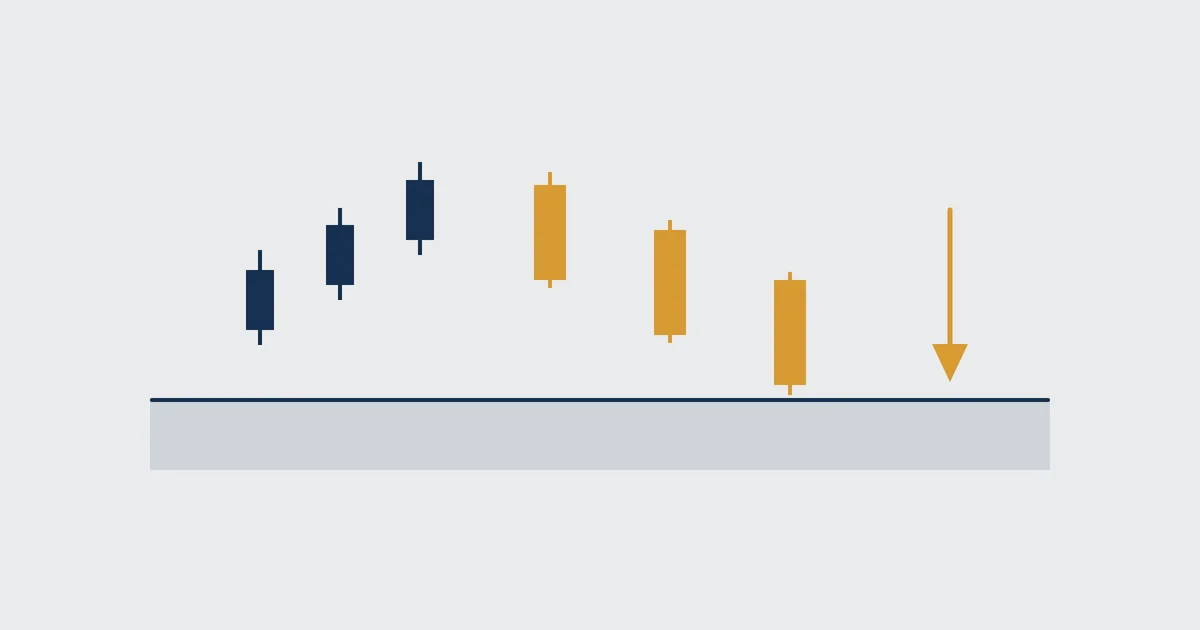

What the Three Black Crows Pattern Looks Like
This is the textbook shape every candlestick course teaches. A market climbs, then three strong bearish candles walk it back down.
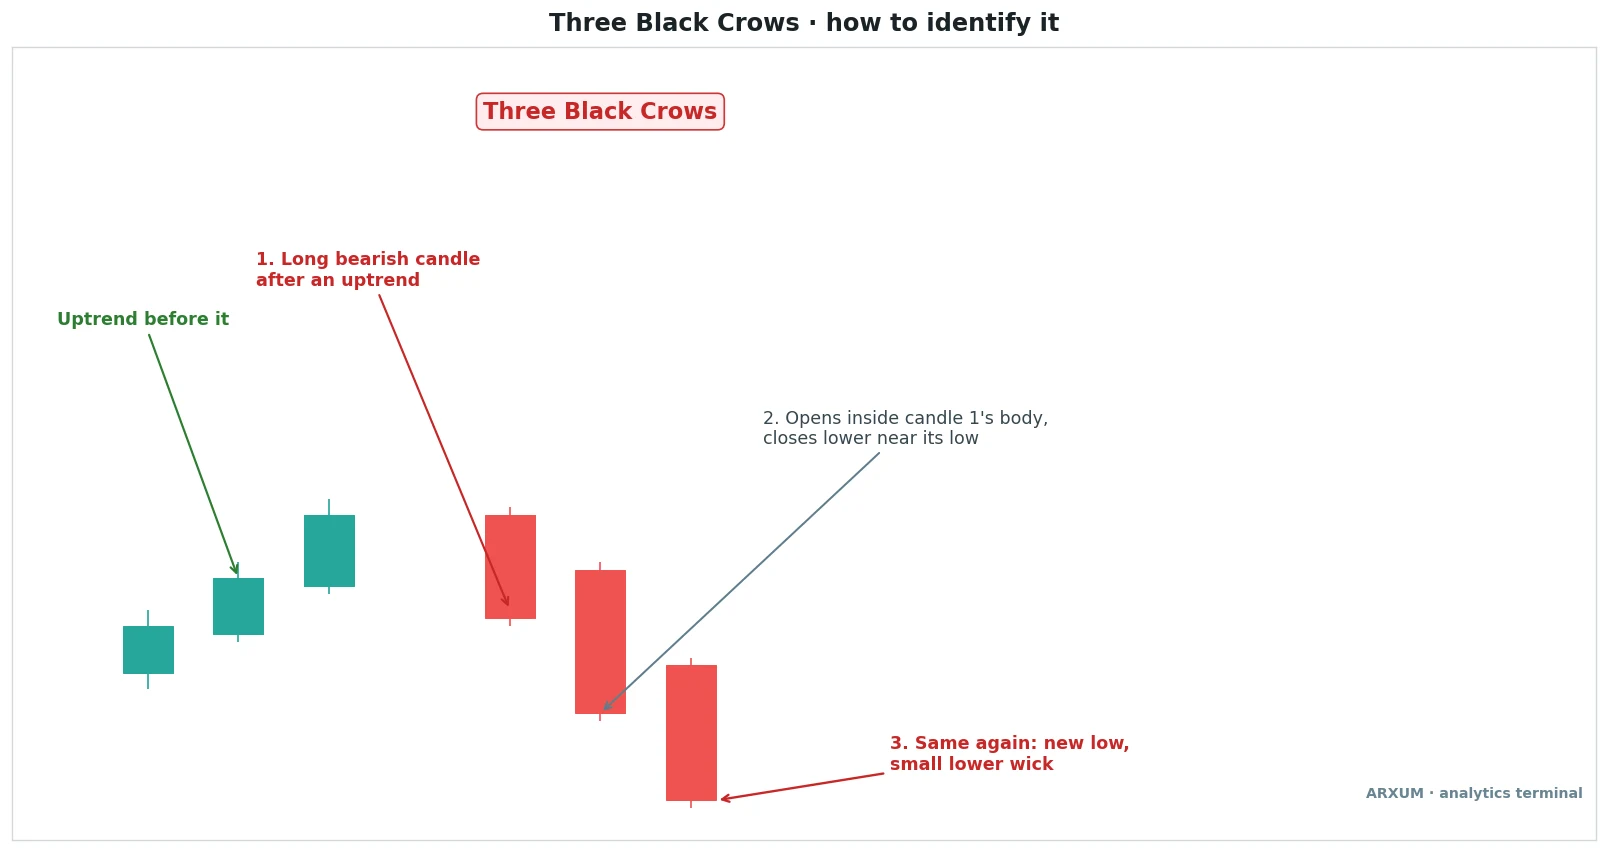
Read it left to right. The green candles are the setting, the three red ones are the event.
- The setting: a rise or a rally comes first. Three red candles in the middle of a long decline are just more decline.
- Crow 1: a long red body that closes well under its open. It is the first session where sellers clearly took over.
- Crow 2: opens somewhere inside the first body, then closes below crow 1’s close.
- Crow 3: repeats it. Another lower close, another short lower wick.
- The lower wicks: short ones matter most. They show the candle closed near its low, so buyers could not lift it back.
The checklist, rule by rule
| Rule | What to check | Why it matters |
|---|---|---|
| Prior move | A rally or uptrend | Gives the turn meaning |
| Three red candles | All close below open | Sellers win each session |
| Long bodies | Bigger than recent candles | Real selling pressure |
| Lower closes | Each close under the last | Steady markdown |
| Opens in prior body | Or at the prior close | No panic gap down |
| Short lower wicks | Close near the low | No buyers at the close |
A word on the open rule for 24-hour markets. Forex and Bitcoin almost never gap, so each crow usually opens right at the last close.
- Count an open at the previous close, or a fraction above it, as valid.
- The strict “inside the body” wording comes from stock charts, which gap overnight.
- A large gap DOWN before crow 2 or 3 is the thing to be wary of. It reads as a flush, and flushes often bounce.
What the Crows Are Telling You
Each red candle is a session that sellers controlled from open to close. Three of them in a row says the balance has shifted, not that it will stay shifted.
| Candle | What happened | The read |
|---|---|---|
| Crow 1 | Sellers overpower the rally | A possible top |
| Crow 2 | Bounce attempts get sold | Supply is not one-off |
| Crow 3 | Another close near the low | Control has changed |
| Next 2-5 candles | Bounce, pause or follow-through | The real verdict |
- It is a confirmation pattern, not an early warning. By the time crow 3 closes, a good chunk of the drop has already happened.
- Faster tells often come first. A shooting star, a hanging man or a bearish engulfing candle (a red candle whose body fully covers the previous green body) can flag the high one to three candles earlier.
- The crows are what turns that early hint into a visible shift in control.
The plain rule: crows confirm a top. They rarely sell you the exact high.
Variants: Clean Crows, Identical Crows and the Weak Set
Three red candles in a row is common. Three that deserve the name are rarer, and the differences between them change what you do next.
- Clean crows: three long bodies of similar or growing size, each closing near its low. The textbook version.
- Identical three crows: each crow opens right at, or very close to, the previous close. Traders read it as an even more forceful variant, because there is no bounce at all between sessions.
- Shrinking crows: the bodies get smaller and the lower wicks get longer. Each push down meets more buying, so the selling is tiring.
- Stretched crows: three huge red bodies, often on news, ending far below any moving average. Valid, but price usually bounces before it falls further.
| Variant | How it looks | What to do |
|---|---|---|
| Clean crows | Even bodies, short lower wicks | Plan a trade |
| Identical crows | Each opens at last close | Plan a trade |
| Shrinking crows | Smaller bodies, long lower wicks | Wait |
| Stretched crows | Huge bodies, far from average | Wait for a bounce |
None of the weak versions is a buy signal. They just mean the sell is not ready yet.
Method 1: The Reversal Sell at a Top
The classic use is a short after a rally runs out of steam. Here is a recent example on EUR/USD, on the 4-hour chart.
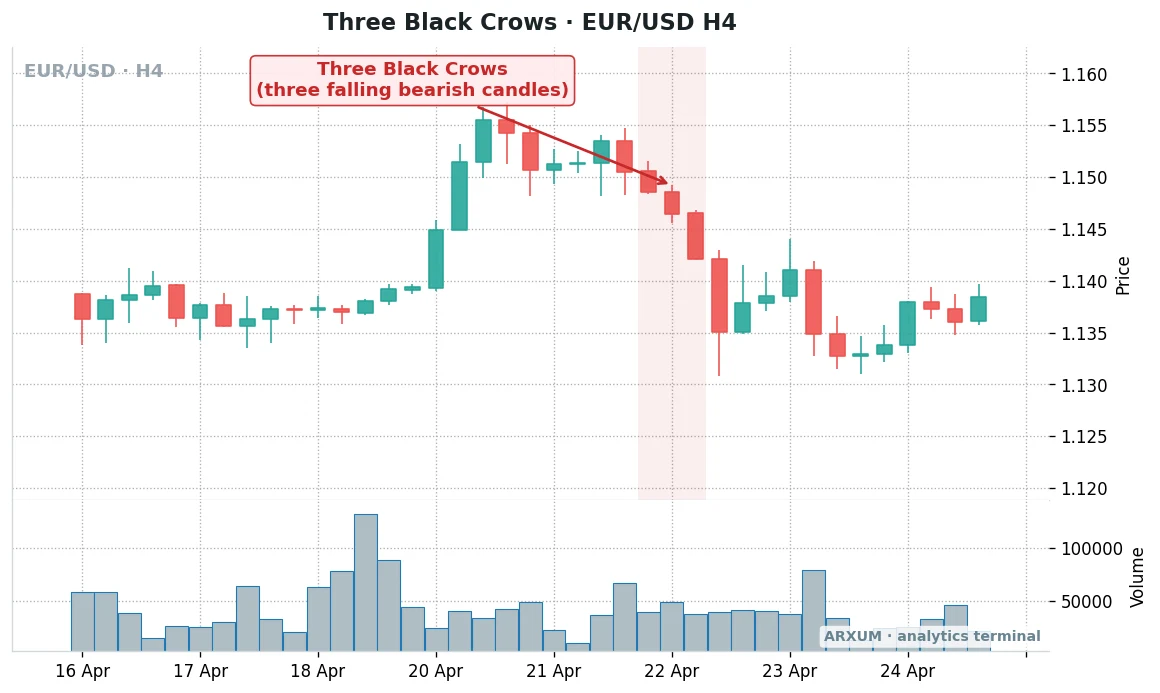
What to notice on the EUR/USD chart:
- The rally: about a day of strong green candles from 1.139 to near 1.157. A big move, quickly made.
- The stall: the next session went sideways near the high with small mixed candles. That pause is the first hint buyers were done.
- Growing bodies: the first crow is the smallest and the third is the largest. Selling sped up, the opposite of the shrinking set.
- The follow-through: one more long red candle followed, then a bounce to about 1.141 that failed below the crows’ starting point.
- Volume: tick volume stays ordinary under the crows. On Forex that is normal, so price shape carries more weight than the bars.
| Role | How you use it | Best read |
|---|---|---|
| Trend read | Rally stalls, crows break it | H4 / D1 on FX majors |
| Entry trigger | Close below crow 3's low | H4, timed on H1 |
| Location check | Crows start at resistance | D1 levels, any market |
| Second gauge | RSI falls back under 70 | H4 / D1 |
| Filter | Room down to next support | Mark it on D1 |
| Exit cue | Next support or a bullish reversal | Same timeframe |
Making this method work in practice:
- The entry: sell when a candle closes below crow 3’s low. On the EUR/USD chart that was the extra long red candle. You give up the bounce entry of Method 3 in exchange for not missing the move.
- Start at resistance. Crows that begin at a well-tested resistance level carry far more weight than crows in open space.
- The RSI read: the RSI is a 0-100 momentum gauge, free on TradingView. A drop from above 70 back below it while the crows print adds weight to the top.
- Measure the room. If the nearest support sits just under crow 3, there is nothing left to sell into.
Best fit: EUR/USD and GBP/USD on the 4-hour and daily charts, plus spot gold (XAU/USD) on the daily, where tops form over several sessions.
Method 2: The Exit Cue on a Long Trade
Many traders never short the crows at all. They use them to get out of a long position that has stopped working.
| Your position | Crows appear | Typical action |
|---|---|---|
| Long, in profit | After a strong run | Take profit or tighten stop |
| Long, near entry | Right after entry | Exit, setup failed |
| Long, trailing stop | Close under trail level | Let the stop work |
| Flat, waiting to buy | At your buy zone | Stand aside |
Why this is the most forgiving use:
- It asks less of the pattern. You only need the crows to say “momentum has gone”, not “a big drop is coming”.
- It suits slower markets. A long swing trade on gold or EUR/USD can give back weeks of gains in three daily crows.
- It pairs well with a trailing stop. Move the stop up to just above crow 3’s high, and the market decides the rest.
One honest limit: if the crows are shrinking or stretched, closing the whole position can cut a winner too early. Taking part off and trailing the rest is the common compromise.
Method 3: Sell the Bounce After the Crows
The third approach treats the crows as the start of a new down-leg. Method 1 sells the breakdown right away.
Here you let the market bounce first, then join the move at a better price.
| Step | What you watch | Where on the chart |
|---|---|---|
| 1 | Crows break a rally | The three crow candles |
| 2 | Price stops falling | 1-3 candles after crow 3 |
| 3 | A bounce into the crows | Crow 1-2 midpoint |
| 4 | A bearish candle there | The sell trigger |
On the EUR/USD 4-hour chart in Method 1, that bounce came after the extra red candle. It lifted price to about 1.141, short of where crow 2 opened, and the next leg took it back to the 1.133 area.
| Role | How you use it | Best read |
|---|---|---|
| Trend read | Crows mark a fresh down-leg | H4 / D1 |
| Pullback zone | Middle of crows 1 to 2 | H4 on EUR/USD, gold |
| Entry trigger | Bearish candle in the zone | H1 inside an H4 setup |
| Second gauge | Price stays below the 20 EMA | H4 |
| Invalidation | Close above crow 1's high | Same timeframe |
| Exit cue | Next support or soldiers | Same timeframe |
- The 20 EMA: an exponential moving average smooths price over the last 20 candles. On TradingView, search “Moving Average Exponential” and set the length to 20.
- The bounce is the gift. It lets you place the stop above crow 1’s high from a higher entry, so the stop is shorter.
- Some bounces never come. A missed trade costs nothing, which is the whole point of waiting.
- If price climbs back above crow 1’s high, the pattern has failed. The sellers lost, so stand aside.
When the Crows Fail: Selling Into Support
The most common way to lose on three black crows is to sell them at the floor of a range. Here is how that looked on Bitcoin, on the daily chart.
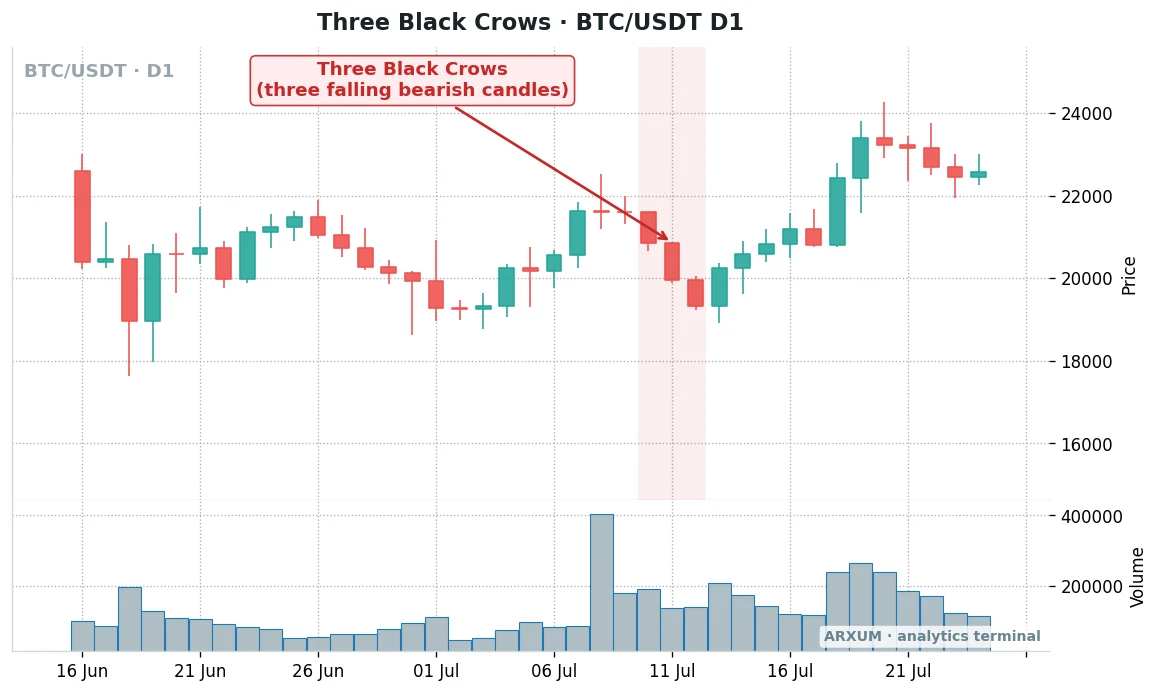
Why this set of crows was a trap:
- Location: crow 3 closed right on the lows that had held for weeks. Selling there meant selling into a wall of buyers.
- The rally before was short. One week up inside a sideways range is not the kind of uptrend the pattern is meant to reverse.
- Volume did not confirm. The heaviest volume bar came at the top of the rally, before the crows, and selling volume stayed ordinary.
- The pattern itself looked fine. Three long red bodies, falling closes, short lower wicks. Shape alone would have said “sell”.
The lesson: the crows need room to fall. Check the distance to the next support before you check anything else.
| Warning sign | What it looks like | Better move |
|---|---|---|
| Crows into support | Crow 3 at a prior low | Skip the short |
| Short prior rally | A few days up in a range | Treat as range noise |
| Quiet selling | Volume flat or falling | Wait for more proof |
| RSI near 30 | Oversold by crow 3 | Wait for a bounce |
| D1 trend still up | Crows on H1 only | Expect a dip, not a top |
Where Each Market and Timeframe Fits
The pattern ports to any liquid market, but each one prints crows differently. Use this as a starting map.
| Market | H1 | H4 | D1 |
|---|---|---|---|
| EUR/USD | Session noise | Best | Good |
| GBP/USD | News-driven | Good | Good |
| Gold (XAU/USD) | Noisy | Good | Best |
| Bitcoin (BTC) | Very noisy | Good | Best |
By timeframe:
- H1: three red hours can be a single data release or one session’s selling. Use H1 to time an entry inside a bigger setup.
- H4: half a day of steady selling. The most practical frame for Forex majors.
- D1: three full days of sellers in control. Rarer, slower, and the version that most often marks a real swing top.
By market:
- EUR/USD moves in measured steps, so H4 crows at a clear high are the cleanest Forex read.
- GBP/USD is jumpier around the London and New York opens. Stretched crows after news are common there.
- Spot gold climbs in long legs. Daily crows after an extended run are a classic place to bank a long, more than to fade the trend.
- Bitcoin trades nonstop, so lower timeframes fill with false crows. The daily chart, as the Bitcoin example shows, still needs the support check.
How a Short Works on Each Market
Selling the crows is just a sell order on most platforms. The details differ slightly by market.
| Market | How you go short | What to watch |
|---|---|---|
| Forex pairs | Sell order | Overnight swap |
| Gold CFD | Sell order | Spread at the open |
| Bitcoin spot | Sell what you hold | No short on spot |
| Bitcoin futures | Open a short | Funding rate |
- On Forex and CFDs (contracts for difference, which track a price without you owning the asset), a short needs no borrowing. You click Sell instead of Buy.
- A swap is the small daily fee or credit for holding a position overnight. It matters on multi-day trades, less on intraday ones.
- A funding rate is a small payment swapped between long and short holders of Bitcoin perpetual futures every few hours. When it is negative, shorts pay longs, so a crowded short costs money to hold.
- On Bitcoin spot, the crows are mostly an exit signal, which is Method 2.
Three Black Crows vs Other Bearish Patterns
Most traders meet the crows alongside a handful of other top signals. Here is how they compare on speed and job.
| Pattern | Candles | Main job |
|---|---|---|
| Shooting star | 1 | Early warning |
| Bearish engulfing | 2 | Fast reversal signal |
| Evening star | 3 | Turn at the high |
| Three black crows | 3 | Confirms the shift |
- The evening star and the crows are both three-candle patterns, but they do different work. The star marks the turn, the crows prove the follow-through.
- An evening star followed by crows is a strong one-two. The stop above the star’s middle candle is often tighter than one above crow 1.
- The bearish candlestick patterns guide ranks all of these side by side.
Three black crows vs three white soldiers
| Feature | Black crows | White soldiers |
|---|---|---|
| Direction | Bearish | Bullish |
| Comes after | A rally | A decline |
| Closes | Near each low | Near each high |
| Short wick | Lower wick | Upper wick |
| Weak variant | Shrinking crows | Advance block |
The two are mirror images. A trader long from a set of soldiers often uses the first clean crows as the exit.
Confirmations Worth Adding
The crows on their own are a decent read. One or two context checks turn them into something you can plan around.
| Check | What you want | Where to find it |
|---|---|---|
| Location | Start at resistance | Your drawn levels |
| Room below | Clear space to support | D1 chart |
| Volume | Rising into crow 3 | Volume panel |
| RSI | Falls from above 70 | RSI, length 14 |
| Moving average | Price loses the 20 EMA | EMA indicator |
| Earlier signal | Star or engulfing at the high | Candles before |
- Two strong checks beat six weak ones. Location and room below come first.
- RSI already near 30 at crow 3 cuts the other way. The selling is stretched, so a bounce is likely before any further drop.
- On Forex, read volume as a rough guide only, since tick volume counts price changes, not money.
Which Method to Use When
The chart in front of you picks the method. Match the situation to the row.
| Your chart shows | Method | Entry style |
|---|---|---|
| Rally stalls at resistance | Reversal sell | Close below crow 3's low |
| You are long and in profit | Exit cue | Close or trail |
| Fresh down-leg underway | Sell the bounce | Crow 1-2 midpoint |
| Crow 3 sits on support | None | Stand aside |
| Shrinking red bodies | None yet | Wait |
| Strong D1 uptrend, H1 crows | Exit cue only | No short |
How to Place the Trade: Entry, Stop and Size
Here is one calm way to turn the pattern into a short trade, using the bounce entry from Method 3.
- Spot the crows on the 4-hour or daily chart and confirm a rally came first.
- Check the room down to the next support on the daily chart.
- Wait for a bounce toward the middle of crows 1 and 2.
- Sell on a bearish candle there, or use a sell limit order (it fills only if price rises to your level).
- Put the stop just above crow 1’s high, plus a few pips of buffer.
- Set the target at the next support, or at least twice the stop distance.
That target uses the risk-reward ratio, written 1:X. The 1 is what you risk and the X is what you aim to make, so 1:2 means aiming for twice your risk.
Worked example: a short on GBP/USD
Say you have a $1,000 account and risk 2% per trade. Your stop sits 40 pips above the entry.
A pip is the small standard price step on a currency pair, 0.0001 on GBP/USD. A micro lot is 0.01 of a standard lot, worth about $0.10 per pip on GBP/USD.
| Step | Working | Result |
|---|---|---|
| Risk budget | $1,000 × 2% | $20 |
| Stop distance | Stop minus entry | 40 pips |
| Risk per micro lot | 40 × $0.10 | $4 |
| Position size | $20 ÷ $4 = 5 | 5 micro lots (0.05) |
| Target at 1:2 | 80 pips × $0.50 | about $40 |
- In the order ticket: Sell, volume 0.05, stop-loss 40 pips above entry, take-profit 80 pips below.
- Five micro lots on GBP/USD is roughly $6,500 of exposure, about 1:7 effective leverage on $1,000. Broker leverage of 1:100 or more is only margin headroom that lets you open that size, not extra risk.
- If the stop works out at 47 pips, the maths gives 4.25. Round down to 4 micro lots, never up.
The same idea on gold
Spot gold sizes differently. One micro lot (0.01) is 1 ounce, so each $1 move in price is $1 of profit or loss.
| Stop above entry | Risk on 0.01 lot | Fits a $20 budget? |
|---|---|---|
| $12 | $12 | Yes, 1 micro lot |
| $18 | $18 | Yes, 1 micro lot |
| $30 | $30 | No, skip or tighten |
- On a $1,000 account, daily gold crows often need a stop wider than $20. In that case the smallest lot already breaks the 2% rule.
- The honest fix is to use the 4-hour chart, where crow 1’s high sits closer, or to trade the setup on a currency pair instead.
Keeping it sane
The crows are a pattern that fails at range floors, as the Bitcoin chart shows. In sideways markets expect a run of small stop-outs.
- If 3 to 6 losses arrive in a row, the market regime may have changed. Pause and check whether you are selling into ranges.
- Do not re-sell the same set of crows after it stops you out. Revenge trades are how a 2% loss turns into 8%.
- Keep the 2% fixed after a big winner too. A great short on EUR/USD does not make the next set of crows any better.
- Risk only money you can afford to lose.
Common Mistakes With Three Black Crows
Most losses on this pattern trace back to a short list of habits.
- Selling crow 3’s close. Price has already dropped hard, the stop above crow 1 is far away, and bounces are common.
- Ignoring support. Crows that end on a prior low are the classic trap, as the Bitcoin example shows.
- Treating any three red candles as crows. In a long decline, they are continuation, not a top.
- Missing the shrinking set. Smaller red bodies with long lower wicks mean buyers are absorbing the selling.
- Shorting H1 crows against a strong daily uptrend. That is a dip, and dips get bought.
- No invalidation. A close back above crow 1’s high means the sellers lost. Exit, do not argue.
What Works: Three Things to Remember
- Location first. Crows that start at resistance and have room below are worth a trade. Crows that end on support are not.
- Let your position pick the method. Flat at a top: reversal sell. Long and in profit: exit cue. Fresh down-leg: sell the bounce.
- Enter on the bounce, stop above crow 1. It keeps the stop short and the risk-reward sensible.
To spot the pattern, TradingView is free and covers every market here. MT4 and MT5 show the same candles.
- TradingView: open Indicators and search “Three Black Crows” for the built-in candlestick script. Check each flag by eye, because it does not judge location.
- MT4 / MT5: add the RSI under Insert, Indicators, Oscillators, and the EMA under Insert, Indicators, Trend.
For the full family, our candlestick patterns guide places the crows next to every other major formation.
Key Terms
| Term | Meaning |
|---|---|
| Body | The thick part of a candle, between its open and close |
| Wick | The thin line above or below the body, marking the session's high or low |
| Identical three crows | A variant where each crow opens at the previous close |
| Shrinking crows | Red candles with smaller bodies and longer lower wicks, a sign selling is fading |
| Three white soldiers | The bullish mirror, three long green candles closing near their highs |
| Bearish engulfing | A red candle whose body fully covers the previous green body |
| Pip | The standard small price step on a currency pair, 0.0001 on GBP/USD and EUR/USD |
| Micro lot | 0.01 of a standard lot. On gold it equals 1 ounce |
| Tick volume | On Forex, a count of price changes per candle, used in place of traded volume |
| H1 / H4 / D1 | Timeframes where each candle is one hour, four hours or one day |
FAQ
What is the three black crows pattern, in plain terms?
It is three long red candles in a row after a rise. Each one opens inside or at the previous body and closes near its own low. Together they show sellers winning three sessions straight, which suggests the rally is over and control has passed to the sellers.
Is three black crows bullish or bearish?
Bearish. Its bullish mirror is the three white soldiers.
Is the three black crows pattern reliable?
It is a solid confirmation when the context is right: after a real rally, starting at resistance, with clear room down to the next support. It is weak in sideways ranges and when crow 3 lands on a prior low. Its main flaw is timing, because much of the drop has happened by the third close, so most traders wait for a bounce before selling.
What is the best timeframe for three black crows?
The 4-hour and daily charts. Daily crows mean three full days of selling, which carries real weight. On the 1-hour, three red candles can come from one news release, so use H1 only to time an entry inside a bigger setup.
Where should the stop-loss go on a three black crows short?
Just above the high of the first crow, plus a few pips of buffer. A close back above that level means the pattern has failed. If that stop is too wide for your account, wait for a bounce entry or drop to the 4-hour chart.
What is the difference between three black crows and an evening star?
Both are three-candle bearish patterns, but they do different jobs. The evening star is a turn: a strong green candle, a small indecisive candle, then a strong red one. The crows are three red candles in a row, so they confirm the selling has continued. An evening star followed by crows is a strong combination.
Why did my three black crows fail?
Usually location. If the third crow closed on a support level that had held before, buyers were waiting there. Other common causes are a short prior rally inside a range, shrinking red bodies, and a daily uptrend that was still strong.
Does the pattern work on Forex, gold and crypto?
Yes, with small adjustments. Forex and Bitcoin rarely gap, so a crow opening at the previous close counts. Forex volume is tick volume, a rough guide only. Gold suits the daily chart, Forex majors suit the 4-hour, and Bitcoin is cleanest on the daily. On Bitcoin spot, where you cannot short, use the crows as an exit signal.
How much money do I need to trade it?
A few hundred dollars works on Forex with micro lots. On a $1,000 account risking 2% with a 40-pip stop on GBP/USD, the size is 5 micro lots. Gold is harder on small accounts, because one micro lot with a wide daily stop can already exceed 2%.
Real-time trade setups with entry, stop loss and take profit. Daily market analysis. No subscription, no complicated theory.
🌍 Our recommended brokers


Reader Reviews
Be the first to review this — tell other traders what actually helped, or where it fell short.
Leave a Review

Forex Analyst & Senior Trader
Former FX desk trader with 8 years in institutional forex. Works in multi-timeframe analysis and order flow, turning desk experience into systematic, testable rules across forex and metals.